Last close As at 05/08/2026
GBP0.45
▲ 0.20 (0.45%)
Market capitalisation
GBP89m
Research: Financials
With more than 90% of assets under management equivalent (AUME) linked to equity and other market levels it was not surprising to see Record’s AUME fall by 9% in the quarter to end March. Positively, flows and client count moved little in the period. For FY20 as a whole AUME was up 2% in dollar terms, inflows were equivalent to 8% of the opening level and the number of clients increased by 11%. The group acts on a purely agency business, and has a sticky institutional client base and a strong net cash position.
Written by
Record |
A reassuring update |
Q420 trading update |
Financial services |
22 April 2020 |
Share price performance
Business description
Next events
Analysts
Record is a research client of Edison Investment Research Limited |
|||||||||||||||||||||||||||||||||||||||||||||||
With more than 90% of assets under management equivalent (AUME) linked to equity and other market levels it was not surprising to see Record’s AUME fall by 9% in the quarter to end March. Positively, flows and client count moved little in the period. For FY20 as a whole AUME was up 2% in dollar terms, inflows were equivalent to 8% of the opening level and the number of clients increased by 11%. The group acts on a purely agency business, and has a sticky institutional client base and a strong net cash position.
Year end |
Revenue (£m) |
PBT |
EPS* |
DPS** |
P/E |
Yield |
03/18 |
23.8 |
7.3 |
2.98 |
2.30 |
10.9 |
7.1 |
03/19 |
25.0 |
8.0 |
3.25 |
2.30 |
10.0 |
7.1 |
03/20e |
25.1 |
7.8 |
3.17 |
2.30 |
10.2 |
7.1 |
03/21e |
22.2 |
5.2 |
2.14 |
2.30 |
15.1 |
7.1 |
Note: **EPS is diluted. **DPS excludes special dividends.
Q4 AUME falls but flows positive for quarter and year
The AUME figure of $58.6bn for end March was down 9% compared with the end of December 2019 (and by 3% in sterling terms to £47.3bn). This was a satisfactory outcome given that nearly all passive and dynamic hedging and some multi-product mandates are linked to underlying equity or other market assets. On client AUME flows, a short-term tactical mandate of $1bn terminated in the period (previously announced). There was an inflow of $1.1bn into passive mandates, which, with other flows, meant a virtually neutral overall position in terms of client flows. The client count was also effectively stable at 72 (73 end December). As would be expected, market moves were substantially negative, knocking $4.5bn off the total while currency movements deducted a further $1.7bn. Record indicates that there has been no change in its dividend policy (cover of at least 1x) and that it expects to maintain payment of its ordinary dividend (full year 2.30p, implying a yield of 3.5% for the final payment alone).
Volatility poses challenges but may also help
Heightened volatility, reduced liquidity in foreign exchange markets and a move to remote working have presented challenges for currency managers but Record has continued to execute its mandates on behalf of clients without disruption, demonstrating the resilience of its operations. Client engagement during recent weeks has been strong and the market background seems likely to encourage clients and potential clients to maintain or add to risk-management mandates.
Valuation
Our EPS estimates for FY20 and FY21 are reduced by 3% and 24% respectively, primarily because of lower AUME following market moves. Nevertheless, the shares trade on a calendar year 2020 P/E below the peer average (or broadly in line for FY21). As before, our FY21 estimate does not assume any performance fees.
Changes in AUME and other points from update
Exhibit 1 shows further detail on the AUME levels and client net flows highlighted above. The first three columns showing AUME by strategy underline the impact of the market downturn in the quarter to end March. The flow analysis shows that there were overall net inflows in each quarter of the financial year with an overall total of $4.6bn for the year, suggesting the group’s continuous focus on innovation and improving service levels is having a beneficial effect. Even after negative market, foreign exchange and mandate scaling moves there was still a positive net movement for the year of $1.3bn.
Exhibit 1: AUME changes
Year-end March ($bn) |
Q419 |
Q320 |
Q420 |
Q120 |
Q220 |
Q320 |
Q420 |
FY19 |
FY20 |
||
AUME |
Net flows |
||||||||||
Dynamic hedging |
3.1 |
3.5 |
2.5 |
0.3 |
(0.1) |
0.1 |
(0.1) |
(0.7) |
0.2 |
||
Passive hedging |
48.2 |
53.4 |
50.3 |
0.1 |
1.5 |
1.4 |
1.1 |
(4.6) |
4.1 |
||
Currency for return |
2.7 |
3.3 |
2.6 |
(0.1) |
0.3 |
0.0 |
0.1 |
0.9 |
0.3 |
||
Multi-product |
3.0 |
4.2 |
3.0 |
0.0 |
0.0 |
1.0 |
(1.0) |
0.0 |
0.0 |
||
Cash and futures |
0.3 |
0.3 |
0.2 |
0.0 |
0.0 |
0.0 |
0.0 |
(0.1) |
0.0 |
||
Total |
57.3 |
64.7 |
58.6 |
0.3 |
1.7 |
2.5 |
0.1 |
(4.5) |
4.6 |
||
Markets |
0.0 |
1.3 |
0.0 |
(4.5) |
2.3 |
(3.2) |
|||||
FX and scaling for mandate volatility targeting |
0.7 |
(1.4) |
2.3 |
(1.7) |
(2.7) |
(0.1) |
|||||
Total change |
1.0 |
1.6 |
4.8 |
(6.1) |
(4.9) |
1.3 |
|||||
Source: Record
The Q420 investment performance of the return seeking strategies was mixed with the FTSE FRB10 Index (sterling excess return) down 3.98%. The Record Emerging Market product was particularly weak in a risk-off period, down 8.76%, although the annualised since-inception (November 2009) return for an ungeared portfolio was +1.19% pa. The Multi-Strategy product (with 4% target volatility) had a negative quarter (-5. 64%) but has also generated a positive since-inception (July 2012) return of +0.60% per year. Encouragingly, the Dynamic Macro Currency strategy produced a strong performance (+6.84%) reinforcing its record of achieving outperformance in periods of heightened risk aversion, periods that have been more challenging for the more systematic approaches. This strategy is managed by John Floyd whose hiring was announced at the interim stage. He is a seasoned FX professional who has managed a dynamic macro strategy for 15 years. This strategy is more discretionary than Record’s existing, primarily quantitatively driven strategies and is therefore complementary.
|
Exhibit 2: US trade-weighted real broad dollar index |
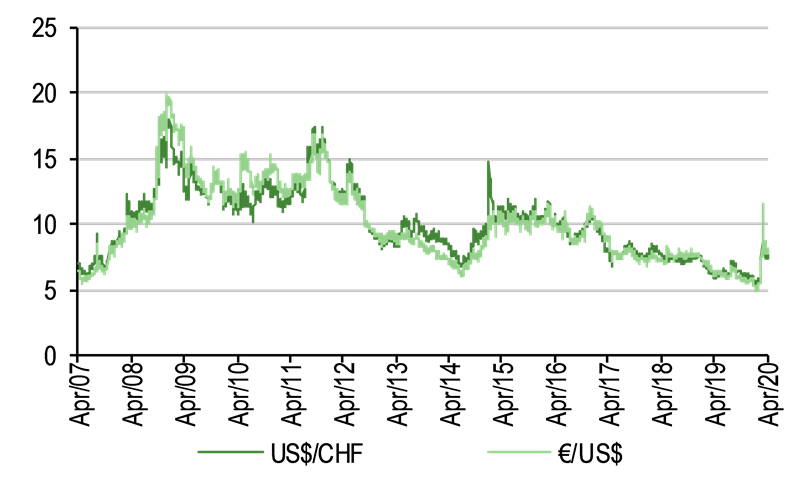
Exhibit 3: Implied volatility – Swiss franc, euro versus US dollar |
|
|
|
Source: Bloomberg |
Source: Bloomberg. Note: For one year at the money options. |
|
Exhibit 2: US trade-weighted real broad dollar index |
|
|
Source: Bloomberg |
|
Exhibit 3: Implied volatility – Swiss franc, euro versus US dollar |
|
|
Source: Bloomberg. Note: For one year at the money options. |
In a period of high volatility Record successfully moved to full remote working without disruption to client service, maintained staff wages and has not made use of the government job retention scheme. It has continued to navigate currency markets on behalf of clients with both increased trading volumes and restricted liquidity. The market conditions have generated greater client interaction and are likely to have encouraged some hedging clients to maintain or increase mandates while providing a more favourable background for future discussions with potential clients. Exhibit 2 shows the strength of the US dollar both on a medium-term view and in recent weeks; US hedging clients have benefited from the risk protection their mandates provide. Similarly, the sharp spike in volatility (Exhibit 3) will have acted as a reminder of the benefits of managing currency risk for investors in Europe.
As in previous quarters Record reports that management fees have been broadly stable (the group average in H120 was 4.8bps) but competitive pressure in hedging services remains a feature and Record continues to counter this through service levels and the introduction of service enhancements.
No performance fees were crystallised in the quarter but during Q320 £1.8m was crystallised (equivalent to c 0.4bps of the prior 12-month average AUME versus average passive hedging management fees of c 3bps).
Chief Executive Leslie Hill, who succeeded to the role in February and is a longstanding Record employee (joining in 1992 and previously deputy CEO and head of the client team), is aiming to re-energise the group’s growth strategy. Here one of the themes is to diversify revenue streams by responding to areas where clients are seeking help to implement strategies; this includes incorporating currency management into ESG and impact investing and including frontier currencies (despite the liquidity challenges involved). In addition, Record looks to promote the Dynamic Macro Strategy, where the recent performance should prove helpful.
Estimate changes
Changes in key figures from our estimates are shown in Exhibit 4. The changes for FY20 are relatively small and reflect changes in the sterling/US dollar (positive) and AUME level (negative) in Q420. The same factors apply for the whole of FY21 and we have assumed a somewhat higher level of staff cost to allow for modest further recruitment.
It should be noted that we do not allow for performance fees in our estimates until they have been crystallised so there are none included for FY21 compared with the £1.8m for FY20. On a longer view both performance fees and tactical mandates are likely to make a contribution to Record’s results but, given their episodic nature, it is difficult to set a reasonable level to allow within estimates.
Exhibit 4: Estimate changes
|
Revenue (£m) |
PBT (£m) |
EPS (p) |
DPS (p)* |
||||||||
|
Old |
New |
Change |
Old |
New |
Change |
Old |
New |
Change |
Old |
New |
Change |
03/20e |
25.5 |
25.1 |
-2% |
8.0 |
7.8 |
-4% |
3.28 |
3.17 |
-3% |
2.30 |
2.30 |
0% |
03/21e |
24.0 |
22.2 |
-8% |
6.8 |
5.2 |
-24% |
2.81 |
2.14 |
-24% |
2.30 |
2.30 |
0% |
Source: Edison Investment Research. Note: *Dividend excludes any special payment.
Our dividend estimates shown above exclude special dividends and, based on our earnings estimates, we pencil in a special payment of 0.65p for FY20 (unchanged). For FY21 our new estimate would not provide scope for a special payment but would be close to covering the ordinary dividend, so we leave this unchanged at this stage, particularly given the potential to generate performance fees during the year. For more detail on our estimates, see Exhibit 6.
Valuation
An updated version of our valuation table, which shows Record in the context of a group of UK asset managers, is shown in Exhibit 5. Record is differentiated by its role as a specialist currency manager, but its fees are primarily based on the size of AUME, so, like the asset managers, it is exposed to movements in underlying equity and fixed income markets and flows.
Exhibit 5: Comparing valuation with UK fund managers
Price (p) |
Market cap (£m) |
P/E 2020e (x) |
EV/EBITDA 2020e (x) |
Dividend yield (%) |
|
Ashmore |
357 |
2,547 |
14.2 |
8.8 |
4.7 |
City of London Investment Group |
327 |
87 |
7.5 |
N/A |
8.3 |
Impax Asset Management |
364 |
475 |
29.7 |
22.1 |
1.5 |
Jupiter |
208 |
950 |
10.7 |
5.0 |
8.2 |
Liontrust |
1,000 |
555 |
19.1 |
12.9 |
2.7 |
Man Group |
127 |
2,360 |
9.6 |
8.3 |
7.2 |
Polar Capital |
410 |
396 |
11.7 |
7.0 |
8.0 |
Schroders |
2,575 |
6,976 |
16.4 |
11.5 |
4.4 |
Average |
14.9 |
10.8 |
5.6 |
||
Record |
32 |
65 |
13.5 |
6.0 |
7.1 |
Source: Refinitiv, Edison Investment Research. Note: P/E and EV/EBITDA on a calendar-year basis. Record’s dividend yield excludes the special dividend. Priced at 21 April 2020.
Calendarised figures for P/E and EV/EBITDA (2020) show Record shares trading on multiples below the peer averages for both measures. The earnings for calendar year 2020 benefit from a quarter of the performance fee earned in FY20 and, as shown on the front page, the FY21e P/E is just above 15x. The dividend yield of 7.1% is at a premium to the peer average and there is the potential for this to be enhanced with a special dividend (on our estimate 0.65p for FY20).
Exhibit 6: Financial summary
Year end March (£’000s unless stated) |
|
|
2017 |
2018 |
2019 |
2020e |
2021e |
|
|
IFRS |
IFRS |
IFRS |
IFRS |
IFRS |
|
PROFIT & LOSS |
|
|
|
|
|
|
|
Revenue |
|
|
22,952 |
23,834 |
24,973 |
25,116 |
22,181 |
Operating expenses |
|
|
(15,365) |
(16,735) |
(17,089) |
(17,575) |
(17,189) |
Other income/(expense) |
|
|
157 |
173 |
(8) |
50 |
0 |
Operating Profit (before amort. and except.) |
|
|
7,744 |
7,272 |
7,876 |
7,591 |
4,991 |
Finance income |
|
|
112 |
56 |
113 |
167 |
175 |
Profit Before Tax |
|
|
7,856 |
7,328 |
7,989 |
7,758 |
5,166 |
Taxation |
(1,540) |
(1,182) |
(1,559) |
(1,552) |
(982) |
||
Minority interests |
|
|
0 |
0 |
0 |
55 |
40 |
Attributable profit |
|
|
6,316 |
6,146 |
6,430 |
6,262 |
4,225 |
|
|
|
|
|
|
|
|
Revenue/AuME (excl. perf fees) bps |
|
|
5.2 |
5.1 |
4.9 |
5.0 |
4.6 |
Operating margin (%) |
|
|
33.7 |
30.5 |
31.5 |
30.2 |
22.5 |
|
|
|
|
|
|
|
|
Average diluted number of shares outstanding (m) |
|
|
218.0 |
206.5 |
198.1 |
197.5 |
197.5 |
Basic EPS (p) |
|
|
2.91 |
3.03 |
3.27 |
3.19 |
2.15 |
EPS - diluted (p) |
|
|
2.90 |
2.98 |
3.25 |
3.17 |
2.14 |
Dividend per share (p) |
|
|
2.00 |
2.30 |
2.30 |
2.30 |
2.30 |
Special dividend per share (p) |
|
|
0.91 |
0.50 |
0.69 |
0.65 |
0.00 |
Total dividend (p) |
|
|
2.91 |
2.80 |
2.99 |
2.95 |
2.30 |
|
|
|
|
|
|
|
|
BALANCE SHEET |
|
|
|
|
|
|
|
Non-current assets |
|
|
1,228 |
2,339 |
2,161 |
3,425 |
2,806 |
Intangible Assets |
|
|
245 |
228 |
288 |
378 |
418 |
Tangible Assets |
|
|
881 |
910 |
761 |
776 |
681 |
Investments |
|
|
0 |
1,115 |
1,112 |
1,152 |
1,152 |
Other |
|
|
102 |
86 |
0 |
1,119 |
555 |
Current Assets |
|
|
44,247 |
29,737 |
31,427 |
32,231 |
29,999 |
Debtors |
|
|
6,972 |
6,775 |
7,562 |
8,054 |
6,530 |
Cash |
|
|
19,120 |
12,498 |
12,966 |
10,185 |
9,477 |
Money market instruments |
|
|
18,102 |
10,198 |
10,735 |
13,860 |
13,860 |
Other |
|
|
53 |
266 |
164 |
132 |
132 |
Current liabilities |
|
|
(8,644) |
(5,525) |
(6,158) |
(6,554) |
(5,954) |
Creditors |
|
|
(3,013) |
(2,630) |
(2,736) |
(3,171) |
(2,571) |
Financial liabilities |
|
|
(4,779) |
(2,467) |
(2,621) |
(2,721) |
(2,721) |
Other |
|
|
(852) |
(428) |
(801) |
(662) |
(662) |
Non-current liabilities |
|
|
0 |
0 |
(29) |
(1,170) |
(606) |
|
|
|
|
|
|
|
|
Net Assets |
|
|
36,831 |
26,551 |
27,401 |
27,933 |
26,245 |
Minority interests |
|
|
0 |
0 |
60 |
125 |
85 |
Net assets attributable to ordinary shareholders |
|
36,831 |
26,551 |
27,341 |
27,808 |
26,160 |
|
|
|
|
|
|
|
|
|
No of shares at year end |
|
|
221.4 |
199.1 |
199.1 |
199.1 |
199.1 |
NAV per share p |
|
|
16.6 |
13.3 |
13.7 |
14.0 |
13.1 |
|
|
|
|
|
|
|
|
CASH FLOW |
|
|
|
|
|
|
|
Operating Cash Flow |
|
|
7,107 |
2,746 |
7,026 |
6,866 |
5,843 |
Capex |
|
|
(899) |
(236) |
(72) |
(250) |
(140) |
Cash flow from other investing activities |
|
|
(5,159) |
7,899 |
(561) |
(3,148) |
25 |
Dividends |
|
|
(3,592) |
(6,810) |
(5,517) |
(5,908) |
(5,872) |
Other financing activities |
|
|
(193) |
(10,367) |
(613) |
(461) |
(564) |
Other |
|
|
136 |
146 |
205 |
120 |
0 |
Net Cash Flow |
|
|
(2,600) |
(6,622) |
468 |
(2,781) |
(708) |
Opening cash/(net debt) |
|
|
21,720 |
19,120 |
12,498 |
12,966 |
10,185 |
Other |
|
|
0 |
0 |
0 |
0 |
0 |
Closing net (debt)/cash |
|
|
19,120 |
12,498 |
12,966 |
10,185 |
9,477 |
Closing net debt/(cash) inc money market instruments |
37,222 |
22,696 |
23,701 |
24,045 |
23,337 |
||
|
|
|
|
|
|
|
|
AUME |
|
|
|
|
|
|
|
Opening ($'bn) |
|
|
52.9 |
58.2 |
62.2 |
57.3 |
58.6 |
Net new money flows |
|
|
3.1 |
(1.2) |
(4.5) |
4.6 |
0.0 |
Market/other |
|
|
2.2 |
5.2 |
(0.4) |
(3.3) |
0.6 |
Closing ($'bn) |
|
|
58.2 |
62.2 |
57.3 |
58.6 |
59.2 |
Source: Record accounts, Edison Investment Research
|
|
Research: Healthcare
Shield Therapeutics (STX) has announced that founder Carl Sterritt has resigned from his role as CEO with mutual agreement from its main shareholders. Tim Watts has been appointed as CEO from his position of CFO (since August 2018). While the timing does come as a surprise, we do not expect any disruptions to the business strategy; successfully commercialising Feraccru through partners is key to STX realising its value. Importantly, the company reported an end-FY19 cash position of £4.1m and the post-period end upfront payment of $11.4m from ASK Pharm received in January 2020 extends the cash runway into 2021. Our valuation of STX is unchanged at £344.7m or 294p/share.