Last close As at 05/08/2026
GBP0.03
— 0.00 (0.00%)
Market capitalisation
GBP5m
Research: TMT
Nanoco has announced that it has terminated the formal sale process of the company. It has taken actions to extend the cash runway from July this year to calendar Q2 2021. This is valuable as it creates time to progress active commercial opportunities delivering nano-materials for sensing and display applications, to pursue the IP infringement lawsuit against Samsung and secure medium-term funding. Given the uncertainty regarding future revenues we are not reinstating estimates even though the Takeover Panel restrictions are no longer in force.
Written by
Nanoco Group |
Extending cash runway to evaluate options |
Interim results |
Tech hardware & equipment |
4 May 2020 |
Share price performance
Business description
Next events
Analysts
Nanoco Group is a research client of Edison Investment Research Limited |
|||||||||||||||||||||||||||||||||||||||||||||||
Nanoco has announced that it has terminated the formal sale process of the company. It has taken actions to extend the cash runway from July this year to calendar Q2 2021. This is valuable as it creates time to progress active commercial opportunities delivering nano-materials for sensing and display applications, to pursue the IP infringement lawsuit against Samsung and secure medium-term funding. Given the uncertainty regarding future revenues we are not reinstating estimates even though the Takeover Panel restrictions are no longer in force.
Year end |
Revenue (£m) |
EBITDA |
PBT* |
EPS* |
DPS |
P/E |
07/18 |
3.3 |
(6.2) |
(7.1) |
(2.6) |
0.0 |
N/A |
07/19 |
7.1 |
(3.8) |
(5.0) |
(1.8) |
0.0 |
N/A |
07/20e |
N/A |
N/A |
N/A |
N/A |
N/A |
N/A |
Note: *PBT and EPS are normalised, excluding amortisation of acquired intangibles, exceptional items and share-based payments.
Successful completion of major contract in H120
During H1 of FY20, Nanoco successfully delivered the final milestones for the US customer, earning the contracted milestone payments in full. Revenues decreased from £3.2m in H1 of FY19 to £2.9m, reflecting lower revenues from the US customer (£2.5m vs £2.9m) as the contract ended in December. Adjusted EBITDA losses narrowed from £2.5m to £1.1m, demonstrating the beneficial impact of the restructuring programme in Q4 of FY19, which has reduced employee and admin costs. Net cash (excluding the £0.4m convertible loan) fell by £2.8m during the period to £4.2m at end January 2020.
Pursuing near-term opportunities in sensing
There is continued interest in Nanoco’s nano-materials to improve the sensitivity of silicon-based IR (infra-red) sensors. These sensors potentially provide a cost-effective upgrade to the range and sensitivity of sensors currently used for facial recognition and augmented reality (AR) applications in mobile phones and for collision avoidance systems in autonomous vehicles. In April Nanoco started work on two new development programmes with a large participant in the semi-conductor sensing supply chain. These development activities could potentially lead to volume production of materials using the existing facilities in Runcorn. This development activity is not impaired by the cash conservation measures, which have cut cash consumption to c £0.4m/month.
Valuation: Resolution of patent infringement key
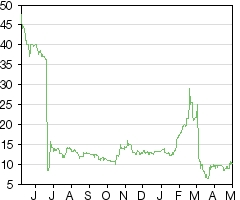
The share price has halved from the 25p noted in March before the announcement noting that no firm offers had been received under the formal sale process. There remains potential for generating revenues from the supply of quantum dots (QDs) for sensing applications. However, we believe that at this point Nanoco’s value lies primarily in its portfolio of c 770 patents and its ability to monetise these through a satisfactory resolution of the patent infringement dispute with Samsung.
H120 performance
Successful completion of major contract in H120
During H1 of FY20 Nanoco successfully delivered the final milestones for the US customer, earning the contracted milestone payments in full. Revenues decreased by £0.3m year-on-year to £2.9m, reflecting lower revenues from the US customer (£2.5m vs £2.9m) as the contract ended in December. Adjusted EBITDA losses narrowed from £2.5m to £1.1m, benefiting from the restructuring programme in Q4 of FY19, which reduced employee and admin costs, and the absence of the costs associated with the initial commissioning of the Runcorn facility, a substantial part of which fell in H1 of FY19.
Net cash (excluding £0.4m convertible loan) fell by £2.8m during the period to £4.2m at end January 2020. Investment in tangible assets was minimal (£74k vs £1,742k in H1 of FY19) as the new nano-materials production facility in Runcorn was completed during FY19. However, cash consumption was exaggerated by a £1.4m decrease in deferred revenue relating to the contract with the major US customer.
Outlook
Pursuing near-term opportunities in sensing
Although the major US customer decided not to progress to volume production of nano-materials for use in IR sensors, the successful commissioning of the nano-materials production facility in Runcorn clearly demonstrates that Nanoco is able to deliver this material in commercial volumes. There is continued interest in using these nano-materials to improve the sensitivity of silicon-based IR sensors. Nano-material enhanced silicon sensors potentially provide a cost-effective route for improving the range and sensitivity of sensors currently used for facial recognition and augmented reality applications in mobile phones and for collision avoidance systems in autonomous vehicles. Since the exclusive agreement with the US customer has expired, in April Nanoco started work on two new development programmes with a large participant in the semi-conductor sensing supply chain. One of these programmes is focused on the current generation of infra-red sensing nano-materials encompassing potential customers and applications beyond the major US customer. The other programme is for a new generation of nano-materials, also in the sensing markets, but for a different potential application. These two programmes will be covered by a joint development agreement (JDA), which is currently under negotiation.
In addition, Nanoco’s next-generation cadmium-free quantum dots for OLED-QD (organic LED-quantum dot) hybrid TV display systems are currently being tested by OEMs in South Korea and China. These development activities could potentially lead to volume production of materials using the existing facilities in Runcorn.
This development activity is not impaired by either the social distancing measures introduced during the COVID-19 pandemic or the cash conservation measures (see below). The R&D facility in Manchester continues to operate though the volume production facility in Runcorn has been temporarily closed.
Patent infringement lawsuit against Samsung
In February Nanoco announced that it had filed a patent infringement lawsuit against Samsung. The lawsuit alleges that Samsung has wilfully infringed the patents relating to Nanoco’s unique synthesis and resin capabilities for quantum dots. Nanoco is seeking a permanent injunction from further acts of infringement and unspecified but significant monetary damages. The announcement described how Nanoco and Samsung initially worked collaboratively developing cadmium-free quantum dots based on Nanoco’s IP. However, Samsung ended the collaboration and launched its quantum dot-based televisions without entering into a supply or licensing agreement with Nanoco. The company has engaged US-based international IP law firm Mintz, Levin, Cohn, Ferris, Glovsky and Popeo to represent it in patent enforcement and litigation. Nanoco is currently discussing a litigation funding agreement with a potential partner, which would lead to the third party funding the cost of the lawsuit in return for a share of any damages or settlement agreement. This means that Nanoco would be able to actively progress the lawsuit without adversely affecting its cash consumption. Management estimates that the lawsuit could proceed to trial in calendar Q421 or Q122.
Nanoco has not revealed its estimates of the potential pay-out if the litigation is successful but states that since April 2015 Samsung has sold 14 million TVs deploying quantum dots based on Nanoco IP. These TVs had an average sales price of US$2,200–2,500 compared with the average price of a top of the range TV without QDs of c US$1,000. The value of the lost revenue to Nanoco this represents has not been disclosed. Had the alleged patent infringement not taken place, we believe Nanoco would have collected royalties from its partners, primarily Dow Chemical, which would potentially be supplying QDs to Samsung in volumes higher than Nanoco could produce itself in Runcorn. If we assume that the cost of the QDs in each TV is equivalent to 10% of the uplift in price between QD and non-QD TV displays, and that Nanoco would have received a 12% royalty (as per our May 2017 note) on these QDs, this represents US$14.4–18.0 lost revenue per TV display or US$200–250m. This value excludes QDs in any future TV displays Samsung makes.
Cash conservation
Management had already taken action to reduce cash consumption from £0.8m/month in October 2019 to £0.6/month by March 2020 because of concerns about delays to the formal sale process. In April it began to furlough some staff under the UK government’s employment support scheme and implementing a company-wide reduction in salaries for non-furloughed staff with a gross salary above £25k/annum. These actions have reduced monthly cash consumption to c £0.4m. Assuming that the JDA for developing sensing materials goes ahead, these actions will give Nanoco enough cash to continue its existing business activities, potentially with a small-scale restructuring in calendar H220, until calendar Q221. If the JDA does not go ahead, or if none of the other short-term opportunities are realised,and failing an alternative source of medium-term funding, management has the option to remove the group’s R&D, production and scale-up capabilities to focus on pursuing the lawsuit against Samsung. The cash runway extends into calendar Q221 in this scenario as well. Management is seeking medium-term funding to increase its options.
Potential FY20 performance
As the JDA covering the development of nano-materials for sensing applications is still being negotiated, there is substantial uncertainty regarding FY21 business activity and revenue levels. Consequently, we are not reinstating estimates even though the Takeover Panel restrictions are no longer in force. Since the contract with the major US customer ended in December 2019, it is likely that H220 revenues will be similar to the revenues from customers other than the major US customers during H120, ie £0.4m, giving a total of £3.3m for FY20 as a whole. Noting the reduction in cash consumption per month discussed above, we calculate that total operating costs excluding depreciation and amortisation during H220 would be c £3.2m, giving EBITDA losses of £3.9m for the year as a whole.
Valuation: Resolution of patent infringement key
While there remains potential for generating revenues from the supply of QDs for sensing applications, we believe that at this point Nanoco’s value lies primarily in its portfolio of c 770 patents and its ability to monetise these through a satisfactory resolution of the patent infringement dispute with Samsung. We have calculated the potential value of lost revenue earlier in the note. As an additional reference point for the potential value of the IP, which includes c 770 granted and pending patents, we note that Samsung acquired the IP of quantum dot competitor QD Vision (with a reported 250 patents) for $70m in 2016.
Exhibit 1: Financial summary
£m |
2017 |
2018 |
2019 |
||||
Year end 31 July |
IFRS |
IFRS |
IFRS |
||||
INCOME STATEMENT |
|||||||
Revenue |
|
|
1.3 |
3.3 |
7.1 |
||
Cost of Sales |
(0.3) |
(0.4) |
(0.7) |
||||
Gross Profit |
1.1 |
2.9 |
6.5 |
||||
EBITDA |
|
|
(9.4) |
(6.2) |
(3.8) |
||
Operating profit (before amort. and except). |
|
(10.7) |
(7.2) |
(5.0) |
|||
Amortisation of acquired intangibles |
0.0 |
0.0 |
0.0 |
||||
Exceptionals |
(0.0) |
0.0 |
(0.3) |
||||
Share-based payments |
(0.2) |
(0.3) |
(0.2) |
||||
Reported operating profit |
(10.9) |
(7.4) |
(5.5) |
||||
Net Interest |
0.0 |
0.0 |
(0.0) |
||||
Joint ventures & associates (post tax) |
0.0 |
0.0 |
0.0 |
||||
Exceptionals |
0.0 |
0.0 |
0.0 |
||||
Profit Before Tax (norm) |
|
|
(10.6) |
(7.1) |
(5.0) |
||
Profit Before Tax (reported) |
|
|
(10.9) |
(7.4) |
(5.5) |
||
Reported tax |
1.8 |
1.4 |
1.2 |
||||
Profit After Tax (norm) |
(10.6) |
(7.1) |
(5.0) |
||||
Profit After Tax (reported) |
(9.1) |
(6.0) |
(4.4) |
||||
Minority interests |
0.0 |
0.0 |
0.0 |
||||
Discontinued operations |
0.0 |
0.0 |
0.0 |
||||
Net income (normalised) |
(10.6) |
(7.1) |
(5.0) |
||||
Net income (reported) |
(9.1) |
(6.0) |
(4.4) |
||||
Average Number of Shares Outstanding (m) |
238 |
272 |
286 |
||||
EPS - normalised (p) |
|
|
(4.46) |
(2.63) |
(1.75) |
||
EPS - diluted normalised (p) |
|
|
(4.46) |
(2.63) |
(1.75) |
||
EPS - basic reported (p) |
|
|
(3.83) |
(2.21) |
(1.52) |
||
Dividend per share (p) |
0.00 |
0.00 |
0.00 |
||||
Revenue growth (%) |
179.7 |
150.0 |
114.9 |
||||
Gross Margin (%) |
80.6 |
87.0 |
90.7 |
||||
EBITDA Margin (%) |
(711.2) |
(186.2) |
(53.3) |
||||
Normalised Operating Margin |
(803.5) |
(215.8) |
(70.0) |
||||
BALANCE SHEET |
|||||||
Fixed Assets |
|
|
3.5 |
6.0 |
4.6 |
||
Intangible Assets |
2.6 |
3.4 |
3.9 |
||||
Tangible Assets |
0.9 |
2.6 |
0.7 |
||||
Investments & other |
0.0 |
0.0 |
0.0 |
||||
Current Assets |
|
|
8.9 |
13.8 |
9.5 |
||
Stocks |
0.2 |
0.2 |
0.2 |
||||
Debtors |
0.7 |
1.4 |
1.1 |
||||
Cash & cash equivalents |
5.7 |
10.7 |
7.0 |
||||
Other |
2.4 |
1.4 |
1.1 |
||||
Current Liabilities |
|
|
(1.4) |
(3.4) |
(4.8) |
||
Creditors |
(1.3) |
(3.0) |
(2.3) |
||||
Tax and social security |
0.0 |
0.0 |
0.0 |
||||
Short term borrowings |
0.0 |
0.0 |
0.0 |
||||
Other |
(0.1) |
(0.4) |
(2.5) |
||||
Long Term Liabilities |
|
|
(0.6) |
(3.7) |
(0.8) |
||
Long term borrowings |
0.0 |
0.0 |
0.0 |
||||
Other long term liabilities |
(0.6) |
(3.7) |
(0.8) |
||||
Net Assets |
|
|
10.5 |
12.6 |
8.5 |
||
Minority interests |
0.0 |
0.0 |
0.0 |
||||
Shareholders' equity |
|
|
10.5 |
12.6 |
8.5 |
||
CASH FLOW |
|||||||
Op Cash Flow before WC and tax |
(9.4) |
(6.2) |
(3.8) |
||||
Working capital |
(0.3) |
4.0 |
1.8 |
||||
Exceptional & other |
(0.0) |
0.0 |
0.0 |
||||
Tax |
1.9 |
1.8 |
1.4 |
||||
Net operating cash flow |
|
|
(7.8) |
(0.3) |
(0.6) |
||
Capex |
(1.6) |
(3.0) |
(3.1) |
||||
Acquisitions/disposals |
0.0 |
0.0 |
0.0 |
||||
Net interest |
0.1 |
0.0 |
(0.0) |
||||
Equity financing |
0.6 |
7.9 |
0.0 |
||||
Dividends |
0.0 |
0.0 |
0.0 |
||||
Other |
0.0 |
0.0 |
0.0 |
||||
Net Cash Flow |
(8.8) |
4.6 |
(3.7) |
||||
Opening net debt/(cash) |
|
|
(14.5) |
(5.7) |
(10.7) |
||
FX |
0.0 |
0.0 |
0.0 |
||||
Other non-cash movements |
0.0 |
0.3 |
0.0 |
||||
Closing net debt/(cash) |
|
|
(5.7) |
(10.7) |
(7.0) |
||
Source: Company data
|
|
Research: Energy & Resources
SDX Energy recently reported its FY19 results reflecting a 14% increase in production driven by the start of production at South Disouq in Egypt, and its accelerated ramp-up ahead of expectations. The drilling campaign in Morocco resulted in seven discoveries and a tenth well is to be tested. The company ended the year with a cash balance of $11.1m and is fully funded for all 2020 activities from existing cash flows. In this note we update our valuation to reflect, among other things, FY19 results and the uncertainty caused by COVID-19. Our mid-case RENAV valuation has decreased to 40.7p/share from 53.9p/share (-24%) as we adjust our short- and long-term oil price assumptions, revise our forecasts to reflect the 2P reserve base update and remove Salah and Young prospects from our valuation.