Last close As at 05/08/2026
—
— 0.00 (0.00%)
Market capitalisation
—
YouGov |
Smart, connected data |
Full-year results |
Media |
21 October 2016 |
Share price performance
Business description
Next events
Analysts
YouGov is a research client of Edison Investment Research Limited |
|||||||||||||||||||||||||||||||||||||||||||||||
YouGov’s FY16 results show the continuing benefits of its strategy to build on its Data Products and Services, delivering revenue and profit growth well in excess of the market. There was also some benefit from currency movements. The group’s transition from market researcher to global data and analytics business should drive continuing growth well ahead of industry rates, with the roll-out of scalable products and services internationally supporting margin and cash generation. The shares have performed strongly as this strategy has started to reap financial rewards, with the current price well supported.
Year end |
Revenue (£m) |
PBT* |
EPS* |
DPS |
P/E |
Yield |
07/15 |
76.1 |
9.1 |
6.7 |
1.0 |
34.7 |
0.4 |
07/16 |
88.2 |
13.3 |
8.5 |
1.4 |
27.4 |
0.6 |
07/17e |
101.0 |
14.0 |
9.8 |
1.6 |
23.7 |
0.7 |
07/18e |
111.0 |
16.3 |
11.1 |
1.8 |
20.9 |
0.8 |
Note: *PBT and EPS are normalised, excluding amortisation of acquired intangibles, exceptional items and share-based payments.
Upgraded estimates, further growth for FY18e
FY16 figures were ahead of our estimates, with 16% growth at the top line (12% at constant currency). Data Products and Services continue to build strongly, growing revenues by 32%, with the operational gearing from the increasing proportion of productised offer driving an improvement in group operating margin from 11.3% to 12.4%. Foreign exchange conversion gains boosted net finance income, offset at the EPS level by a higher tax charge due to the strong growth in US earnings. Our FY17 forecasts move ahead by 14% at the EBITDA level; +17% in EPS. Our new FY18 estimates show further strong progress as BrandIndex, Profiles and Omnibus build their global client base. The group typically has 100%+ cash conversion, with the FY16 figure of 130% leading to an increase in year-end net cash to £15.6m and allowing for a 40% step up in the recommended dividend to 1.4p.
Global offer designed for client needs
YouGov now has offices in 21 countries and is increasingly working with its clients across multiple territories. It is harnessing the data drawn from its five million panellists in a very different way from traditional market research (MR) methodologies, by collecting a wide range of data points and connecting it together in its multivariate database (known as the "Cube"). This will increasingly enable it to answer many of its clients' data requests from its existing database without needing to conduct additional bespoke surveys.
Valuation: Reflecting superior growth
The share price has near-doubled in a little over 12 months as the market has seen that the group’s clear and consistent strategy is translating into profits and, at least as importantly, into cash. With much of the traditional MR sector still struggling with legacy infrastructures, it is unsurprising that YouGov’s rating is towards the top of the ranking of global peers, reflecting its much higher CAGR in earnings and progressive dividend stream.
Investment summary
Company description: Global data and analytics
YouGov is an innovative online market researcher offering data-led products and services, syndicated research and custom research. It has transitioned from a geographically siloed business into one organised globally by product, leveraging the strength of its own group and product brands. While it still carries out the political polling for which it was originally best known in the UK, its principal activity is the provision of information about customers and markets to brand owners and media agencies. It is a technology-enabled business that is constantly innovating and exploiting the monetisation potential of the vast quantities of data derived from its panel, tailored toward the needs of its corporate client base. There are five strands to the future growth strategy: growing the suite of syndicated products; integrating the custom research with the syndicated data; enhancing the user experience; boosting the public profile; and expanding the geographic footprint.
Valuation: Reflecting superior growth
The share price has risen 74% from 134p in mid-October 2015 as the success of the Data Products and Services-led strategy has been translating into levels of growth well ahead of the market and other providers. In terms of EV/EBITDA, the group is towards the top of the range of other global groups within the broader MR space, both domestic and international. This is justified by the CAGR in EPS, which, on an annualised 20% to end calendar 2016, is well ahead of sector average. Industry body, ESOMAR, cites market growth at 4%. Our average of the quoted sector gives 8.1%, although this is much inflated by the newly merged Quintiles/IMS. Excluding Quintiles/IMS, the figure is 0.6%.
Financials: Top-line growth driving earnings, cash
■
The full year results came in ahead of Edison numbers (the pre-close trading update indicated figures slightly ahead of the Board’s earlier expectations)
■
FY17e estimates revised upwards; new FY18e forecasts show continuing strong growth
■
Investment requirements in technology and panel easily covered by cash generated (conversion of 130% in FY16)
■
Year-end net cash balance of £15.6m, with no debt
■
Progressive dividend
Sensitivities: Economic and commercial
MR budgets tend to reflect overall marketing budgets, themselves dependent on economic conditions and GDP dynamics, albeit in a less geared manner. Demonstrable and commercial value add is crucial both to gain share of the pie from existing clients and to win new ones. The competitive landscape includes the large syndicated data specialists (eg Nielsen) and other data analytics companies (eg DunnHumby, Comscore), which are included in the MR market statistics and are growing quite well, but also the large traditional mainly custom research players such as Kantar, Ipsos and GfK, which have much lower growth. There are also smaller, more innovative suppliers and firms of consultants. With increasingly global revenues, currency exposure is a given, but for YouGov, this is largely a translation (rather than a transactional) risk, due to the high proportion (c 70% plus) of its revenues that are generated in non-UK markets. Future growth is more likely to be organic than acquisitional as Data Products and Services are rolled out across territories, although the strong balance sheet would allow for suitable opportunities to be taken, particularly if they add a technology advantage.
Company description: Data and analytics
Single source, connected data
YouGov is an international, full-service online market research agency that has grown through a combination of organic development and acquisition, with recent growth predominantly organic. It has grown to become one of the largest market research networks, with 31 offices in 21 countries and a panel of around five million respondents worldwide. These individual panellists generate data roughly equally from surveys and from information volunteered: likes, dislikes, habits and behaviours, either directly or via their interactions on social media. This data set is at the heart of YouGov’s offer, and is all attributable to identifiable individuals (although obviously aggregated and anonymised). This is the key differentiator, as the data is connected in ways not achievable through conventional survey methodology. Rich data from a sizeable sample of the five million panellists, now covering more than 200k variables, has been compiled into a ‘connected data library’, known as the YouGov Cube. As all data are actively volunteered by panellists who give their explicit permission, data protection and data privacy issues do not pose a business risk.
Started in the UK in 2000, the group has grown well beyond its domestic market and broadened out considerably from its initial best-known polling activities. The largest proportion of revenue is now generated in the US, the world’s largest market for MR (see Exhibit 1 below for full geographic breakdown). From inception, YouGov had an online-driven business model and an innovative culture that looks to exploit the value and actionable information inherent in the data it collects and supplies to clients. This has been recognised by the group’s inclusion in the respected GreenBook (GRIT) Report, in which clients rank and rate suppliers for their innovation. This is itself a reflection of YouGov’s development of a series of products and services that have helped to build its client base and its penetration of major corporate accounts.
YouGov has over 2,000 clients across a wide variety of verticals, including FMCG, financials, technology and marketing services. It has developed a set of tools and services aimed at these brand owners and marketing agencies that help inform their planning and implementation decisions through the data gleaned from its panellists around the globe. The five-year corporate plan centres on growing the suite of syndicated products and integrating custom research and syndicated data. These products and services are then being rolled out geographically. YouGov reports its financial results in three components: Data Products (centred on BrandIndex), Data Services (centred on Omnibus) and Custom Research. It also discloses segmental profits by geography, clearly showing the growing importance of the US operations in driving the financial performance.
|
Exhibit 1: FY16 revenue by destination |
Exhibit 2: FY16 operating profit by origin |
|
|
|
Source: Company accounts |
|
Exhibit 1: FY16 revenue by destination |
|
|
Source: Company accounts |
|
Exhibit 2: FY16 operating profit by origin |
|
|
Source: Company accounts |
Growing Data Products and Services
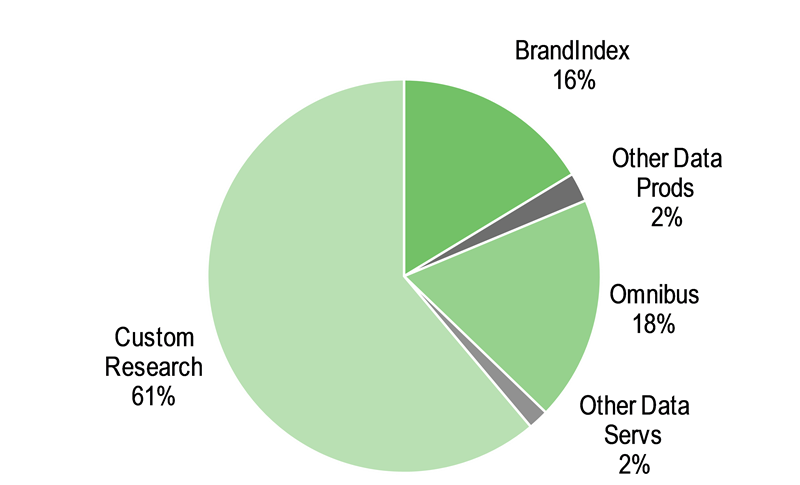
While the custom research (CR) business still accounts for the bulk of revenues (FY16: 61%), this is reducing as a proportion (FY15: 68%) and less and less of this is entry-level business that could be handled by any general researcher. The more attractive opportunities are those that will help build embedded client relationships through realising the value of panel-generated data, improving the quality of the group’s earnings. The more rapid growth of this data products and services (DP&S) segment (in particular in BrandIndex in Data Products and Omnibus in Data Services, with the addition of YouGov Profiles) should drive the mix to revenue parity over time. DP&S already generates 59% of adjusted operating profits, up from 52% in the prior year. With the increasing incorporation of its own gathered rich data, YouGov now sees itself as a ‘true internet company’, with its activities designed to take full advantage of the strengths of a web-based model.
|
Exhibit 3: FY16 Revenue by activity |
Exhibit 4: FY16 operating profit by activity |
|
|
|
Source: Company accounts |
|
Exhibit 3: FY16 Revenue by activity |
|
|
Source: Company accounts |
|
Exhibit 4: FY16 operating profit by activity |
|
|
Source: Company accounts |
Custom research still represents the majority of revenues, but has now been overtaken by the operating profits generated from the Data Products and Services. However, the nature of the custom research revenues has also been shifting from the generally ad-hoc studies, building out the multi-client or syndicated studies and/or full research programmes. The latter are particularly attractive for tracking studies and research under multi-year contracts in an industry dominated by relatively small and one-off contracts. The sales effort is now focused on increasing the share of clients’ spend, for example by increasing the number of geographies covered. YouGov is also working on identifying opportunities for supplementary studies or where the output is based on data already held within the Cube. The use of Crunch, which is a data analytics platform, facilitates the configuration of the output according to client requirements. YouGov can differentiate its offer through incorporating elements of its other activities – adding market positioning/reputational data from BrandIndex or by accessing specialised niche samples derived from data from the existing panel, such as key corporate influencers. These additional elements are also allowing the group to pitch for more substantial pieces of business. Notable larger clients include ITV, Google, HSBC, Ford , Sun Products and Microsoft.
Tracking studies have been building well and accounted for 12% of custom research revenues in FY16 – about £6.5m, with the output again configured specifically according to client needs.
Margins can also be protected in the more competitive market areas by fulfilling medium and smaller projects through the Omnibus product (see below) rather than by bespoke surveys, with an increasing element of automation and with the ability to retarget previous respondents. Growth in the CR segment is therefore likely to be slower and steadier than that from DP&S but, with 9% revenue growth continuing in FY16, growth is running well in excess of the market.
The real engine of growth, though, is the Data Products and Services. Activity in Data Products is dominated by key product BrandIndex, as is shown clearly in Exhibit 4, above. BrandIndex revenues were ahead by 39% year-on-year in FY16 (FY15:+ 30%), with the progress driven by the addition of both clients/brands and new territories, as well as the boost from currency with the US being the largest market. Stripping this effect out, growth was still substantial at 30%. Coverage now extends to 27 countries (from 21 in FY15, 15 in FY14), with Russia, Hong Kong and South Korea among the newly addressed markets. Italy and Spain are the next markets in line.
BrandIndex is targeted at brand curators in corporate clients, media planners and buyers within media agencies. It appraises sentiment towards brands in their peer space, including ‘buzz’, purchase history and likelihood to recommend, all in real time. The product is a syndicated, with YouGov deciding on the sectors and brands to be covered. Some of these brands are global and so are tracked in all markets; some are national and limited to relevant country versions. Subscribers automatically see the data for all the brands covered in the market version that they buy. The additional brand owners included in the analysis who are not (yet) subscribers can then be targeted, with a clear picture already built up of the competitive landscape and their position in it. There has been a large increase in subscribers worldwide, up from 300+ this time last year to 500+, with plenty still to go for in terms of penetration. Being very sensitive to changes in opinion, BrandIndex is also a valuable tool for reputation and crisis management, when reactions can be tracked against events and in comparison to other brands’ reputations post similar events.
Also reported within Data Products are the Reports businesses and YouGov Profiles. This was launched in November 2014 and achieved £1.0m of revenues in FY16, with £3m of annualised sales. Profiles is aimed at the corporate market/brand curators and at agencies, and is effectively the ‘front end’ of the data Cube. A sophisticated planning tool, it allows marketers to profile their target audience in minute detail, far beyond the demographic and location data traditionally available. Profiles’ primary application is in media campaign planning, where it facilitates appropriate targeting by identifying typical characteristics of brand adherents versus the norm. It is being sold on a subscription basis, accessible via an interactive portal and there are now more than 75 subscribers worldwide, including JCDecaux.
Bundling Profiles together with BrandIndex gives a particularly rich resource for agencies and brand owners, and sales of this package have been made to major industry names such as Viacom, Mediacom and Crossmedia. It has been rolled out from the US and the UK to Germany and Asia Pacific, with France and the Nordics next on the list and with others to follow. A Profiles ‘Lite’ is available to the public on the YouGov website and has generated a good deal of publicity, as well as being a good recruiting tool for commercial users. The Reports business, which publishes industry intelligence based on in-house data, is being reconfigured by a recently-appointed global head to make better use of the Cube resource and to address a more international market.
Data Services is also dominated by one offer, Omnibus, which accounts for 92% of segmental revenues, which were up by 30% in FY16. Omnibus is the clear market leader in the UK, where it has been available for a number of years and continues to grow ahead of the overall MR market at +7%. In more recently established markets, growth has been very high, at 52% in the US (+42% in US dollar terms), 30% in the Nordics, 49% in France and 234% in Asia Pacific, albeit off a low base. The operation of Omnibus is highly efficient and it is straightforward to incorporate additional business given the degree of automation. YouGov now has more than 1,000 clients for its Omnibus service globally and continues to add both new clients and new territories (often across multiple territories), with Handelsblatt, Johnson & Johnson, VISA and NBC Universal among those joining the roster in the year just reported.
Again, the group is not sitting back on its success. YouGov has been extending the range of services that it is offering, in particular adding value through segmentation, increasing the degree of automation in the submission of questions into surveys and by giving more flexibility in the way that output is delivered back to the clients.
Clearly articulated strategy
YouGov’s growth strategy is unaltered and is predicated on meeting client needs through the delivery of connected data and, through that, becoming a global data and analytics business. It aims to achieve substantial growth – as demonstrated by the stretch targets incorporated in the new Long Term Incentive Plan (LTIP) described on page 10. There has been a deliberate reduction in the group’s complexity in line with the plan to become bigger but simpler. The five growth strands are:
■
growing the suite of syndicated products. This might include acquisitions to bring in appropriate products or technologies if they can be found at sensible prices and provided they will fit comfortably in the YouGov culture;
■
integrating the CR with the syndicated data, adding value and differentiating the client proposition;
■
enhancing the user experience, broadening out the relationship beyond that of questioner and respondent. The Opigram model to draw out panellists’ views is presented in an almost game-like format, with a strong social element in the sharing of opinions that increases engagement and dwell time on the website, while feeding the data pooled into the Cube. A mobile app is to be rolled out in beta shortly;
■
boosting the public profile, particularly through media partnerships; and
■
continuing to expand the geographic footprint, by acquisition (as has formed the basis of the Asia Pacific expansion) or organically, as has been the case in France.
Experienced management team
Stephan Shakespeare is a co-founder of YouGov and returned to the role of CEO in 2010, after a period as chief innovation officer. Stephan has a clear understanding of the product base and its commercial potential. He refocused corporate strategy back on to exploiting the group’s core research and delivery strengths. Alan Newman was appointed group CFO in August 2008 and has extensive experience in media and communications businesses, both in operational and consultancy capacities. He put in place improved financial controls and has improved the harmonisation of reporting and key business processes. The other executive director is Doug Rivers, chief scientist and responsible for the conception of new products and driving their development. Doug joined the group with the acquisition of Polimetrix, of which he was the founder, in 2006 (the group’s first US purchase). He is a senior fellow at the Hoover Institution and a professor of political science at Stanford University.
YouGov created a new role of COO in August 2014 to drive the implementation of the group’s procedural harmonisation, with the appointment of Sundip Chahal. Sundip had been with the group since 2005, when he joined YouGov’s UK DP&S business, having previously worked for Ipsos and Research International in the UK. He became MD of the division in 2007, responsible for BrandIndex and Omnibus in the UK, and in 2010 was appointed CEO of YouGov’s MENA region, More recently, he oversaw the development of the Asia Pacific business after its acquisition in January 2014.
The management team also comprises two global product heads based in the US, in addition to country/region heads.
Industry gradually ditching PowerPoint culture
The global market research industry continues to go through an extended period of change, prompted by technological advances that are facilitating the production of vast quantities of data. Historically, the industry derived much of its value add from the garnering of this information – hence size was an important indicator that of supplier suitability for the corporate market. Those legacy structures, with their multiple layers of management, are no longer suited to the tasks asked of them, which principally relate to allocation of investment capital to projects, whether new concept/ product/ service development, advertising testing or traditional opinion polling. With the steady march of automation, this highlights that much of the industry remains substantially over-manned and with a balance of skillsets no longer matching market requirements.
The availability of data has led to a proliferation of tools to manipulate it and generate usable value for the client markets and the rise of influential new players. Some of these have come from the technology angle, but traditional MR has also come under attack from the global consultancy and technology sector majors, as well as from in-house teams at client companies.
This shake-up of the status quo has opened up new client opportunities, often (at least in part) falling under the remit of the CTO or CIO, rather than that of the CMO, where the MR budget was an element of the overall marketing budget. With much of the legacy industry project-based, MR spend was often weighted to the final few weeks or months of the client financial year to ensure budgets were not cut back for the following period.
Exhibit 5: Changing market spend patterns
2013 ($bn) |
2014 ($bn) |
2015 ($bn) |
CAGR % |
|
Traditional MR |
38.2 |
38.3 |
39.7 |
1.9% |
‘New' MR |
24.4 |
26.5 |
28.2 |
7.5% |
62.6 |
64.8 |
67.9 |
4.1% |
|
% in traditional |
61% |
59% |
58% |
Source: ESOMAR
Sensitivities
Economic conditions and GDP growth are crucial to spend on MR. For brand owners, MR generally forms part of the overall marketing budget. Public sector research operates in a different set of constraints, with commissioning by media organisations and the third sector subject to other influences. The growth of procurement puts constant pressure on pricing, increasing the attraction of offering more complex and bundled output.
The group’s long-term plan involves continuing investment in products, platforms and people to take full advantage of opportunities that may only be open temporarily. The phasing of that investment against the continuing battle to push the revenue streams ahead is a key determinant of margins.
As an international business, currency management and harnessing diverse cultures and opportunities are perennial sensitivities. The currency exposure is mostly translational, with the US dollar, euro, UAE dirham and the Danish kroner all important.
Product development and enhancement are an integral part of the business development strategy. Not all elements of the product suite may perform according to expectations. Credibility is crucial and so far management has been successful in building this into the brand identity, with the UK General Election in May 2015 an apparent outlier for YouGov and for the whole polling sector. This does not appear to have led to any contagion in the commercial arena.
Competition comes from both large, established players and from younger, innovative firms giving research commissioners new tools to derive richer qualitative data. The need to be faster, more accurate and cheaper is a powerful business driver. Delivering on time, on budget and adding value are the key requirements and will help to ensure client retention in what will continue to be a highly competitive market. YouGov’s ability to allow its clients to revisit previous respondents and to cut existing data across multivariates is a clear differentiator, improved further with the more extensive use if the Crunch tool.
Valuation
The continually accruing and previously collected data panel in the Cube is in itself a valuable asset, albeit in its packaged form rather than its raw state. To replicate this information would be impractical and prohibitively expensive, yet leveraging it is a key element of the current and future revenue streams and profitability of the company. Attributing a realistic financial value to the Cube is not feasible, but the existence of this non-balance sheet item should form part of the thinking around valuation. In the absence of a suitable technique, the fallback is on more traditional metrics of published assets and peer group comparison. The current share price of 230p stands a little over three times the reported net asset value per share of 71p, ie excluding the full value of the data.
Peer group valuation
Although there are large continuous projects, such as monitoring television audiences, much MR is based on relatively low-value, ad-hoc projects, interspersed with larger custom research contracts. Visibility rarely exceeds two to three months and forecasts are based on market views of trading conditions rather than on the value of long-term contracts. This makes developing tracker and longitudinal studies, which give a degree of underpinning, much more attractive as they can then contribute to the underwriting of overheads, and increase the visibility of earnings.
The diversity of the quoted sector means there are no directly comparable UK or international peers, so we continue to include a range of suppliers in the sector, large and small. This range sets a context for the market’s appraisal of YouGov’s business, rather than an absolute measure. The purchase of Rentrak by ComScore in 2015 gave the combined group the scale to take on Nielsen in tracking viewing habits. However, the take-out valuation was lower than many had hoped, at 8.3x historic revenues.
YouGov valuation within range of peers
The strong share price performance has moved YouGov’s market valuation further up the rankings of its global peers. This reflects its trading performance and management’s clear strategy to grow the top line and deliver increasing operating margins. With its above-average earnings growth (and with the management incentivised on an even higher compound rate), there is plenty of justification for this higher rating, with the shares trading at a premium to the sector average.
Exhibit 6: Annualised market research company valuations
|
Price |
Currency |
Mkt cap (m) |
EV/Sales 15 |
EV/EBITDA 12/15 |
EV/EBITDA 12/16 |
EV/EBITDA 12/17 |
Yield |
EPS growth |
Quintiles IMS |
75.34 |
$ |
18521 |
4.6 |
24.4 |
21.5 |
16.3 |
0.0% |
67.6% |
YouGov |
235 |
£ |
245 |
3.0 |
22.4 |
18.5 |
17.0 |
0.4% |
19.6% |
Forrester |
37.96 |
$ |
686 |
1.9 |
18.1 |
14.8 |
12.8 |
1.8% |
11.1% |
ComScore |
29.52 |
$ |
1673 |
4.2 |
16.4 |
13.6 |
10.9 |
0.0% |
0.0% |
Nielsen |
53.53 |
$ |
19129 |
4.2 |
14.1 |
13.3 |
12.4 |
2.0% |
6.6% |
Natl Research Corp |
15.61 |
$ |
453 |
4.1 |
13.6 |
12.0 |
11.0 |
2.4% |
3.3% |
BrainJuicer |
506.9 |
£ |
62 |
2.2 |
11.1 |
9.8 |
8.8 |
0.9% |
11.3% |
Ipsos |
28.87 |
€ |
1309 |
1.0 |
9.1 |
8.9 |
8.6 |
2.8% |
(2.3%) |
Cello |
102 |
£ |
89 |
0.6 |
7.8 |
7.7 |
7.2 |
2.8% |
(15.3%) |
GfK |
30.66 |
€ |
1119 |
0.9 |
6.3 |
6.6 |
6.0 |
2.1% |
(9.6%) |
Average |
|
|
|
2.6 |
13.4 |
12.0 |
10.4 |
1.6% |
8.1% |
Source: Bloomberg, Edison Investment Research. Note: EPS growth is two-year CAGR to 12/2016, undiluted. Priced at 17 October 2016.
Financials
The FY16 results came in comfortably ahead of our earlier expectations, partly through better trading in H2 than we had previously anticipated and partly reflecting the positive impact of sterling weakness. There was a particular boost at the pre-tax level, reflecting the uplift in the net finance line from a cost of £0.2m in FY15 to an increase of £1.2m in FY16, primarily a result in exchange translation gains.
Exhibit 7: Changes to forecasts
EPS |
PBT |
EBITDA |
|||||||
Old |
New |
% chg. |
Old |
New |
% chg. |
Old |
New |
% chg. |
|
2016 |
7.6 |
8.5 |
+12 |
10.7 |
13.3 |
+24 |
10.6 |
11.6 |
+9 |
2017e |
8.4 |
9.8 |
+17 |
12.1 |
14.0 |
+16 |
11.8 |
13.5 |
+14 |
2018e |
- |
11.1 |
N/A |
- |
16.3 |
N/A |
- |
15.7 |
N/A |
Source: Company accounts, Edison Investment Research. Note: 2016 ‘New’ is actual.
Growing recurring revenue streams
YouGov has a lengthening record of growth across all the main metrics; revenue, gross profit operating profit and margin. Our modelling shows this extending through FY17e and FY18e as the proportion of revenues from the productised and scalable offer continues to build. This greater emphasis on developing the DP&S is driving gross margin (through greater use of own-panel and data in the Cube). In the year just reported, it rose from 77.0% to 78.9%, as a consequence of business mix. Operating margins (as reported) moved up from 11.3% to 12.4%, reflecting a reduced requirement for investment in headcount within Data Products and clearly demonstrating the scalability of the activity. The improvement also reflects the relocation of some of the operational costs to Romania, and some elements of increased automation.
|
Exhibit 8: Long-term growth record and forecasts |
|
|
Source: Company accounts, Edison Investment Research |
Exceptional costs for the year at £1.1m were the same level as the prior year. They primarily related to the further restructuring of the German business, which is now returned to revenue growth and where the proportion of data products and services is starting to build in a more meaningful fashion. The relationship with Handelsblatt is helping with the public profile of the YouGov brand in the German market.
The underlying tax charge was 31%, well ahead of last year’s 22%, which had benefited from utilisation of deferred tax losses. The increase in charge is a natural consequence of growing the US profits.
In 2015, the group put in place a new LTIP on the expiry of the previous scheme, based on five-year CAGR in earnings per share. Although the awards are high in terms of salary multiples and number of shares (particularly for the CEO), the triggering thresholds are particularly demanding, with no grant if earnings growth is below 10% or if operating margin fails to average more than 12% over the five years to July 2019. Full payout requires 25% compound annualised earnings growth. This scheme means higher share-based payments, but this is stripped out of our definition of normalised operating profits. Compound growth in adjusted earnings per share was 20% for FY14 to FY16. Our model currently shows a CAGR from FY14 through FY18e of 20% and operating margin running at an average of 12.2% (improving in each year).
Strong cash conversion
Cash conversion for the group typically runs at between 80% and 120%. In the year just reported, it was even stronger, at 130%, having been at the top end of the range in the two previous years. Capital spend at £6.1m (FY15: £5.8m) included £2.9m spent on software/technology development and £2.0m (£1.5m) investment in panel recruitment. There was an additional benefit of £1.0m in exchange gains. Subscription product growth is also contributing to cash generation, with deferred subscriptions adding £1.8m to the working capital inflow in FY16.
While there is ambition to grow the group through acquisition as well as via the organic route, any deals struck will need to be relevant to the strategy, for example through adding better or new sources of data, limiting the number of potential opportunities. The substantial step up in the dividend payment from 1.0p to 1.4p for FY16 should be seen in this context.
Cash-rich balance sheet
With the growth in subscription revenues, these now constitute a meaningful balance sheet item, with £7.2m of deferred subscription income included in ‘Trade payables’ at the balance sheet date. YouGov ended its financial year with net cash of £15.6m, well ahead of the £10.0m at end July 2015. There is no outstanding deferred acquisition cost in the balance sheet.
Exhibit 9: Financial summary
£'000s |
2014 |
2015 |
2016 |
2017e |
2018e |
||
Year end 31 July |
IFRS |
IFRS |
IFRS |
IFRS |
IFRS |
||
PROFIT & LOSS |
|||||||
Revenue |
|
|
67,375 |
76,110 |
88,202 |
101,000 |
111,000 |
Cost of Sales |
(15,812) |
(17,472) |
(19,476) |
(22,220) |
(24,420) |
||
Gross Profit |
51,564 |
58,638 |
68,726 |
78,780 |
86,580 |
||
EBITDA |
|
|
8,020 |
9,273 |
11,620 |
13,474 |
15,703 |
Operating Profit (before GW, except and share-based payments) |
7,936 |
9,239 |
12,055 |
13,871 |
16,100 |
||
Intangible Amortisation |
(3,965) |
(4,633) |
(5,478) |
(5,000) |
(5,000) |
||
Share based payments |
(547) |
(669) |
(1,138) |
(1,100) |
(1,100) |
||
Exceptionals |
(2,385) |
(1,072) |
(1,108) |
0 |
0 |
||
Other |
(14) |
41 |
(4) |
0 |
0 |
||
Operating Profit |
1,025 |
2,906 |
4,327 |
7,771 |
10,000 |
||
Net Interest |
(292) |
(220) |
1,199 |
129 |
150 |
||
Profit Before Tax (norm) |
|
|
7,630 |
9,060 |
13,250 |
14,000 |
16,250 |
Profit Before Tax (FRS 3) |
|
|
733 |
2,686 |
5,526 |
7,900 |
10,150 |
Tax |
(316) |
580 |
(2,111) |
(3,430) |
(4,306) |
||
Profit After Tax (norm) |
7,314 |
9,640 |
11,139 |
10,570 |
11,944 |
||
Profit After Tax (FRS 3) |
417 |
3,266 |
3,415 |
4,470 |
5,642 |
||
Average Number of Shares Outstanding (m) |
98.0 |
101.0 |
103.9 |
104.3 |
104.3 |
||
EPS - normalised fully diluted (p) |
|
|
5.8 |
6.7 |
8.5 |
9.8 |
11.1 |
EPS - FRS 3 (p) |
|
|
0.4 |
3.2 |
3.3 |
4.3 |
5.4 |
Dividend per share (p) |
0.8 |
1.0 |
1.4 |
1.6 |
1.8 |
||
Gross Margin (%) |
76.5 |
77.0 |
77.9 |
78.0 |
78.0 |
||
EBITDA Margin (%) |
11.9 |
12.2 |
13.2 |
13.3 |
14.1 |
||
Operating Margin (before GW and except & share-based payments) (%) |
11.0 |
11.3 |
12.4 |
12.6 |
13.5 |
||
BALANCE SHEET |
|||||||
Fixed Assets |
|
|
52,259 |
53,726 |
62,366 |
62,366 |
62,366 |
Intangible Assets |
46,650 |
46,145 |
53,140 |
53,140 |
53,140 |
||
Tangible Assets |
5,609 |
7,377 |
8,984 |
8,984 |
8,984 |
||
Investments |
0 |
204 |
242 |
242 |
242 |
||
Current Assets |
|
|
29,873 |
33,329 |
45,339 |
53,178 |
62,144 |
Stocks |
0 |
0 |
0 |
0 |
0 |
||
Debtors |
21,687 |
22,507 |
28,643 |
33,127 |
36,407 |
||
Cash |
7,429 |
10,017 |
15,553 |
18,908 |
24,594 |
||
Current Liabilities |
|
|
(21,480) |
(22,983) |
(27,823) |
(31,546) |
(34,669) |
Creditors |
(21,296) |
(22,983) |
(27,823) |
(31,546) |
(34,669) |
||
Short term borrowings |
(184) |
0 |
0 |
0 |
0 |
||
Long Term Liabilities |
|
|
(2,700) |
(2,449) |
(5,793) |
(3,000) |
(3,000) |
Long term borrowings |
0 |
0 |
0 |
0 |
0 |
||
Other long term liabilities |
(2,700) |
(2,449) |
(5,793) |
(3,000) |
(3,000) |
||
Net Assets |
|
|
57,952 |
61,623 |
74,089 |
80,998 |
86,841 |
CASH FLOW |
|||||||
Operating Cash Flow |
|
|
8,600 |
10,091 |
14,139 |
14,500 |
16,700 |
Net Interest |
(295) |
(233) |
11 |
129 |
150 |
||
Tax |
(287) |
(730) |
(2,365) |
(3,932) |
(3,649) |
||
Capex |
(5,759) |
(5,754) |
(6,076) |
(5,750) |
(5,750) |
||
Acquisitions/disposals |
(1,003) |
(470) |
(171) |
(36) |
0 |
||
Financing |
(101) |
454 |
16 |
0 |
0 |
||
Dividends |
(566) |
(773) |
(1,028) |
(1,556) |
(1,765) |
||
Net Cash Flow |
589 |
2,585 |
4,526 |
3,355 |
5,686 |
||
Opening net debt/(cash) |
|
|
(6,656) |
(7,245) |
(10,017) |
(15,553) |
(18,908) |
HP finance leases initiated |
0 |
0 |
0 |
0 |
0 |
||
Other |
0 |
187 |
1,010 |
0 |
0 |
||
Closing net debt/(cash) |
|
|
(7,245) |
(10,017) |
(15,553) |
(18,908) |
(24,594) |
Source: Company accounts, Edison Investment Research
|
|||||||||||||||||||||||||||||||||||||||||||||||||||||||
|
|