Last close As at 05/08/2026
—
— 0.00 (0.00%)
Market capitalisation
—
Research: Financials
In addition to successfully executing a high volume of transactions for clients in the first half, Numis continues to plan investment to strengthen and broaden its capabilities to support longer-term growth through market cycles. With over 60% of transaction fee income in H120 coming from outside the retained client base there is evidence that the company is succeeding in building a wider reputation.
Written by
Numis Corporation |
Very strong results, consistent strategy |
H121 results and outlook |
Financial services |
13 May 2021 |
Share price performance
Business description
Next events
Analyst
Numis Corporation is a research client of Edison Investment Research Limited |
|||||||||||||||||||||||||||||||||||||||||||||||||
In addition to successfully executing a high volume of transactions for clients in the first half, Numis continues to plan investment to strengthen and broaden its capabilities to support longer-term growth through market cycles. With over 60% of transaction fee income in H120 coming from outside the retained client base there is evidence that the company is succeeding in building a wider reputation.
Year end |
Revenue (£m) |
PBT* |
EPS* |
DPS |
P/E |
Yield |
09/18 |
136.0 |
31.6 |
23.0 |
12.0 |
16.4 |
3.2 |
09/19 |
111.6 |
12.4 |
8.1 |
12.0 |
46.4 |
3.2 |
09/20 |
154.9 |
37.1 |
26.7 |
12.0 |
14.1 |
3.2 |
09/21e |
196.6 |
55.1 |
37.0 |
12.0 |
10.2 |
3.2 |
Note: *PBT and EPS are on a reported basis and EPS is fully diluted.
H121 results
Numis reported a strong performance across the group with revenue of £115.4m in H121, up 83% versus H120 and modestly ahead of the c £110m indicated in the March trading update. This reflected generally increased levels of capital markets activity together with market share gains for the Equities business. Investment banking revenue more than doubled to £82m and Equities revenue was up 27%. In other income there was a near-£2m gain on the investment portfolio (valued at £16.2m). Costs increased by 42% mainly driven by variable compensation, while the compensation ratio was stable compared with H220 at 53%. This left pre-tax profit at £39.3m, more than five times the H120 level of £7.3m, demonstrating the operational leverage of the business. EPS increased from 5.5p to 25.7p after a higher tax charge of 24% versus 14%. The dividend was unchanged at 5.5p in line with the board policy of maintaining dividends and using share buybacks or special dividends to return excess capital where appropriate.
Looking beyond the UK
For the second half Numis reports a strong pipeline across the investment banking activities, with a broader diversification by sector evident as the market gains confidence in economic recovery. Adverse pandemic or economic developments could dent market confidence and prevent delivery of the pipeline, and conservatively we have assumed some normalisation in H220 revenues, only increasing our FY21 earnings estimate modestly. For the longer term, Numis continues to invest in staff to strengthen capacity and plans to open a Dublin office to address opportunities in Europe.
Valuation appears to factor in a safety margin
The shares trade on P/E multiples in line with the average for US and European investment banks and advisory firms. At a price to book multiple of 2.3x they trade above their 10-year average and, using an ROE/COE model, the current share price implies an assumed ROE of just below 18% (the five-year average value). This is also well below the 25% ROE we estimate for FY21, so the market seems to be factoring in a wide safety margin for a prospective normalisation of activity levels.
Building the breadth of the investment bank
Numis was founded in the late 1980s and listed on AIM in 1996. It has grown to become a leading UK investment banking group and has stated its aim as striving to become ‘the investment bank of a generation’. The current co-CEOs, Alex Ham and Ross Mitchinson, joined the company in 2005 and 2008 respectively and assumed their roles in September 2016.
A developing range of investment banking capabilities
In addition to strengthening its traditional UK corporate broking, equity capital market, sales, research and trading services through recruitment and IT infrastructure, Numis has, over time, invested in developing mergers and acquisitions advisory, debt advisory and private markets (Growth Capital Solutions) capabilities enabling it to assist companies across a wider range of situations. This has supported client service, contributing to longer-term growth in the business. Numis remains a largely UK-focused investment bank but transactions for non-UK corporates feature on its deal list and with its H121 results the company announced the planned opening of a Dublin office. This would not only enable provision of trading and research services to European Union institutional investors, but is also intended help in attracting European Union capital markets transactions and in extending the geographical reach of Growth Capital Solutions.
Until 2020 development of the corporate franchise was clearly evident in the increase in the number of retained corporate clients (Exhibit 1). A large part of the reduction in the client count seen in 2020 resulted from the decision to withdraw from the natural resources sector and the associated resignation from 18 brokerships, three of which took place in H121. Numis is committed to building a high-quality client list. While this is reflected to some extent in the continued increase in the average market capitalisation of clients, the aim is to sign up companies of all sizes, public and private, which have long-term ambition and for which Numis believes it can add value through its services.
|
Exhibit 1: Corporate client numbers and market cap |
Exhibit 2: Revenue progression (year to 30 September) |
|
|
|
Source: Numis, Edison Investment Research |
|
Exhibit 1: Corporate client numbers and market cap |
|
|
Source: Numis, Edison Investment Research |
|
Exhibit 2: Revenue progression (year to 30 September) |
|
|
Source: Numis, Edison Investment Research |
Growth through market fluctuations
Between 2008 and 2012, in the wake of the global financial crisis, Numis’s revenue was relatively stable within a range between £48m and £54m and it was in 2013 that revenue stepped up to £78m driven by growth in Capital Markets. Subsequent growth, shown in Exhibit 2, was also to a large extent attributable to development of the Capital Markets business (supported by the Equities business) with its contribution to revenues expanding from 39% to 55% between FY14 and H121. Reflecting the dependence of transactions on the market environment, the progress of Capital Markets revenues has not been uninterrupted with FY19, for example, showing a material reduction alongside other parts of the business as political uncertainty put a brake on activity. Over the period shown, Institutional revenue was restrained by downward pressure on commission rates that was only intensified by the implementation of MiFID II in January 2018. As a result, Institutional revenue fell as a proportion of group revenue from 34% to 19%. Corporate retainers provide a resilient source of annual fees and have grown with the client base although accounting for a reduced share of revenue over the period, ending at 5% in H121, a particularly strong period for Capital Markets. Unsurprisingly, Trading has seen fluctuations in income but has contributed positively in each year and grown significantly over the period; on average it contributed 7% of group revenue. Finally, Advisory has also recorded fluctuations in its revenue and percentage contribution reflecting changes in the M&A environment with a revival in activity in the latest period, H121, taking its contribution to 11% of total revenue.
Investment in staff and cost control
The largest element of cost for the business is staff remuneration and Exhibit 3 shows the growth in average headcount that has accompanied growth in the business illustrated in Exhibits 1 and 2. Notable here is the step up in staff numbers in FY19 as the group invested to support client service and future growth following sustained expansion of the client base. This resulted in a marked reduction in revenue per head as it coincided with a year of lower revenues; subsequently this measure has recovered sharply, to £804,000 in H121. For most of the period since 2013 the compensation ratio (Exhibit 4) has remained close to the average value of 53% reflecting flexing in the level of variable compensation in line with pre-bonus profits. Non-staff costs have increased at an annual compound rate of c 8% between 2013 and H121 but have been held broadly stable in absolute terms since 2018. Variations in revenue have meant that the overall cost/income ratio has ranged between 89% in 2019 and 65% in H121 with an average of 75% over the period shown in Exhibit 4. This gave an operating profit margin of between 13% (FY19) and 34% (H121) for the period shown (average 25%).
|
Exhibit 3: Headcount and revenue per head |
Exhibit 4: Staff and non-staff cost ratios |
|
|
|
Source: Numis, Edison Investment Research |
|
Exhibit 3: Headcount and revenue per head |
|
|
Source: Numis, Edison Investment Research |
|
Exhibit 4: Staff and non-staff cost ratios |
|
|
Source: Numis, Edison Investment Research |
Strategy
Within the group’s overall vision of becoming the investment bank of a generation, management has identified five strategic pillars that, if executed successfully, should secure sustainable growth (subject to market cycles), profitability and attractive shareholder returns.
1.
Build the size and quality of the corporate franchise. Here the aim is to grow the corporate client base across the market capitalisation spectrum focusing on high-quality companies. Numis seeks to be the natural home for interesting and ambitious small-cap companies.
2.
Become the leading UK equities platform, with the intention being to grow market share in UK equities and UK equity capital markets.
3.
Develop complementary products and services. Objectives include increasing advisory revenues, further developing its position in private markets and targeting non-UK revenue opportunities (note the planned Dublin office).
4.
Maintain operating and capital discipline. Numis has signalled that the move to a new London office will increase fixed costs but this strategic move has been accompanied by control over other non-staff costs. As shown above the compensation ratio has been managed through market fluctuations. The group continues to maintain prudent liquidity and capital positions.
5.
Deliver shareholder returns. Revenue growth and greater diversity of income together with the group’s commitment to use share buybacks to control the share count should contribute to growth and reduced volatility in EPS through the market cycle.
H121 results
Revenue growth of 83% for H121 compared with H120 reflected strong growth in Capital Markets, Advisory and Trading gains. Cost growth of 42%, driven mainly by increased variable compensation, left pre-tax profits up 442%, demonstrating the operational leverage of the business. EPS were 365% ahead after an increased effective tax rate of 24% versus 14%. The dividend was unchanged at 5.5p in line with the board policy of maintenance with the potential for the return of excess capital through share buybacks or special dividends. Exhibit 5 provides a summary of the H121 figures including the segmental revenue analysis. Further commentary is given below with figures compared with H120 unless stated.
Exhibit 5: Profit and loss analysis
£m unless stated |
H120 |
H220 |
H121 |
% change y-o-y |
Net trading gains |
6.5 |
9.5 |
11.5 |
75.7 |
Institutional income |
19.7 |
17.5 |
21.9 |
11.1 |
Equities |
26.2 |
27.0 |
33.4 |
27.3 |
Corporate retainers |
6.8 |
6.7 |
6.3 |
(7.6) |
Advisory |
7.2 |
3.9 |
12.4 |
72.0 |
Capital markets |
22.8 |
54.2 |
63.3 |
177.3 |
Investment banking |
36.9 |
64.8 |
82.0 |
122.5 |
Total revenue |
63.1 |
91.8 |
115.4 |
82.9 |
Other operating income |
(1.9) |
2.2 |
2.0 |
N/A |
Total income |
61.2 |
94.0 |
117.4 |
91.8 |
Staff costs |
(36.6) |
(49.4) |
(61.0) |
66.7 |
Non-staff costs |
(17.4) |
(15.0) |
(15.7) |
(10.0) |
Total administrative expenses |
(54.0) |
(64.4) |
(76.7) |
42.0 |
Operating profit / loss |
7.2 |
29.6 |
40.7 |
463.8 |
Finance income/expense |
0.0 |
0.2 |
(1.4) |
N/A |
Pre-tax profit |
7.3 |
29.8 |
39.3 |
441.9 |
Tax |
(1.0) |
(4.7) |
(9.5) |
852.0 |
Effective tax rate (%) |
13.8 |
15.8 |
24.3 |
|
Attributable profit |
6.3 |
25.1 |
29.8 |
376.1 |
Diluted EPS (p) |
5.5 |
20.7 |
25.7 |
364.9 |
Dividend (p) |
5.5 |
6.5 |
5.5 |
0.0 |
Operating profit before other income |
9.1 |
27.4 |
38.8 |
324.6 |
Operating margin before other income (%) |
14.5 |
29.8 |
33.6 |
Source: Numis, Edison Investment Research
Net trading gains were up 76% y-o-y and were 22% ahead compared with a strong period in H220. Contributing to the result was a decline in market volatility, following which Numis increased trading book limits, allowing it to take advantage of greater demand for liquidity in smaller and mid-cap stocks as the market appetite for these segments of the market revived.
The Institutional equities activity benefited from high levels of secondary trading and the reduction in income from EU clients following Brexit was more than offset by increased income generated by US clients. The electronic trading platform, launched in FY20 to complement the existing high-touch execution offering, is serving a growing list of clients and increasing revenues in line with the group’s expectations. Overall revenue for the Institutional activities was up 11%.
Corporate retainers were modestly lower on a smaller corporate client list, while Advisory revenue staged a sharp recovery with revenues up 72% or threefold compared with H220. The improvement reflected a revival in UK M&A activity as pandemic concerns eased and was supported by earlier investment in staff to build sector expertise and transaction execution capability.
Capital markets revenue increased by 177% with a more diverse range of products contributing to the performance, featuring a strong recovery in IPO activity as well as placings, block trades and private market transactions (Exhibit 6 sets out selected transactions since the start of FY21). Numis had a leading market share of UK IPOs during this period and completed more Main Market IPOs than any other investment bank. In addition to a growth in the number of transactions, Numis has continued to achieve higher average deal fees reflecting a combination of deal size, its ability to command more senior roles and the development of Growth Capital Solutions, which tends to earn higher deal fees.
Exhibit 6: Numis – selected transactions FY21 to-date
Company |
Date |
Role |
Transaction |
Money raised/ value (£m) |
Cazoo |
Oct-20 |
Joint placement agent |
Private fund raise |
240 |
Draper Esprit |
Oct-20 |
NOMD, joint global coordinator, bookrunner and broker |
Placing |
110 |
Aquila Capital |
Oct-20 |
Broker, adviser and joint bookrunner |
Placing |
116 |
Merian Global Investors |
Oct-20 |
Joint bookrunner |
IPO |
95 |
Synairgen |
Oct-20 |
Joint broker and bookrunner |
Placing and open offer |
87 |
Victoria |
Oct-20 |
Debt adviser |
Preferred equity investment |
175 |
Aveva |
Oct-20 |
Joint global coordinator, bookrunner and broker; sole sponsor |
Rights issue to finance acquisition |
2,800 |
Waterfall Asset Management |
Nov-20 |
Financial adviser |
M&A |
639 |
Future |
Nov-20 |
Sponsor, joint financial adviser and broker |
M&A |
594 |
Pets at Home |
Nov-20 |
Sole financial adviser |
M&A |
100 |
Electrocomponents |
Dec-20 |
Joint broker and bookrunner |
Placing |
180 |
Bytes Technology |
Dec-20 |
Sole sponsor, financial and debt adviser, global coordinator and bookrunner |
IPO |
647 |
AJ Bell |
Dec-20 |
Sole broker |
Block trade |
25 |
Clipper Logistics |
Jan-21 |
Joint bookrunner |
Block trade |
62 |
Bambuser |
Jan-21 |
Joint global coordinator and bookrunner |
Placing |
52 |
VH Global Sustainable Energy Opportunities |
Jan-21 |
Sponsor and sole bookrunner |
IPO |
243 |
HSS Hire |
Jan-21 |
Sponsor and nominated adviser |
Placing and open offer |
53 |
Scapa |
Jan-21 |
Joint corporate broker and nominated adviser |
M&A |
403 |
Moonpig |
Jan-21 |
Joint bookrunner |
IPO |
1,197 |
Foresight |
Feb-21 |
Sole sponsor, joint global coordinator and bookrunner |
IPO |
455 |
Knights |
Feb-21 |
Sole bookrunner |
Block trade |
62 |
Polypipe |
Feb-21 |
Joint bookrunner and corporate broker |
Placing |
96 |
Future |
Feb-21 |
Sole sponsor and joint adviser and broker |
M&A |
594 |
Hargreaves Lansdown |
Feb-21 |
Joint global coordinator and bookrunner |
Placing |
300 |
Auto1 |
Feb-21 |
Bookrunner |
IPO |
6,690 |
Auction Technology |
Feb-21 |
Sole sponsor and joint global coordinator and bookrunner |
IPO |
600 |
Cazoo |
Feb-21 |
Sole financial adviser |
M&A |
N/A |
Fuller Smith & Turner |
Mar-21 |
Sole bookrunner and corporate broker |
Placing |
54 |
Arrow Global |
Mar-21 |
Financial adviser and corporate broker |
M&A |
563 |
Keywords Studio |
Apr-21 |
Sole bookrunner |
Placing |
84 |
Source: Numis, Edison Investment Research
Evidencing the growth in Numis’s reputation and its broader capabilities, it has been attracting more business from outside its retained corporate client base and in the first half such clients accounted for more than 60% of investment banking deal fee revenue (in recent periods this percentage has typically been around 30%).
Interest from international clients and the potential to develop European business post Brexit has prompted progress with plans to open an office in Dublin in H122, subject to regulatory approval.
In other income there was a near-£2m gain on the investment portfolio (valued at £16.2m). One investment was partially exited in the first half and further exits are expected in the second half as Numis seeks to sell legacy holdings.
On expenses the compensation ratio was stable when compared with H220 at 53%, while in absolute terms staff costs rose by 67% and non-staff costs were down by 10% as there were some savings due to remote operation. The average headcount was in line with H120 and the end-FY20 level and Numis notes that the market for talent is increasingly competitive given the increased activity levels, which are prompting other investment banks to become more active in hiring. As well as taking measures to retain staff, Numis itself expects to increase its headcount in the second half, particularly in investment banking and Growth Capital Solutions to provide additional capacity to execute deals.
Background and outlook
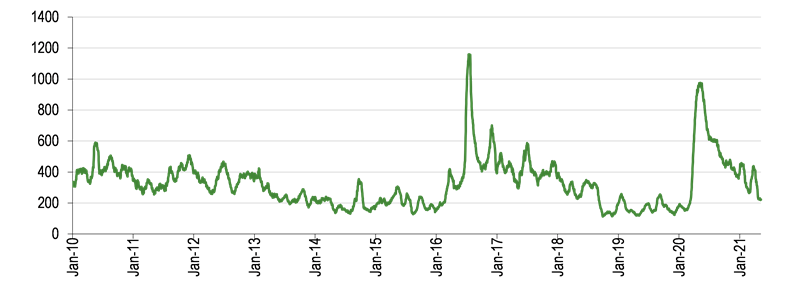
In this section we briefly review the background and outlook for Numis’s activities and start with the Economic Policy Uncertainty Index (Exhibit 7) as an indicator of the environment for investor and corporate decision-making. The index component selected here reflects daily newspaper coverage related to economic uncertainty. This highlights the spikes in uncertainty around the UK EU membership referendum in June 2019 and the onset of the pandemic in the first half of 2020. On this measure the levels of uncertainty last year fell rapidly after the initial lockdown and have then followed a downward path, with some setbacks, into the current year mirroring the progress that has been made in containing COVID19 in the UK if not globally.
|
Exhibit 7: UK Economic Policy Uncertainty Index (newspaper-based) |
|
|
Source: 'Measuring Economic Policy Uncertainty' by Scott Baker, Nicholas Bloom and Steven J. Davis at www.policyuncertainty.com (CC BY 4.0) |
The next two charts show money raised on the London Stock Exchange Main and AIM markets by month. Starting with the Main Market at end 2019 and early 2020, election, Brexit and then initial COVID-19 uncertainties depressed issuance, but this was followed by a surge of equity issues to support balance sheets. This subsequently tapered off and towards the end of 2020 and into 2021 IPO activity returned and capital raising for other purposes revived as companies sought finance for growth or M&A opportunities. For AIM the pattern is less clear, but higher issuance is evident in mid-2020 and again in late-2020 and from February this year. The number of AIM IPOs has picked up from a very low base: in Numis’s H121 period to end March there were 31 compared with 10 in the prior year period. Looking at the level of money raised in new and further issues (as shown in the charts), the Main Market was up 270% in the H121 period while for AIM the increase was 75%.
|
Exhibit 8: LSE Main Market issuance (money raised) |
Exhibit 9: LSE AIM issuance (money raised) |
|
|
|
Source: London Stock Exchange |
|
Exhibit 8: LSE Main Market issuance (money raised) |
|
|
Source: London Stock Exchange |
|
Exhibit 9: LSE AIM issuance (money raised) |
|
|
Source: London Stock Exchange |
Turning to the performance of UK equity market indices (CBOE All-Companies and Small-Cap), Exhibit 10 shows how the sharp initial impact of the pandemic was followed by a more gradual recovery. The chart also shows the more recent outperformance of the small-cap index reflecting a market rotation into more economically sensitive areas of the market. The strength of market performance has played into the strength of issuance shown above and the level of transaction activity that Numis has reported. The final chart in this section shows the daily value traded on the London Stock Exchange order book. This shows the relatively short-lived spike in trading volumes in the first half of last year following the arrival of the pandemic. Subsequently activity subsided but then returned to the range seen in prior years.
|
Exhibit 10: All-companies and small cap indices |
Exhibit 11: LSE order book, average daily value traded |
|
|
|
Source: Refinitiv. Note: CBOE UK net-return indices. |
Source: London Stock Exchange (Main Market) |
|
Exhibit 10: All-companies and small cap indices |
|
|
Source: Refinitiv. Note: CBOE UK net-return indices. |
|
Exhibit 11: LSE order book, average daily value traded |
|
|
Source: London Stock Exchange (Main Market) |
Looking ahead, Numis reports that the investment banking pipeline has a high volume of IPO mandates and that the near-term outlook for Growth Capital Solutions and M&A Advisory is encouraging. Therefore, the second half could see a continuation of the breadth of activity seen in the first half. However, as usual, the delivery of such a pipeline is dependent on market conditions with IPOs likely to be particularly sensitive to a return of volatility. For the moment the success of COVID19 countermeasures in the UK is a positive factor, but the much more mixed international picture and the potentially significant macroeconomic after effects of lockdowns and other measures could be a source of disruption for markets.
Financials
Exhibit 12 shows a segmental analysis of our revenue assumptions for H221 and FY21 with prior full-year comparatives. The considerable uncertainty over revenues in any particular period should be borne in mind when viewing the estimates. An indication of the sensitivity of profitability to changes in revenue can be seen in the scenario analysis included in our December 2020 note. We have assumed a significant normalisation of revenues in H221 following the very high levels of activity seen in the first half. The second half estimate of total revenue of £81m, while well below the £115m reached in the first half, is still high in the context of revenues achieved in previous years. A sharp turn in market sentiment could mean a greater correction or, on the other hand, continuation of favourable conditions could generate further record numbers in the second half.
Exhibit 12: Revenue analysis
£000s |
2018 |
2019 |
2020 |
H121 |
H221e |
2021e |
Net trading gains |
9,594 |
4,008 |
16,003 |
11,507 |
5,993 |
17,500 |
Institutional income |
37,866 |
33,317 |
37,192 |
21,879 |
17,621 |
39,500 |
Equities |
47,460 |
37,325 |
53,195 |
33,386 |
23,614 |
57,000 |
Corporate retainers |
12,430 |
13,357 |
13,536 |
6,293 |
6,290 |
12,583 |
Advisory |
17,335 |
12,576 |
11,146 |
12,428 |
11,572 |
24,000 |
Capital markets |
58,822 |
48,352 |
77,022 |
63,319 |
39,681 |
103,000 |
Investment banking |
88,587 |
74,285 |
101,704 |
82,040 |
57,543 |
139,583 |
Total revenue |
136,047 |
111,610 |
154,899 |
115,426 |
81,157 |
196,583 |
Source: Edison Investment Research
On expenses, we assume that the second half compensation ratio will be similar to the first half as Numis indicates spending on staff recruitment may offset any reduction in the ratio that might otherwise be seen. On non-staff costs, Numis guides to a total increase of £4m in occupancy costs in FY21 compared with FY20 following the start of the lease on the new London office in February ahead of the expected move in September. In addition to this, a £1m exceptional cost of relocation is expected this year (a similar £1.3m exceptional charge was also incurred last year). As a reminder, the 50,000 square foot office will be c 60% larger than the existing one, providing capacity for growth over the term of the 15-year lease. From FY22, when dual running costs drop out, Numis expects ongoing occupancy costs to be £3m higher than in FY20. FY22 will also benefit from the absence of the exceptional cost associated with the move. There are, however, set to be costs associated with the planned opening of a Dublin office. This, we assume, is likely to be primarily additional staff cost and will be scaled to the initial revenue opportunity so we would be surprised to see this above low single-digit millions.
Changes in the key numbers from our forecasts are shown below, with further detail from the new forecast given in the financial summary table (Exhibit 16). Our revenue and profit estimates are modestly higher reflecting the slightly higher first half revenue than indicated at the time of the last trading update. The higher than expected first half tax charge accounts for the smaller movement in our EPS estimate.
Exhibit 13: Estimate changes
Revenue (£m) |
PBT (£m) |
Fully diluted EPS (p) |
DPS (p) |
|||||||||
Old |
New |
Change |
Old |
New |
Change |
Old |
New |
Change |
Old |
New |
Change |
|
09/21e |
185.0 |
196.6 |
6.3% |
52.4 |
55.1 |
5.2% |
36.7 |
37.0 |
0.8% |
12.0 |
12.0 |
0.0% |
Source: Edison Investment Research
At the end of the period cash stood at £97.6m compared with £95.3m at end H120 and £125.2m at the end of FY20. The £27.6m cash outflow in the first half reflected an operating cash outflow of £5.9m, dividend payments of £6.8m, share repurchases totalling £11.5m, capital spending (partly related to the new London office) of £1.6m and other expenditure items, including lease payments, of £1.8m. The operating cash outflow included £43m absorbed in working capital items. Normally a volatile item for brokers with market making activities, the increase in trading book limits would have been an important factor here. Prospectively, Numis highlights that second half capital spending will increase substantially as the fitout of the London office is completed.
Numis confirms that it continues to operate with capital significantly in excess of its regulatory requirements. The Pillar 3 disclosure for end September 2020 showed total Pillar 1 funds of £157.2m compared with a Pillar 1 regulatory requirement (plus capital conservation buffer of 2.5% of risk weighted assets) of £49.7m.
Valuation
We start with a peer comparison table showing UK investment banks/brokers and US and European investment banks and advisory firms. This is more for reference at this stage because the other UK companies lack consensus estimates and, with different reporting points across the peers and earnings changing substantially currently, it is more than usually difficult to make comparisons. We highlight three points: Numis offers a relatively high yield, its P/E ratios are similar to those of the US investment banks and its return on equity (ROE) (based on the very strong H121 period) is high in the range.
Exhibit 14: Peer comparison
Price |
Market cap |
Last reported |
Current P/E |
Yield |
ROE |
Price to book |
|
UK brokers |
|||||||
Numis |
377 |
406 |
14.1 |
10.2 |
3.2 |
36.0 |
2.3 |
Arden Partners |
14 |
4 |
Loss |
N/A |
0.0 |
N/A |
0.8 |
Cenkos |
84 |
47 |
25.2 |
N/A |
4.2 |
8.0 |
1.5 |
FinnCap |
44 |
76 |
31.9 |
N/A |
1.0 |
9.8 |
3.2 |
WH Ireland |
58 |
36 |
37.3 |
N/A |
0.0 |
7.7 |
3.3 |
UK brokers average |
27.1 |
10.2 |
1.7 |
15.4 |
2.2 |
||
US, European IB and advisory |
|||||||
Bank of America |
41.6 |
356,227 |
22.2 |
13.7 |
1.7 |
6.8 |
1.4 |
Evercore |
139.2 |
6,472 |
14.5 |
12.2 |
1.7 |
43.8 |
4.6 |
Goldman Sachs |
359.9 |
122,287 |
14.5 |
8.1 |
1.4 |
10.2 |
1.3 |
Greenhill |
15.7 |
307 |
11.6 |
10.1 |
1.3 |
N/A |
N/A |
Jefferies Financial |
32.5 |
8,029 |
12.3 |
7.5 |
1.8 |
8.1 |
0.9 |
JP Morgan |
158.5 |
479,921 |
17.9 |
12.1 |
2.3 |
12.0 |
1.9 |
Moelis |
51.2 |
3,392 |
17.6 |
15.2 |
2.7 |
N/A |
6.2 |
Morgan Stanley |
84.9 |
158,001 |
12.9 |
12.4 |
1.6 |
13.3 |
1.7 |
PJT Partners |
70.4 |
2,523 |
14.3 |
14.7 |
0.3 |
N/A |
10.9 |
Stifel Financial |
67.5 |
7,095 |
14.8 |
12.6 |
0.7 |
N/A |
1.9 |
Credit Suisse |
9.1 |
23,182 |
8.5 |
8.3 |
1.1 |
5.9 |
0.5 |
Deutsche Bank |
11.3 |
23,380 |
16.9 |
14.8 |
0.0 |
2.6 |
0.4 |
UBS |
15.1 |
58,183 |
8.4 |
9.3 |
1.1 |
11.5 |
0.9 |
US, European IB and advisory average |
14.3 |
11.6 |
1.4 |
12.7 |
2.7 |
||
Source: Refinitiv. Note: Priced at 12 May 2021; P/Es are for financial years therefore not all same period end.
The chart below shows a 10-year history of the price to book ratio for Numis. The current value is 2.3x, above the 10-year average of 2.0x. Using an ROE/COE model to infer the ROE required to match the current share price (377p) gives a value of 17.7%. This is just below the five-year historical average of 18% and more markedly lower than our estimate for the current year of 25%. This implies a material margin for disappointment in prospective results and, arguably, suggests the market is not yet according full credit for the strengthening of the franchise that has taken place in recent years.
|
Exhibit 15: 10-year history of the price to book value ratio for Numis |
|
|
Source: Refinitiv, Edison Investment Research |
Exhibit 16: Financial summary
£'000s |
2015 |
2016 |
2017 |
2018 |
2019 |
2020 |
2021e |
|||
Year end 30 September |
||||||||||
PROFIT & LOSS |
||||||||||
Revenue |
|
|
97,985 |
112,335 |
130,095 |
136,047 |
111,610 |
154,899 |
196,583 |
|
Administrative expenses (excl. amortisation and depreciation) |
(65,018) |
(76,120) |
(83,626) |
(94,603) |
(85,432) |
(105,327) |
(127,102) |
|||
Share based payment |
(4,104) |
(6,229) |
(10,454) |
(10,583) |
(10,914) |
(9,961) |
(9,000) |
|||
EBITDA |
|
|
28,863 |
29,986 |
36,015 |
30,861 |
15,264 |
39,611 |
60,481 |
|
Depreciation |
|
|
(882) |
(1,126) |
(1,226) |
(1,113) |
(1,124) |
(3,016) |
(5,293) |
|
Amortisation |
(111) |
(125) |
(89) |
(49) |
(44) |
(105) |
(110) |
|||
Operating Profit |
|
|
27,870 |
28,735 |
34,700 |
29,699 |
14,096 |
36,490 |
55,078 |
|
Net finance income |
190 |
37 |
188 |
212 |
550 |
263 |
(1,941) |
|||
Other operating income |
(1,978) |
3,759 |
3,431 |
1,733 |
(2,210) |
310 |
1,974 |
|||
Profit before tax |
|
|
26,082 |
32,531 |
38,319 |
31,644 |
12,436 |
37,063 |
55,111 |
|
Tax |
(4,533) |
(6,132) |
(7,942) |
(4,967) |
(3,110) |
(5,713) |
(12,548) |
|||
Profit after tax (FRS 3) |
|
|
21,549 |
26,399 |
30,377 |
26,677 |
9,326 |
31,350 |
42,563 |
|
Average diluted number of shares outstanding (m) |
117.6 |
118.0 |
117.2 |
115.8 |
114.9 |
117.3 |
115.1 |
|||
EPS - basic (p) |
19.5 |
23.5 |
27.4 |
25.1 |
8.8 |
29.9 |
40.6 |
|||
EPS - diluted (p) |
|
|
18.3 |
22.4 |
25.9 |
23.0 |
8.1 |
26.7 |
37.0 |
|
Dividend per share (p) |
11.50 |
12.00 |
12.00 |
12.00 |
12.00 |
12.00 |
12.00 |
|||
NAV per share (p) |
102.0 |
113.5 |
125.0 |
135.0 |
131.3 |
149.8 |
161.5 |
|||
ROE (%) |
19% |
22% |
23% |
19% |
6.6% |
21.2% |
25.3% |
|||
EBITDA margin (%) |
29.5% |
26.7% |
27.7% |
22.7% |
13.7% |
25.6% |
30.8% |
|||
Operating margin (%) |
28.4% |
25.6% |
26.7% |
21.8% |
12.6% |
23.6% |
28.0% |
|||
BALANCE SHEET |
||||||||||
Fixed assets |
|
|
6,724 |
5,522 |
6,147 |
8,215 |
6,832 |
12,639 |
57,881 |
|
Current assets |
|
|
279,114 |
312,462 |
407,850 |
533,033 |
326,641 |
509,034 |
575,690 |
|
Total assets |
|
|
285,838 |
317,984 |
413,997 |
541,248 |
333,473 |
521,673 |
633,571 |
|
Current liabilities |
|
|
(170,319) |
(188,895) |
(280,371) |
(398,112) |
(195,319) |
(361,397) |
(417,956) |
|
Long term liabilities |
0 |
(12) |
0 |
0 |
0 |
(2,643) |
(36,873) |
|||
Net assets |
|
|
115,519 |
129,077 |
133,626 |
143,136 |
138,154 |
157,633 |
178,742 |
|
CASH FLOW |
||||||||||
Operating cash flow |
|
|
6,467 |
48,735 |
43,369 |
45,830 |
(2,748) |
65,953 |
14,247 |
|
Net cash from investing activities |
(3,632) |
84 |
(198) |
(1,014) |
(77) |
(474) |
(12,816) |
|||
Net cash from (used in) financing |
(17,510) |
(19,580) |
(36,359) |
(29,035) |
(24,646) |
(24,451) |
(35,730) |
|||
Net cash flow |
|
|
(14,675) |
29,239 |
6,812 |
15,781 |
(27,471) |
41,028 |
(34,299) |
|
Opening net (cash)/debt |
|
|
(74,518) |
(59,591) |
(89,002) |
(95,852) |
(111,673) |
(84,202) |
(125,217) |
|
FX effect |
|
|
(252) |
172 |
38 |
40 |
0 |
(13) |
27 |
|
Closing net (cash)/debt |
|
|
(59,591) |
(89,002) |
(95,852) |
(111,673) |
(84,202) |
(125,217) |
(90,945) |
|
Source: Company data, Edison Investment Research
|
|||||||||||||||||||||||||||||||||||||||||||||||||
|
|
Research: TMT
Tinexta’s Q121 results highlighted strong growth in organic revenue, profitability and free cash flow generation in what is typically a small quarter from a financial perspective. The recently acquired Cyber Security businesses are performing in line with management’s expectations, which is reassuring. Our forecasts are unchanged as is our DCF-base valuation of €27, representing 14% upside from the current share price.