Last close As at 17/08/2026
—
— 0.00 (0.00%)
Market capitalisation
—
Research: TMT
Kape has made solid progress in refining its product set and is now fully focused on the consumer cyber security segment. By leveraging its marketing platform to scale new products while also transitioning to a subscription model, we expect to see strong revenue growth and margin expansion translating to our forecast 16% three year CAGR in EPS. With $69.5m net cash, acquisitions should enhance this further. We believe the shares should be on a growth rating yet despite the recent performance, the 21.8x FY18 P/E is below peers. We see upside towards 157p.
Written by
Kape Technologies |
Unveiling Kape |
Initiation of coverage |
Software & comp services |
19 June 2018 |
Share price performance
Business description
Next events
Analysts
Kape Technologies is a research client of Edison Investment Research Limited |
|||||||||||||||||||||||||||||||||||||||||||||||
Kape has made solid progress in refining its product set and is now fully focused on the consumer cyber security segment. By leveraging its marketing platform to scale new products while also transitioning to a subscription model, we expect to see strong revenue growth and margin expansion translating to our forecast 16% three year CAGR in EPS. With $69.5m net cash, acquisitions should enhance this further. We believe the shares should be on a growth rating yet despite the recent performance, the 21.8x FY18 P/E is below peers. We see upside towards 157p.
Year end |
Revenue ($m) |
EBITDA |
PBT* |
EPS* |
DPS |
EV/EBITDA |
P/E |
12/16 |
56.5 |
6.4 |
4.8 |
2.9 |
0.00 |
25.2 |
40.5 |
12/17 |
66.4 |
8.3 |
7.5 |
4.9 |
4.94 |
19.5 |
24.2 |
12/18e |
72.9 |
10.3 |
8.9 |
5.5 |
0.00 |
15.6 |
21.8 |
12/19e |
77.1 |
13.2 |
11.5 |
7.1 |
0.00 |
12.2 |
17.1 |
Note: *PBT and EPS are normalised, excluding amortisation of acquired intangibles, exceptional items and share-based payments.
Building scale in consumer cyber security
Having transitioned away from ad tech, Kape’s divisions are now fully aligned to focus on the online distribution of consumer cyber security software. By expanding the product range, both organically and through acquisition, honing the company’s expertise in online user acquisition and transitioning to a subscription-based model, Kape expects to increase the lifetime value of its customers, while at the same time improving the quality of its earnings.
Forecasts: Revenue and margin potential
During 2017 this strategy drove an 18% increase in the user base for Reimage and DriverAgent and added 30% to CyberGhosts’ sales within four months of starting marketing, underpinning a 47% increase in continuing gross profits. 2018 has started well and we forecast continued strong revenue growth as the group scales marketing investment for its newer products. In addition, during 2018 we expect to see improved retention rates at Reimage following the group’s transition last year to a subscription model – a core driver for our forecast increase in EBIT margins from 10.5% in FY17 to 15.8% in FY20. The closure of the Web Apps division in September 2017 will continue to weigh on headline EPS growth in 2018, despite this we forecast a three year CAGR in EPS of 16%.
Valuation: Organic and acquisition potential
The B2C cyber security market is evolving rapidly to cope with the increased risk profile faced by consumers. In a competitive market, brand visibility and trust are key. While relatively small compared to large cyber security peers that offer similar product lines, Kape’s experience in user acquisition should enable it to punch above its weight. A DCF suggests the share price is starting to discount the near-term organic opportunity. However, additional acquisitions are targeted and with net cash accounting for 41% of the market cap, a deal could trigger material earnings upside. With efficient deployment of the balance sheet, we see scope for the shares to move towards 157p as opportunities convert.
Investment summary
Background: From ad tech to cyber security
This is a large and evolving market. Symantec estimates the size of the wider B2C cyber security market at $10bn and the rising dependence consumers have on their increasingly complex online footprints, paired with a poor protection record to date, makes it a market open to innovative new services, providing a supportive backdrop for growth.
Solid progress has been made in the 18 months since management unveiled Kape’s intention to transition from a pure-play advertising technology group to focus on the online distribution of cyber security products. Major events during 2017 include the acquisition of market-leading VPN CyberGhost in March 2017 for a total consideration of up to $9.8m, the recent launch of Reimage for MAC and the termination of the final licence in the Web Apps division, making 2018 the first year that the group’s results will fully reflect its new focus.
Financials: New products and transition to subscription
Our forecasts assume that the bulk of the 6% CAGR in revenues forecast over the period to FY20 comes from Kape’s newer products, supported by an increase in user acquisition marketing: Reimage for Mac, which launched in Q417, DriverAgent and CyberGhost. Since end-2017 all Kape’s products have been offered on a subscription rather than licence basis. The cost of subscriber retention is a fraction of the cost of user acquisition and, assuming recurring subscription revenues build, this should also lead to an expansion in segmental margins. With a relatively fixed cost base, which largely comprises people costs, much of this growth should flow to earnings and we forecast a near doubling of continuing EBITDA in 2018, although the termination of the final contract in the (now closed) Web Apps division will weigh on headline EPS growth this year.
Investment case: Organic and acquisition potential
■
The consumer security software market continues to be affected by the changing device landscape, as well as the increasing significance of app stores and online sales. Kape’s on-line user acquisition strategies lend should themselves well to this industry.
■
With its digital marketing expertise, Kape is well placed to capitalise on the increasing awareness of individuals to protect their privacy and security online.
■
The transition to a subscription model should improve the visibility of earnings, which until last year were largely derived on a licence basis. Depending on the rate of renewals to which this leads, it should also support a steady expansion in margins.
■
A reverse DCF indicates the current share price discounts three-year forecasts then mid-single-digit growth in revenues over the next seven years on stable EBITDA margins. However, there is little in the share price for expansion of its product range through acquisition which we view as an important catalyst; for instance if half of the groups $69.5m net cash balance was deployed and generated a similar ROI to CyberGhost, this would add c 60% to FY19 earnings.
Catalysts
■
Evidence that Kape’s marketing strategies are delivering forecast revenue growth.
■
Reimage has been sold on a subscription basis since late 2017; as the anniversary of first subscribers’ passes, Kape will have greater insight regarding customer retention and hence the margin potential of the business.
■
M&A activity.
Company description: B2C cyber security software
Kape specialises in the online distribution of consumer cyber security and digital maintenance software. The majority of sales relate to the distribution of its own products, which include PC repair and PC driver repair software and internet VPN services. At the end of 2017 across its product lines it had 887k paying users and 260 premium subscribers. It also uses its online consumer acquisition expertise and network to run third-party online media campaigns, although resources in this division are being re-allocated to support the distribution of its own products. The group is headquartered in London and has approximately 360 employees across its operations in Israel, Germany, Cyprus, Romania and Manila.
History: Ad tech foundations supports product distribution
Kape was founded in 2011. The initial focus of the group was the provision of browser extensions and advertising technology. In 2012 it was acquired by Market Connect, a company controlled by Teddy Sagi and in 2014 acquired PC repair software brand Reimage. The group listed on AIM in September 2014 raising $75m. Mr Sagi remains the controlling shareholder of Kape via Unikmind Holdings (73%). Changes to the distribution policies of the largest web-stores made the group’s early strategy to scale its advertising platform increasingly challenging. In March 2016 Kape announced its intention to close the Web Apps division and transition the group away from pure ad tech. A new CEO, Ido Erlichman, was recruited to restructure the company in May 2016 and the group has since repositioned itself as an online provider of consumer cyber security software, using its experience in digital marketing to enhance customer acquisition. Reflecting the group’s new focus, it changed its name from Crossrider to Kape Technologies in March 2018.
Management
Prior to joining Kape, Ido Erlichman held a number of technology-based roles in private equity, consulting and finance. Previous positions include the CEO of customer profiling and acquisition company VisualDNA. CFO Moran Laufer joined Kape in 2012. He was part of the team that listed the group in 2014 and was made CFO in August 2016.
Non-executive chairman Don Elgie has wide-ranging experience in public companies and over 30 years in the marketing industry. Don was the founder of digital marketing services company, Creston, which was acquired for £76m in 2016. The board has non-executive representation from David Cotterell and Martin Blair, both of whom have held senior management positions at a number of UK-listed media and technology companies.
Strategy: Increasing the lifetime value of users
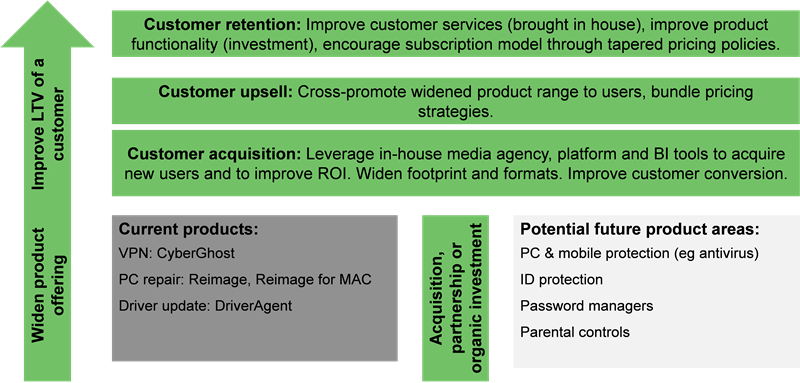
The group’s experience in distributing Reimage as well as other third party software has provided the foundations from which to expand. Using its expertise in customer acquisition, management is scaling its app distribution segment, focusing on consumer cyber security software. In parallel, it is working towards a more visible earnings base underpinned by subscription revenues. Using the following initiatives it expects to significantly increase the lifetime value (LTV) of a customer.
Expand product range: In the last two years, it has made two small acquisitions, and in March 2017 made the more significant acquisition of CyberGhost, a market-leading virtual private network (VPN), marking the group’s entry into the cyber security market. Ultimately, management envisages the creation of a digital product hub, offering a full stack of consumer security solutions.
■
In October 2016 it acquired PC driver repair brand, DriverAgent, for $1m.
■
In April 2017 it increased its holding in early-stage programmatic video technology company, Clearvelvet Trading, to 50.01% (from 16.7%). It paid $0.9m. The original stake was acquired in 2015 (for $0.9m).
■
In March 2017 it acquired CyberGhost for a maximum consideration of $9.8m.
■
In September 2017 it launched Reimage for Mac, and it is now also investing in the development of new versions of its existing products as well as adding new products to the portfolio – for instance, CyberGhost for Mac.
Leverage its experience in customer acquisition: Kape’s mobile ad network and mobile ad exchange provide the platform through which it can efficiently market and distribute its products. User acquisition strategies generally comprise a mixture of content marketing (eg sponsored blogs), display advertising through its extensive affiliate network and search optimisation.
Transition to a subscription model: Cyber Ghost derives 100% of its revenues via subscription and management is now transitioning reimage, from a licence (time limited) to subscription model. By encouraging customers to subscribe for longer, using product pricing strategies and standardised payment systems, Kape should be able to improve the quality of its revenue base as well as enhance the renewal rate of its customers.
Cross promote: Management is ultimately working towards the development of a dashboard from which customers can select a variety of services, similar to the approach taken by the larger antivirus groups. The rebranding of the group as Kape, which will be associated with all its products, is the first step towards this vision.
|
Exhibit 1: Strategy |
|
|
Source: Edison Investment Research |
App distribution
The group reports across two core divisions: App Distribution and Media although both divisions work in harmony. The resources from the Media segment play a vital role in customer acquisition for the App Distribution segment. In FY17 27% of revenues were generated from advertising and 73% from the sale of software and services.
|
Exhibit 2: Revenues FY18e |
Exhibit 3: Segment results FY18e |
|
|
|
Source: Edison Investment Research |
|
Exhibit 2: Revenues FY18e |
|
|
Source: Edison Investment Research |
|
Exhibit 3: Segment results FY18e |
|
|
Source: Edison Investment Research |
Four proprietary products
The majority of Kape’s App Distribution revenues are derived from the distribution of its four proprietary digital products: Reimage and Reimage for Mac, CyberGhost and Driver Agent. It will also distribute third-party services where there is a complement to its own, for instance it has partnered with McAfee for consumer virus protection and also sells technical support packages. Across its products it has 887k paying users and 260k subscribers worldwide. We summarise the market positions and business models for each product in Exhibit 4.
Exhibit 4: Summary product profiles
Reimage and Reimage for Mac |
CyberGhost |
DriverAgent |
|
% FY18e divisional revenue |
55% |
20% |
5% |
Technology |
Over 150m software ‘spare parts’ |
AWS API. 1,000+ servers in 45 countries. |
Repository of up to date drives |
Business model |
Freemium, licence, SaaS |
SaaS |
Freemium, licence |
Pricing (Varies depending on geography and length of subscription.) * |
12 month $39 |
One month $10.99, one year $4.99 pm, |
One year $29.95 |
Target market |
Consumer PC owners |
Users that are security aware, subject to |
Consumer PC owners |
KPIs |
c 50k subscriptions sold per month. |
1.5m active users. |
Downloaded over 50m times since release |
Market position |
Market leader. Ranked higher than its competitors by Alexa. |
Based on brand; leading position in Germany (23%), France (18%), UK (12%) |
|
Competitors |
Windows: Tune Up (AVG), Norton, Avanquest. |
ExpressVPN, Hotspot Shield, NordVPN. AVG, AVAST. |
Driver’s own software update programmes (eg Microsoft), AVG driver updater, AVIRA software updater |
Source: Edison Investment Research, Kape. *Examples based on UK rates.
PC repair and maintenance products: Reimage & DriverAgent
Kape’s largest product by revenues is Reimage, a patented (US) computer repair software programme that can detect errors and malware on a Windows operating system. It will then remove damaged files, or reverse the damage done to files by drawing on a repository of over 150m spare parts and claims to resolve 98% of customer issues. Unlike, competing products, Reimage reinstalls files without losing the data. Common fixes include general Windows errors, ‘hanging’ and damaged DLLs (Dynamic Link Library).
In September 2017 Kape launched Reimage for Mac, extending its market to a further 100m MAC users in a less competitive market. Since January 2016 Kape has also been distributing device driver software repair search and update service, DriverAgent, which it later acquired and which scans computers for outdated drivers across all Windows operating systems on desktop, mobile or tablet.
The Windows repair market is fairly mature with usage largely driven by global PC growth. However, as the volume of data being managed by PC’s continues to increase, users understanding that PC maintenance can improve system performance should also act as a catalyst for growth. Reimage competes with well-known brands such as AVG and Norton, as well as with free alternatives. Kape’s expertise in online customer acquisition is instrumental in negotiating this competitive market. Trust is important in this environment and Kape continues to work to elevate the brand’s profile online. Market share gains driven by increased marketing, as well as the launch of Reimage for Mac, provide scope for continued growth.
Leading consumer virtual private network (VPN): CyberGhost
A VPN extends a private network securely, as if the networks were directly linked. In doing so, it masks an IP address to all but the communicating parties. It will also encrypt the data being transported meaning that both the communication between users, and the identity of the users is private. These qualities mean that in the consumer market, VPN’s are used to either:
■
Wi-Fi privacy, for instance to protect against hacking on unsecured public networks, or to avoid unwanted adware or spyware.
Conceal the physical location of the user for instance to allow access geo-blocked services (such as Netflix) or to bypass censorship in restrictive regimes. The total VPN market is valued at $53.4bn in 2016 and forecast to grow on average by 12% a year to 2022 (source: ICRWorld). Carving out the consumer segment is not possible as most providers are part of larger organisations and the market remains fragmented.
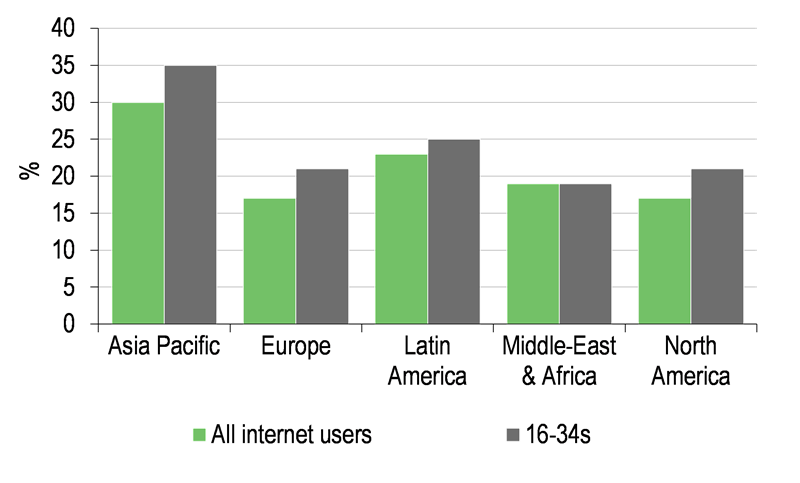
With the increase in mobile internet access and cloud storage, the take-up of consumer VPN services is expected to replicate that seen in the enterprise to become a mass market proposition. A recent report by Wombat support the view that awareness regarding the importance of VPNs is increasing – particularly in the US where 41% of respondents to its survey had installed a VPN on a personal lap top (compared to 23% in the UK). Management considers its target market to be 1.6 billion internet users who are either affected by censorship (600 million), are already security aware as they have an antivirus subscription (800 million), or are expatriates (200 million).
CyberGhost’s subscriber base is largely in the US and Europe and is marketed primarily as an on-line privacy tool. On most comparison sites, CyberGhost ranks among the top five VPNs in western Europe and top 10 in the US (source: techradar) and over the two years December 2017, paying subscribers increased from 102k to 187k. Growth has been entirely organic; the introduction of user acquisition marketing is enabling Kape to accelerate this already strong growth.
|
Exhibit 5: Motivation – consumer VPN uptake |
Exhibit 6: Regional VPN usage |
|
|
|
Source: Statista Feb 2016 (Global Web Index) |
Source: Global Web Index |
|
Exhibit 5: Motivation – consumer VPN uptake |
|
|
Source: Statista Feb 2016 (Global Web Index) |
|
Exhibit 6: Regional VPN usage |
|
|
Source: Global Web Index |
Media: Supporting app distribution
The media division comprises Kape’s advertising technology and analytics platform, and its mobile media ad network. Profitable demand generation can only be done programmatically with access to vast amounts of historical data, a wide affiliate network and sophisticated BI systems to optimise media buying. Previously the focus of the group, the division is now largely run to support customer acquisition for the group’s own products and services.
Marketing strategies typically combine content marketing (eg review websites) and programmatic media buying (display advertising and Google SEO).
Business model: Transitioning to a subscription model
Both Reimage and DriverAgent operate on a freemium basis; consumers can first use the software for free to identify if there is an issue and then pay to use it to fix any issues identified. Sales were made on a licence basis until September 2017, after which time all new product sales have been made on a subscription basis.
Segment results (which we take as a proxy for gross profit) capture the cost of user acquisition (UAC), which is approximately 30% of sales, payment processing and server costs. Segmental margin can be affected by a number of factors, including the experience of its algorithms and the quality of data feeding them.
Moving to a subscription model should help the group improve customer retention rates as it enables automatic renewal at the end of a subscription period. This should help the group to bring down average user acquisition costs over time and is a key part of the strategy to increase the LTV of a user. CyberGhost has always been sold on a subscription basis, which means that, entering 2018, Kape has approximately $8m of revenues that are generated from existing users and in 2018 expects c 25% of total revenues to be recurring in nature.
Track record: Encouraging start
Kape’s early track record is promising:
■
Reimage was originally a B2B product, targeted largely at computer technicians. Using Kape’s marketing platform, Reimage expanded into the B2C space, revenues have more than doubled and segmental profits have tripled over the three years to 2017. Since introducing a subscription option in September 2017, 50% of new users are taking it up.
■
In the six months after starting to promote DriverAgent, revenues increased by 175% (from a small base).
■
Within one year of acquiring CyberGhost, approximately 50% of new revenues resulted from introducing user acquisition marketing.
Consumer cyber security – growth drivers
Consumers continue to increase their reliance on the internet in their daily lives, across a more complex device and threat landscape. Despite this, the endpoint consumer security software market, which was worth $4.6bn in 2017 (source: F-Secure), is expected to grow by only 1.6% a year to 2021. Protection to date has largely been confined to basic antivirus products and email gateway services. Growth in these markets has been affected by the shift of consumer buying patterns to online purchases and the emergence of freemium business models. However, as homes and families become more connected, and as the stakes of breach increase, demands are expanding beyond basic antivirus protections, and a more holistic approach by consumers may be required. An October 2017 poll by Gallup, showed that consumers worry approximately twice as often about digital crimes such as identity theft and online financial hacking compared to physical crimes such as car theft, home burglary and terrorism.
We expect to see stronger growth from complementary protection tools such as VPN’s, password managers, identity management tools and parental controls. Symantec estimates the wider ‘personal digital safety’ market to be double the size of traditional products at c $10bn. It is in this wider market that Kape is positioning itself.
Identity theft: the frequency and scale of data breaches targeting individuals personally identifiable information (PII) continues to increase. The Equifax breach in 2017 in particular serves to demonstrate the increased risk to individuals. According to Juniper, 2.8bn identity records were breached in 2017, up from 1.1bn in 2016, and it is estimated that there are now c 9bn records available on the dark web for sale, feeding an active market in ID theft. The annual cost of consumer identity fraud runs into the tens of billions of dollars.
Privacy: privacy has become a major worry for consumers uneasy with sharing their data for targeting purposes, or concerned about the exposure of children to inappropriate content or fake news. Regulation has already been put in place in recognition of the need for individuals to start managing their digital footprints more actively: The ‘right to be forgotten legislation’, which was passed into law in 2015, and GDPR, which will be in force from May this year, gives more control to internet users over what information exists about them on the web.
IoT and connected homes: users now connect multiple times a day, through a multitude of interconnected devices. The average home has more than three devices connecting to the internet (source: Symantec), and the increased use of IoT services (cloud storage, smart speakers etc) continues to increase consumer dependence on digital assets. F-Secure predicts that there will be over 20bn gadgets in use by consumers by 2020 (a 10-fold increase over 2010).
Complexity: users today navigate an ever-increasing number of browsers, plug-ins, websites, and desktop, laptop and mobile applications. Now, in addition to managing software applications and data on their devices, users also manage data in the cloud.
|
Exhibit 7: US perception of personal information security online 2017 |
Exhibit 8: Identity theft data breaches worldwide |
|
|
|
Source: Statista survey (1,020 respondents) |
Source: Gemalto (September 2017) |
|
Exhibit 7: US perception of personal information security online 2017 |
|
|
Source: Statista survey (1,020 respondents) |
|
Exhibit 8: Identity theft data breaches worldwide |
|
|
Source: Gemalto (September 2017) |
Many freemium vendors offer point solutions that do not address the full set of problems users face. The larger antivirus groups (eg McAfee, Symantec, F-Secure, Avast) offer more comprehensive bundles of privacy and security solutions. In this competitive market, the importance of online distribution creates an opportunity for innovative online security products to take share. While relatively small compared to large antivirus peers that offer similar product lines to Kape, its experience in user acquisition should enable it to punch above its weight. However, there is still work to be done to build out its product range and brand recognition.
|
Exhibit 9: Personal digital safety tools |
|
|
Source: Edison Investment Research |
Financial performance
Historic snapshot: Restructuring of the group
Headline revenues and EBITDA in FY15 and FY16 reflect the group’s transition, peaking in 2015 before the 2016 restructuring of the Web Apps division and the termination of two large (but low-margin) media contracts. Over this same period, revenues from the core app distribution segment increased from $37.2m in 2015 to $48.2m in 2017.
The web apps business was written down to zero ($9.1m written down) in 2015 and the media business impaired in 2016 (by $4.7m), which is substantially the reason for the reduction in net assets over the period. Kape also returned $6.1m through a share buyback to shareholders over the period and at its FY17 results announced its intention to pay a $7m special dividend during 2018.
|
Exhibit 10: Historic KPIs |
Exhibit 11: Net assets |
|
|
|
Source: Kape, Edison Investment Research |
|
Exhibit 10: Historic KPIs |
|
|
Source: Kape, Edison Investment Research |
|
Exhibit 11: Net assets |
|
|
Source: Kape, Edison Investment Research |
FY17 results: Return to growth, special dividend
The final contract in the web licensing division ended in September in 2017 and we consider it more appropriate to analyse the FY17 segmental results on a continuing basis.
Continuing revenues increased by 23% to $66.4m and the segmental margin increased 6pp to 34%, resulting in a 47% increase in segmental profits. This growth reflects the impact of the acquisitions, together with improved efficiency of the customer acquisition platform.
Adjusted EBITDA increased by 29% to $8.3m. The strong segmental performance was offset in part by the closure of the Web Apps division ($2.1m impact). EBITDA also benefited to the tune of $1.3m as a result of the adoption of IFRS 15, which provides for user acquisition marketing costs related to subscription services (SAC) to be capitalised and amortised over the user’s expected life – although this is offset by a similar increase in deferred revenues meaning the overall impact to the move to IFRS15 was broadly neutral.
Normalised EPS increased by 69% to 4.9c and reported EPS was a loss of 2.4c. This divergence is due to the recognition of $9.4m of exceptional items related to the accelerated repurchase of the CyberGhost founder’s share options ($3.5m), restructuring ($0.9m) and the amortisation of acquired intangibles ($5.1m). The board is also proposing the payment of a one-off $7m special dividend (5c per share).
Segmental performance: Strong growth from App Distribution
App Distribution revenues increased by 26% and segmental profit by 53%. We estimate that approximately 18% of revenue growth is due to the consolidation of CyberGhost (from March 2017) and a full year contribution for Driver Agent (October 2016). The balance of growth and margin increase flows from improvements in the user acquisition processes and traffic quality, which has resulted in better conversion rates and a decrease in average user acquisition costs.
Kape has consolidated Clearvelvet since April 2017. This acquisition was the main reason for the 14.5% growth in revenues from the Media division, compensating for the ongoing de-emphasis of third-party revenues. We summarise the FY17 results, together with our forecasts in Exhibit 14.
|
Exhibit 12: Segmental revenues |
Exhibit 13: Segmental results |
|
|
|
Source: Kape (historicals), Edison Investment Research (forecasts) |
|
Exhibit 12: Segmental revenues |
|
|
Source: Kape (historicals), Edison Investment Research (forecasts) |
|
Exhibit 13: Segmental results |
|
|
Source: Kape (historicals), Edison Investment Research (forecasts) |
Exhibit 14: Summary results and forecasts
$000s |
2016 |
2017 |
2018e |
2019e |
2020e |
Revenues |
|||||
App distribution |
38,241 |
48,226 |
59,478 |
65,682 |
69,991 |
Media |
13,783 |
15,781 |
13,414 |
11,402 |
9,692 |
Web Apps |
4,508 |
2,376 |
- |
- |
- |
Total revenues |
56,532 |
66,383 |
72,892 |
77,084 |
79,683 |
Total revenue growth |
(21%) |
17% |
10% |
6% |
3% |
Continuing revenue growth |
(10%) |
23% |
14% |
6% |
3% |
Segment result |
|||||
App distribution |
11,267 |
17,206 |
24,244 |
29,079 |
32,458 |
Media |
3,480 |
4,464 |
3,622 |
3,078 |
2,520 |
Web Apps |
4,508 |
2,376 |
- |
- |
- |
Total segment result |
19,255 |
24,046 |
27,866 |
32,158 |
34,978 |
Segment margin |
|||||
App distribution |
29% |
36% |
43% |
51% |
55% |
Media |
25% |
28% |
27% |
27% |
26% |
Web Apps |
100% |
100% |
|||
Total segmental margin |
34% |
36% |
38% |
42% |
44% |
Continuing segmental margin |
28% |
34% |
38% |
42% |
44% |
EBITDA |
6,413 |
8,261 |
10,341 |
13,249 |
14,639 |
EBITDA margin |
11.3% |
12.4% |
14.2% |
17.2% |
18.4% |
Adjusted EBITA |
5,034 |
6,946 |
8,891 |
11,499 |
12,619 |
Adjusted PBT |
4,753 |
7,509 |
8,919 |
11,544 |
12,802 |
Cash flow |
2016 |
2017 |
2018e |
2019e |
2020e |
EBITDA |
6,413 |
8,261 |
10,341 |
13,249 |
14,639 |
Cash exceptionals |
(862) |
(899) |
0 |
0 |
0 |
Changes in working capital |
613 |
(1,392) |
112 |
(1,147) |
(1,528) |
Interest |
(281) |
156 |
28 |
45 |
184 |
Cash tax |
(904) |
(109) |
(1,003) |
(1,383) |
(1,596) |
Other / FX |
39 |
275 |
0 |
0 |
0 |
Operating cash flow |
5,018 |
6,292 |
9,477 |
10,764 |
11,698 |
EBITDA/operating cash conversion |
78% |
76% |
92% |
81% |
80% |
Total capital expenditure |
(1,678) |
(2,020) |
(2,088) |
(2,192) |
(2,302) |
Acquisitions |
(1,439) |
(5,337) |
(870) |
(870) |
0 |
Share repurchase/ issue |
(995) |
(1,477) |
0 |
0 |
0 |
FX/ other/ dividend |
(178) |
(20) |
(7,000) |
0 |
0 |
Net cash flow |
728 |
(2,562) |
(480) |
7,702 |
9,396 |
Closing net cash |
72,064 |
69,502 |
69,022 |
76,724 |
86,120 |
Source: Kape (historic), Edison (forecast)
Initiating forecasts: Revenue and margin growth combine
2018 will be the first year that financials fully reflect the group’s transformation.
Based on Kape’s recent track record, we see the potential for both strong revenue growth and margin expansion from the App Distribution segment. This should more than compensate for our forecast 15% y-o-y decline in third-party media revenues as the group scales back investment in this segment. Despite the fact that FY18 earnings growth will still be affected by the overhang of the closure of the Web Apps division in September 2018, we forecast a CAGR in EPS of 16%.
We base our forecasts on the following assumptions:
Strong revenue growth from widened product range: Kape has demonstrated its ability to accelerate the growth of its product portfolio using its User Acquisition platform. Our forecasts are based on the assumption that while the Windows Reimage product is at a fairly mature stage of development (we forecast mid-single digit growth), it can successfully scale Reimage for Mac and DriverAgent. We also forecast a continued strong organic growth rate for CyberGhost, boosted by the growing use of user acquisition (UA) marketing.
Increase in segmental margins: margins will be affected by three factors. Based on the following, we believe segmental margins have the potential to expand from 34% in FY17 (on a continuing basis) to 40% in FY18 and to 51% by 2020:
■
the efficiency of the platform which, up to a point, could improve over time as the algorithms are trained or new marketing partners added;
■
the pace at which Kape can migrate its customer base to a subscription model. In the longer term, this will be determined by the quality of the products. While CyberGhost’s retention rates are 69%, for Re-image, which lends itself less to repeat usage, due to the lack of historical renewal data we have assumed a 40% retention rate. On this basis, we forecast subscription revenues increase to represent 70% of total revenues by 2020, with a retention rate of 40%; and
■
IFRS 15 provides for subscriber acquisition costs to be capitalised. As a larger share of revenues are derived from subscription revenues, this will consequently lead to a smaller share of marketing costs being recognised in segmental profit.
Operational gearing: operating expenses predominantly relate to the amortisation of subscriber acquisition costs (SAC) and headcount. Kape has 127 employees across marketing, engineering and its central functions. The products also come with 24/7 support, and expenses include the cost of the 232 employees in Manila. We assume an additional 35 employees are recruited over the period and forecast the growth in segmental profits to largely flow through to EBITDA.
In 2018, this means that, despite the impact of the closure of the Web Apps division (3pp hit to segmental margins) and the scaling back of the Media segment, we forecast EBITDA margins to increase to 14.2%. By FY20 we believe the group has the potential to achieve an 18.4% EBITDA margin.
Low tax regime: Reimage falls within the Isle of Man tax regime (0%) and CyberGhost in Romania (16%). The FY17 effective tax rate was 7.0% but, with CyberGhost forecast to account for a growing share of EBITDA, we forecast the effective tax rate to increase to 11.3% in FY18.
Strong balance sheet and cash conversion
Kape reported net cash of $69.5m at December 2017. Adjusting for non-recurring cash items, FY17 cash conversion was 92%.
For the app distribution business, working capital requirements are fairly low, with licence sales and marketing costs recognised on payment and received within two weeks from the payment processors. The media segment has a longer receivables cycle, but as this segment is scaled back we would expect working capital to fall alongside it. Working capital will be largely determined by the unwinding of the capitalised marketing costs, net in part with an increase in deferred revenues. Capital expenditure relates largely to R&D and fixed assets, and we forecast it to continue at approximately 2.5% of revenues.
Of the potential maximum consideration of $9.8m to be paid for CyberGhost, the initial $3.3m cash was paid on closing. In November 2017 Kape repurchased 3.8m of the 4.4m share options granted to CyberGhost’s founder for a total consideration of $3.8m; $1.9m was paid in the year and the rest will be paid in eight equal quarterly instalments. A further $1.9m was also prepaid relating to the deferred earnout consideration (capped at $3.2m).
After these payments, and the $7m special dividend, we forecast net cash to remain broadly stable in FY18.
Valuation
Kape’s value hinges on two main factors:
■
its ability to increase the lifetime value of its users, while also improving the efficiency of its customer acquisition strategies; and
■
deployment of its balance sheet and astute expansion of its product range through acquisition.
Although still early in the execution of its strategy, good progress was made during 2017. While the shares, which have increased c 50% since the full year results in March, are starting to recognise the momentum of the business, they are yet to reflect the longer term margin opportunity, or the effective utilisation of the group’s balance sheet. We estimate that one medium sized acquisition could provide the catalyst to take the shares above 157p.
DCF: Longer-term margin potential
A reverse DCF indicates that the shares discounting c 7% growth in revenues over the next ten years and EBITDA margin expansion in line with our forecast to peak at 18.4% by 2020 (Exhibit 16). For this analysis we assume a 10.0% WACC, 3% perpetuity growth and an effective tax rate of 14% (Exhibit 15).
Exhibit 15: DCF sensitivities
Terminal growth rate |
Average revenue growth FY20-27 |
|||||||||||||
1.0% |
2.0% |
3.0% |
4.0% |
5.0% |
3.0% |
5.0% |
7.0% |
9.0% |
11.0% |
|||||
WACC |
12.0% |
93 |
95 |
99 |
103 |
108 |
EBITDA margin |
25.0% |
129 |
138 |
149 |
161 |
174 |
|
11.5% |
96 |
99 |
103 |
107 |
114 |
22.5% |
119 |
128 |
137 |
148 |
160 |
|||
11.0% |
99 |
103 |
107 |
113 |
120 |
20.0% |
110 |
117 |
126 |
135 |
145 |
|||
10.5% |
103 |
107 |
112 |
119 |
128 |
18.5% |
104 |
111 |
119 |
127 |
136 |
|||
10.0% |
107 |
112 |
119 |
126 |
137 |
16.0% |
95 |
101 |
107 |
113 |
121 |
|||
9.5% |
112 |
117 |
125 |
135 |
149 |
13.5% |
86 |
90 |
95 |
100 |
106 |
|||
9.0% |
117 |
124 |
132 |
145 |
163 |
12.0% |
80 |
84 |
88 |
92 |
97 |
|||
8.5% |
123 |
131 |
142 |
157 |
182 |
11.0% |
76 |
80 |
83 |
87 |
91 |
|||
8.0% |
130 |
139 |
153 |
173 |
207 |
10.0% |
73 |
75 |
78 |
82 |
85 |
|||
7.5% |
138 |
149 |
166 |
193 |
241 |
|||||||||
Source: Edison Investment Research
While this suggest that the shares are starting to reflect the near term opportunity, peer analysis suggest Kape’s business model could support a higher EBITDA margin. If we assume that margins can reach 25% for instance (by 2023), with revenue growth of c 7% a year, this would return a DCF of 149p.
Benchmarking margin potential: Room for expansion
Other B2C cyber security groups, report significantly higher EBITDA margins than Kape – while these groups are significantly larger, it demonstrates the longer term potential should the group scale as it plans. Symantec ($13bn market cap), which has both corporate and consumer security products and services. In Q317 it reported operating margins in the consumer segment of 50%, compared to only 8% for the enterprise segment. Avast ($2.8bn market cap), which is largely B2C, reports an adjusted FY17 EBITDA margin of c 50%. F-Secure ($0.7bn market cap) reported EBITDA margins of 10% in FY17, although it does not break out its consumer segment separately.
M&A: A key catalyst
Management has made it clear that acquisitions will form a fundamental part of delivering its strategy. DCF, while a useful sense check to the valuation does not capture this important part of the strategy.
With $69.5m of net cash on the balance sheet at the end of 2017 (32% of Kape’s current market capitalisation), a deal is highly likely to be earnings accretive. Given the under-utilised balance sheet, we would expect multiples to be at the top end of its peer group. However, despite the strong performance following the group’s full year results in March, as shown in Exhibit 16, EV/EBIT and P/E multiples remain below those of its peers. For peer comparisons we have looked at companies that either operate in the B2C cyber security space (e.g. Symantec, F-Secure) and B2B cyber security companies. There is a very wide range in the B2C cyber security peer set, which contains only two companies (Symantec and F-Secure). For this reason, and to reflect Kape’s smaller scale, we also benchmark Kape’s valuation against the average UK software multiples.
Recent B2C cyber security transactions include:
■
Symantec acquired LifeLock in 2017 for $2.3bn, 3.5x revenues, 27x EBITDA.
■
Avast acquired AVG (antivirus) in 2016 for $1.6bn, EV/Sales multiple of 3.2x, 11.1x EV/EBIT.
■
In 2017, Avast acquired Piriform, which develops PC cleaning and optimisation software for PCs and mobiles for $121.4m, an FY17 EBITDA multiple of 14.1x.
■
TPG acquired McAfee in 2016 for $4.2bn.
Exhibit 16: Peer multiples
Name |
Sales Gth (%) |
EBITDA margin (%) |
EBIT margin (%) |
EV/Sales (x) |
EV/EBITDA (x) |
EV/EBIT (x) |
P/E (x) |
||||||||
1FY |
1FY |
1FY |
1FY |
2FY |
3FY |
1FY |
2FY |
3FY |
1FY |
2FY |
3FY |
1FY |
2FY |
3FY |
|
Kape |
13.5 |
13.5 |
11.4 |
2.2 |
2.1 |
2.0 |
15.6 |
12.2 |
11.0 |
18.2 |
14.0 |
12.8 |
21.8 |
17.1 |
15.5 |
Symantec |
(0.4) |
41.8 |
31.0 |
3.3 |
3.2 |
3.1 |
8.0 |
7.3 |
7.2 |
10.8 |
10.0 |
9.4 |
13.7 |
12.0 |
11.3 |
F-Secure |
7.4 |
9.7 |
6.3 |
2.9 |
2.7 |
2.4 |
29.6 |
20.8 |
16.6 |
46.0 |
28.1 |
21.2 |
70.3 |
39.4 |
31.4 |
B2C cyber security average |
3.5 |
25.7 |
18.6 |
3.1 |
2.9 |
2.8 |
18.9 |
14.6 |
12.5 |
28.8 |
20.1 |
16.3 |
43.3 |
27.5 |
23.2 |
B2B cyber security average |
14.3 |
25.0 |
23.2 |
5.2 |
4.6 |
4.2 |
22.4 |
22.1 |
16.0 |
26.4 |
21.9 |
18.5 |
41.7 |
34.2 |
34.1 |
UK software average |
22.0 |
22.6 |
19.3 |
3.1 |
2.9 |
2.5 |
13.9 |
12.2 |
10.7 |
17.3 |
15.4 |
12.6 |
26.0 |
21.8 |
18.6 |
Source: Bloomberg, Edison Investment Research. Note: FY signifies forecast year. Prices as at 13 June 2018.
Valuing cash – points to share price of c 157p on peer multiples
At its full year results presentation management indicated that it hopes to be able to announce at least one acquisition this year. The CyberGhost acquisition added $1.5m of net profit last year ( $2m annualised), implying a ROIC of 20%.
If we assume approximately half of the FY17 year-end net cash is used for acquisitions, and a similar 20% ROIC, this could add as much as 60% to our FY19 forecast Earnings. Applying a UK software peer PE multiple on this basis point to a valuation for the group of 157p (Exhibit 17).
Exhibit 17: Potential value impact of effectively deploying excess cash
ROCE |
10% |
15% |
20% |
25% |
Excess cash |
30 |
30 |
30 |
30 |
post-tax earnings potential |
3.0 |
4.5 |
6.0 |
7.5 |
Incremental EPS |
2.0 |
3.1 |
4.1 |
5.1 |
FY19e EPS |
6.9 |
6.9 |
6.9 |
6.9 |
Pro-forma FY19 EPS |
8.9 |
9.9 |
11.0 |
12.0 |
UK Software peer P/E |
20 |
20 |
20 |
20 |
Implied per share value (cent) |
178.4 |
198.9 |
219.4 |
239.8 |
Exchange rate $:£ |
1.4 |
1.4 |
1.4 |
1.4 |
Implied per share value (pence) |
127 |
142 |
157 |
171 |
Source: Edison Investment Research
Sensitivities
Our forecasts and the share price will be sensitive to the following factors:
■
Kape’s competitors include a number of large-scale cyber security vendors. A change in their strategy, or more aggressive marketing policy could affect Kape’s ability to profitably grow.
■
Treasury shares: We assume Kape’s 6.7m treasury shares are cancelled.
■
FX: the majority of revenues are derived in dollars and Kape reports in dollars. However, its cost base is largely outside the US and its share price is in sterling. Currency movements against the dollar could affect forecasts and the valuation.
■
In our forecasts we assume that resources in the Media division are redirected away from the promotion of third party products towards its own products and services. The pace of decline in third party business may differ from our forecasts.
■
The pace at which Kape transitions to a subscription model and subscriber retention rates may differ from our forecasts.
■
Product concentration: The majority of revenues are derived from just two products. Should one of them be rendered uncompetitive due to technology advances or aggressive pricing, sales could be significantly impacted.
■
On 21 March 2018, the European Commission published new proposals for Council Directives for taxation of digital businesses. One of these (Directive (COM(2018)147) will allow a member state to tax digital businesses, regardless of physical presence, by extending the meaning of ‘permanent establishment’ to include a ‘significant digital presence’ in that member state. Such a presence exists if certain digital services are supplied to users there through a digital interface and those services exceed certain thresholds. Profits will be attributed to such a presence according to the ‘economically significant activities’ performed by such a presence. The proposed directive will apply to entities regardless of their tax residence, and so could affect Kape’s effective tax rate if it is passed.
Exhibit 18: Financial summary
$'k |
2015 |
2016 |
2017 |
2018e |
2019e |
2020e |
||
31-December |
IFRS |
IFRS |
IFRS |
IFRS |
IFRS |
IFRS |
||
INCOME STATEMENT |
||||||||
Revenue |
|
|
84,635 |
56,532 |
66,383 |
72,892 |
77,084 |
79,683 |
Cost of Sales |
(58,111) |
(37,277) |
(42,366) |
(45,026) |
(44,926) |
(44,705) |
||
Gross Profit |
26,524 |
19,255 |
24,017 |
27,866 |
32,158 |
34,978 |
||
EBITDA |
|
|
10,064 |
6,413 |
8,261 |
10,341 |
13,249 |
14,639 |
Normalised operating profit |
|
|
9,016 |
5,034 |
6,946 |
8,891 |
11,499 |
12,619 |
Amortisation of acquired intangibles |
(8,322) |
(8,505) |
(5,130) |
(700) |
(700) |
(700) |
||
Exceptionals |
(11,089) |
(5,545) |
(899) |
0 |
0 |
0 |
||
Share-based payments |
(3,407) |
(716) |
(3,516) |
(500) |
(600) |
(700) |
||
Reported operating profit |
(13,802) |
(9,732) |
(2,599) |
7,691 |
10,199 |
11,219 |
||
Net Interest |
(855) |
(328) |
(255) |
28 |
45 |
184 |
||
Joint ventures & associates (post tax) |
(38) |
47 |
(40) |
0 |
0 |
0 |
||
Exceptionals |
0 |
0 |
858 |
0 |
0 |
0 |
||
Profit Before Tax (norm) |
|
|
8,123 |
4,753 |
7,509 |
8,919 |
11,544 |
12,802 |
Profit Before Tax (reported) |
|
|
(14,695) |
(10,013) |
(2,036) |
7,719 |
10,244 |
11,402 |
Reported tax |
(2,902) |
(665) |
(467) |
(1,003) |
(1,383) |
(1,596) |
||
Profit After Tax (norm) |
7,421 |
4,088 |
7,042 |
7,915 |
10,161 |
11,206 |
||
Profit After Tax (reported) |
(17,597) |
(10,678) |
(2,503) |
6,715 |
8,861 |
9,806 |
||
Minority interests |
0 |
0 |
0 |
(80) |
(80) |
(80) |
||
Discontinued operations |
0 |
0 |
0 |
0 |
0 |
0 |
||
Net income (normalised) |
7,421 |
4,088 |
7,042 |
7,835 |
10,081 |
11,127 |
||
Net income (reported) |
(17,597) |
(10,678) |
(2,503) |
6,635 |
8,781 |
9,726 |
||
Basic average number of shares outstanding (m) |
148 |
141 |
142 |
142 |
143 |
144 |
||
EPS - basic normalised (c) |
|
|
5.02 |
2.90 |
4.98 |
5.51 |
7.05 |
7.74 |
EPS - diluted normalised (c) |
|
|
5.02 |
2.90 |
4.85 |
5.37 |
6.88 |
7.55 |
EPS - basic reported (c) |
|
|
(11.91) |
(7.57) |
(1.77) |
4.67 |
6.14 |
6.77 |
Dividend (c) |
0.00 |
0.00 |
4.93 |
0.00 |
0.00 |
0.00 |
||
Revenue growth (%) |
19.0 |
(-33.2) |
17.4 |
9.8 |
5.8 |
3.4 |
||
Gross Margin (%) |
31.3 |
34.1 |
36.2 |
38.2 |
41.7 |
43.9 |
||
EBITDA Margin (%) |
11.9 |
11.3 |
12.4 |
14.2 |
17.2 |
18.4 |
||
Normalised Operating Margin |
10.7 |
8.9 |
10.5 |
12.2 |
14.9 |
15.8 |
||
BALANCE SHEET |
||||||||
Fixed Assets |
|
|
21,785 |
8,729 |
13,312 |
13,250 |
12,992 |
12,573 |
Intangible Assets |
19,254 |
7,113 |
12,350 |
12,200 |
11,878 |
11,386 |
||
Tangible Assets |
1,003 |
591 |
815 |
903 |
967 |
1,040 |
||
Investments & other |
1,528 |
1,025 |
147 |
147 |
147 |
147 |
||
Current Assets |
|
|
87,616 |
80,014 |
82,430 |
84,384 |
94,329 |
105,515 |
Stocks |
0 |
0 |
65 |
65 |
65 |
65 |
||
Debtors |
16,280 |
7,950 |
11,071 |
9,985 |
9,250 |
8,765 |
||
Cash & cash equivalents |
71,336 |
72,064 |
69,502 |
69,022 |
76,724 |
86,120 |
||
Other |
0 |
0 |
1,792 |
5,312 |
8,290 |
10,565 |
||
Current Liabilities |
|
|
(16,721) |
(7,339) |
(15,028) |
(16,704) |
(17,924) |
(18,185) |
Creditors |
(15,316) |
(7,096) |
(10,094) |
(10,695) |
(10,154) |
(9,628) |
||
Tax and social security |
0 |
0 |
0 |
0 |
0 |
0 |
||
Short term borrowings |
0 |
0 |
0 |
0 |
0 |
0 |
||
Other |
(1,405) |
(243) |
(4,934) |
(6,009) |
(7,770) |
(8,557) |
||
Long Term Liabilities |
|
|
(1,170) |
(851) |
(1,342) |
(1,342) |
(349) |
(349) |
Long term borrowings |
0 |
0 |
0 |
0 |
0 |
0 |
||
Other long term liabilities |
(1,170) |
(851) |
(1,342) |
(1,342) |
(349) |
(349) |
||
Net Assets |
|
|
91,510 |
80,553 |
79,372 |
79,587 |
89,048 |
99,554 |
Minority interests |
0 |
0 |
977 |
977 |
977 |
977 |
||
Shareholders' equity |
|
|
91,510 |
80,553 |
80,349 |
80,564 |
90,025 |
100,531 |
CASH FLOW |
||||||||
Op Cash Flow before WC and tax |
10,064 |
6,413 |
8,261 |
10,341 |
13,249 |
14,639 |
||
Working capital |
(2,197) |
613 |
(1,392) |
112 |
(1,147) |
(1,528) |
||
Exceptional & other |
(1,297) |
(823) |
(624) |
0 |
0 |
0 |
||
Tax |
(1,826) |
(904) |
(109) |
(1,003) |
(1,383) |
(1,596) |
||
Net operating cash flow |
|
|
4,744 |
5,299 |
6,136 |
9,450 |
10,719 |
11,514 |
Capex |
(1,813) |
(1,678) |
(2,020) |
(2,088) |
(2,192) |
(2,302) |
||
Acquisitions/disposals |
(1,402) |
(1,439) |
(5,337) |
(870) |
(870) |
0 |
||
Net interest |
(660) |
(281) |
156 |
28 |
45 |
184 |
||
Equity financing |
(5,131) |
(995) |
(1,477) |
0 |
0 |
0 |
||
Dividends |
0 |
0 |
0 |
(7,000) |
0 |
0 |
||
Other |
0 |
0 |
0 |
0 |
0 |
0 |
||
Net Cash Flow |
(4,262) |
906 |
(2,542) |
(480) |
7,702 |
9,396 |
||
Opening net debt/(cash) |
|
|
(76,041) |
(71,336) |
(72,064) |
(69,502) |
(69,022) |
(76,724) |
FX |
(443) |
(178) |
(20) |
0 |
0 |
0 |
||
Other non-cash movements |
0 |
0 |
0 |
0 |
0 |
0 |
||
Closing net debt/(cash) |
|
|
(71,336) |
(72,064) |
(69,502) |
(69,022) |
(76,724) |
(86,120) |
Source: Company accounts, Edison Investment Research
|
|||||||||||||||||||||||||||||||||||||||||
|
|
Research: TMT
1Spatial recently held its first capital markets day for a number of years. We see this as a positive signal that, following a substantial transformation programme, management is confident in its strategy and prospects. The recovery programme has been based on three fundamental principles – get the strategy right, assemble a strong team and build closer customer relationships. The capital markets day indicated that the company has made good progress on all three fronts.