UDG Healthcare
UDG Healthcare |
Updating estimates on H116, FX moves |
Valuation update |
Healthcare equipment & services |
21 July 2016 |
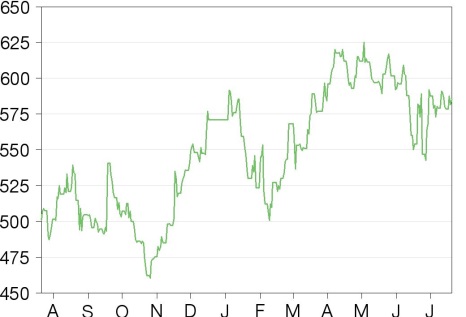
Share price performance
Business description
Next events
Analyst
UDG Healthcare is a research client of Edison Investment Research Limited |
|||||||||||||||||||||||||||||||||||||||||||||||
We are updating our forecasts for UDG on the back of solid H116 results, the completion of the sale of the drug distribution business and recent pronounced currency moves. While providing a sufficient cash cushion in the current volatile market conditions, the divestment will allow increased flexibility for the company to deliver on its already successful track record of acquisitions. We raise our DCF valuation from £5.21 to £6.45/share.
Year |
Revenue (€m) |
EBITDA |
EPS* |
DPS |
P/E |
Yield |
09/14 |
764.2 |
97.7 |
23.2 |
10.1 |
30.3 |
1.4 |
09/15 |
919.3 |
126.1 |
27.4 |
11.0 |
25.6 |
1.6 |
09/16e |
974.9 |
128.8 |
28.6 |
11.5 |
24.5 |
1.6 |
09/17e |
1,020.2 |
134.6 |
31.1 |
12.5 |
22.6 |
1.8 |
Note: EPS for the period is normalised, excluding amortisation of acquired intangibles, exceptional items and share-based payments, and fully diluted
Solid H116 performance supported by currencies
UDG reported encouraging H116 results, with both Ashfield and Sharp Packaging divisions delivering solid underlying earnings growth supported by positive FX moves. Ashfield’s H116 revenue and operating profit were up 3% and 7%, leading to a 0.4pp margin expansion to 9.6%. While the division’s UK revenue slid 2% in local currency terms (assuming all in £), its operating margin improved to 12.5% (vs 11.4% in H115) against the backdrop of an 8% increase in underlying operating profit. By contrast, Ashfield’s North America revenue and operating profit fell 2% and 10% in dollar terms (although EBIT was up 15% when adjusted for the sale of Speaker Bureau in 2015). Most notably, Sharp’s US revenue grew 28% y-o-y (18% in dollar terms), while operating profit jumped 38% (27% in $) and margin reached 15.2% (vs 14.2% in H115). Sharp’s overall operating profit was up 25% y-o-y in constant currency terms, while the margin came in at 12.2%, up 1.6pp on H115.
Favourable US market conditions, adverse FX moves
UDG’s H116 results were to a large extent driven by Sharp’s US business, which continued to benefit from strong market demand and high utilisation rates. We expect this performance to be sustained in H216 and 2017 as an incremental 30% increase in US capacity comes on stream, allowing the company to capitalise on favourable market conditions. That said, the recent pronounced currency moves, with sterling weakening against the euro, will adversely affect results in H216, partly offsetting the US strength. On an underlying basis, though, we believe that UDG is well positioned to benefit from an increasing industry trend towards outsourcing.
Valuation: Upgrading on H116 results, lower WACC
We increase our DCF-derived valuation of UDG from £5.21/share to £6.45/share to reflect the H116 results, FX moves and lower WACC. Any extra value that might be generated from the capital reinvestment in line with the company’s acquisitive strategy would represent upside to our valuation. Thus, investing €500m at 11.0x EV/EBIT would move our valuation to £7.16/share. Overall, we believe that UDG’s stock continues to represent an attractive opportunity for investors looking to increase exposure to the sector while avoiding the inherent binary risk.
Updating earnings estimates and valuation
Solid H116 results, but H2 looks more challenging
UDG delivered an encouraging set of H116 results, with revenue and adjusted (for amortisation of acquired intangibles and transaction costs) operating profit rising 6% and 15% y-o-y to €472m and €48m respectively. On a constant currency basis, the company reported 2% and 9% increase in revenue and adjusted operating profit, respectively. The overall adjusted EBIT margin came in at 10.2% vs 9.4% in H115 and 10.7% in FY15. The results were driven by the strong performance of Sharp’s US business, which saw a 28% jump in revenue (up 18% in dollar terms) and a 38% increase in EBIT (up 27% in $), with margin expanding to 15.2% vs 14.2% in H115. Ashfield did not perform as strongly though, with positive currency moves offsetting a somewhat mixed underlying performance. The UK business has seen its revenue in local currency (assuming all in sterling) falling 2%, with EBIT rising 8%, resulting in a margin expansion to 12.5% vs 11.4% in H115. Ashfield’s US revenue slid by 2% and operating profit fell 10% compared to H115. However, adjusting for the disposal of Speaker Bureau in 2015, operating profit in the US grew by 15%.
We now forecast UDG to achieve 6.1% revenue growth in FY16 (€975m at £/€1.29 vs €1,016m before at £/€1.32). Apart from the revised exchange rates (in line with the prevailing forward curve), we are more cautious on the performance of the UK and European businesses following Brexit. That said, we understand that UDG’s UK business trades within the UK and the company expects it to remain resilient. We also highlight the increased (and growing) share of the US business, which allows for earnings diversification. However, a weaker sterling will have a negative impact on results in H216. At the same time, we expect Sharp’s strong performance in the US (10% of total revenue, 33% of EBIT in H116) to continue, compensating for the potential weakness elsewhere. With a 30% increase in production capacity following the completion of the new packaging facility in Pennsylvania and strong local demand, we expect Sharp’s US revenue to reach $257m in FY16, 17% y-o-y growth which, at a $40m full-year EBIT contribution, would imply a margin of 15.7%.
Overall, we forecast UDG’s FY16 adjusted operating profit to come in at €107m (from €102m), broadly in line with BBG consensus (EBIT of €102m, EBITDA of €128m). Despite lower revenue estimates, our updated earnings forecasts reflect improved profitability as we now model 36.0% gross margin vs 34.5% before. At the bottom line, we forecast UDG’s FY16 EPS for the period at 28.8c (adjusted for exceptional items), a 4.5% increase on FY15.
Exhibit 1: Summary of financial forecasts
€m |
2015 |
H116 |
H216e |
2016e |
2017e |
Supply Chain Services |
99.9 |
48.8 |
50.0 |
98.8 |
101.3 |
Ashfield* |
599.4 |
291.2 |
303.2 |
594.4 |
602.4 |
Sharp Packaging |
244.1 |
132.4 |
149.4 |
281.8 |
316.5 |
Total revenue from continuing operations |
919.3 |
472.4 |
502.5 |
974.9 |
1,020.2 |
COGS |
581.7 |
303.8 |
320.1 |
623.9 |
652.9 |
Gross profit |
337.6 |
168.6 |
182.3 |
351.0 |
367.3 |
SG&A |
223.6 |
111.7 |
115.4 |
227.2 |
237.7 |
Admin |
16.1 |
8.6 |
8.9 |
17.5 |
18.4 |
EBIT (adjusted for exceptional items) |
98.5 |
48.4 |
58.4 |
106.8 |
111.6 |
EBIT |
68.9 |
40.2 |
234.6 |
274.9 |
95.8 |
EBITDA (adjusted for exceptional items) |
126.1 |
58.5 |
70.3 |
128.8 |
134.6 |
Profit before tax from cont. operations |
55.8 |
33.1 |
231.1 |
264.2 |
99.8 |
Net profit from cont. operations, pre-exceptional items |
54.2 |
25.2 |
37.4 |
62.6 |
76.8 |
EPS from cont. operations, pre-exceptional items (c) |
22.2 |
10.3 |
15.2 |
25.4 |
31.2 |
Net profit for the period, pre-exceptional items |
67.2 |
31.4 |
39.4 |
70.8 |
76.8 |
EPS for the period, pre-exceptional items (c) |
27.5 |
12.7 |
16.0 |
28.8 |
31.2 |
Source: UDG, Edison Investment Research. Note: *Ashfield’s 2015 revenue includes discontinued MASTA. H116 average exchange rates £/€1.34, €/£1.10.
|
Exhibit 2: Revenue composition by region |
Exhibit 3: Operating profit composition by region |
|
|
|
Source: UDG, Edison Investment Research. Note: Assuming Aquilant’s revenue is 50% UK/50% EU. |
Source: UDG, Edison Investment Research. Note: Assuming Aquilant’s EBIT is 50% UK/50% EU. |
|
Exhibit 2: Revenue composition by region |
|
|
Source: UDG, Edison Investment Research. Note: Assuming Aquilant’s revenue is 50% UK/50% EU. |
|
Exhibit 3: Operating profit composition by region |
|
|
Source: UDG, Edison Investment Research. Note: Assuming Aquilant’s EBIT is 50% UK/50% EU. |
Valuation: Upgrading DCF on H116 results, FX, lower WACC
We increase our DCF-derived valuation of UDG from £5.21 to £6.45/share to reflect the recently released H116 results, FX moves and lower WACC (6.3% now vs 7.4% before). The latter has the most pronounced impact on the valuation, as we have reduced the risk-free rate from 0.70% to 0.25% against the backdrop of negative government bond yields and adjusted our beta estimate to 0.75 (vs 0.90) to bring it in line with Bloomberg (ytd adjusted beta estimate 0.72). We note that any extra value that might be generated from the reinvestment of available capital (FY16e cash of €443m, net cash of €146m) in line with the company’s acquisitive strategy (to this end, we note the recently announced purchase of Pegasus PR for an initial consideration of £10m) would represent upside to our valuation. On our estimates, investing some €500m at 11.0x EV/EBIT (the stock currently trades at an FY17e EV/EBIT (adjusted) of 11.4x and EV/EBITDA of 9.4x) would increase the valuation to £7.16/share. The company uses a prudent 15% ROCE target over three years when considering acquisitions. All in all, we believe that UDG’s shares continue to represent an attractive investment proposition for investors looking to increase their exposure to the sector while avoiding the inherent binary risk. In addition, we note a healthy dividend yield of 1.6% (FY16e) and would not rule out a one-off increase in dividends should the company decide to return capital to shareholders following the recent successful sale of the drug distribution business.
Exhibit 4: Base-case DCF calculation
€m |
2016e |
2017e |
2018e |
2019e |
2020e |
2021e |
2022e |
EBIT |
106.8 |
111.6 |
115.6 |
120.0 |
123.2 |
126.3 |
129.5 |
Tax rate |
23.0% |
23.0% |
23.0% |
23.0% |
23.0% |
23.0% |
23.0% |
Tax |
24.6 |
25.7 |
26.6 |
27.6 |
28.3 |
29.0 |
29.8 |
NOPAT |
82.2 |
85.9 |
89.0 |
92.4 |
94.8 |
97.2 |
99.7 |
DD&A, impairments |
37.0 |
38.8 |
40.2 |
41.8 |
42.9 |
44.0 |
48.7 |
Working capital |
-1.8 |
-3.3 |
-2.7 |
-3.0 |
-2.1 |
-2.1 |
-2.2 |
Capex and acquisitions |
301.9 |
-56.0 |
-52.6 |
-54.5 |
-55.8 |
-57.1 |
-58.5 |
Free cash flow |
419.4 |
65.4 |
73.9 |
76.7 |
79.8 |
82.0 |
87.8 |
WACC, % |
6.25 |
6.25 |
6.25 |
6.25 |
6.25 |
6.25 |
6.25 |
Present value of FCF |
394.7 |
58.0 |
61.6 |
60.2 |
58.9 |
57.0 |
57.4 |
Total PV of FCF |
748 |
|
|
|
|
|
|
Terminal value |
2,107 |
|
|
|
|
|
|
Terminal growth rate |
2.0% |
|
|
|
|
|
|
PV of terminal value |
1,378 |
|
|
|
|
|
|
Total enterprise value |
2,126 |
|
|
|
|
|
|
Net debt/(cash) (2015) |
223 |
|
|
|
|
|
|
Equity value |
1,903 |
|
|
|
|
|
|
Total number of shares (m) (H116) |
246 |
|
|
|
|
|
|
Value per share (£) |
6.45 |
|
|
|
|
|
|
Source: Edison Investment Research
Exhibit 5: Financial summary
€m |
2014 |
2015 |
2016e |
2017e |
2018e |
|
Year end 30 September |
IFRS |
IFRS |
IFRS |
IFRS |
IFRS |
|
PROFIT & LOSS |
||||||
Revenue |
|
764 |
919 |
975 |
1,020 |
1,057 |
Cost of Sales |
(497) |
(582) |
(624) |
(653) |
(677) |
|
Gross Profit |
267 |
338 |
351 |
367 |
381 |
|
EBITDA |
|
98 |
126 |
129 |
135 |
139 |
Operating Profit (before GW and except) |
|
75 |
99 |
107 |
112 |
116 |
Intangible Amortisation |
(16) |
(19) |
(19) |
(19) |
(20) |
|
Exceptionals |
62 |
(15) |
183 |
0 |
0 |
|
Operating Profit |
124 |
69 |
275 |
96 |
99 |
|
Other |
0 |
0 |
0 |
0 |
0 |
|
Net Interest |
(16) |
(13) |
(11) |
4 |
5 |
|
Profit Before Tax (norm) |
|
46 |
70 |
81 |
100 |
104 |
Profit Before Tax (IFRS) |
|
108 |
56 |
264 |
100 |
104 |
Tax (cont. operations) |
(10) |
(16) |
(18) |
(23) |
(24) |
|
Net profit from cont. operations after tax (norm) |
36 |
54 |
63 |
77 |
80 |
|
Net profit from cont. operations after tax (IFRS) |
98 |
42 |
246 |
77 |
80 |
|
Profit After Tax (discontinued operations) |
13 |
13 |
9 |
0 |
0 |
|
Minority interest |
0 |
0 |
0 |
0 |
0 |
|
Net profit for the period (norm) |
56 |
67 |
71 |
77 |
80 |
|
Net profit for the period (IFRS) |
110 |
55 |
255 |
77 |
80 |
|
Average Number of Shares Outstanding (m) |
242 |
244 |
246 |
246 |
246 |
|
EPS from cont. operations - normalised fully diluted (c) |
|
14.7 |
22.1 |
25.3 |
31.1 |
32.3 |
EPS for the period - normalised fully diluted (c) |
|
23.2 |
27.4 |
28.6 |
31.1 |
32.3 |
Dividend per share (c) |
10.1 |
11.0 |
11.5 |
12.5 |
13.0 |
|
Gross Margin (%) |
35.0% |
36.7% |
36.0% |
36.0% |
36.0% |
|
EBITDA Margin (%) |
12.8% |
13.7% |
13.2% |
13.2% |
13.2% |
|
Operating Margin (before GW and except.) (%) |
9.9% |
10.7% |
11.0% |
10.9% |
10.9% |
|
BALANCE SHEET |
||||||
Fixed Assets |
|
698 |
640 |
682 |
702 |
717 |
Intangible Assets |
490 |
460 |
467 |
468 |
469 |
|
Tangible Assets |
174 |
118 |
144 |
156 |
162 |
|
Other |
34 |
62 |
70 |
78 |
86 |
|
Current Assets |
|
738 |
955 |
726 |
761 |
802 |
Stocks |
168 |
55 |
58 |
61 |
63 |
|
Debtors |
407 |
205 |
218 |
228 |
236 |
|
Cash |
160 |
214 |
443 |
466 |
496 |
|
Other (2015: Including assets held for sale) |
3 |
480 |
6 |
6 |
6 |
|
Current Liabilities |
|
(434) |
(516) |
(250) |
(259) |
(267) |
Creditors |
(422) |
(192) |
(206) |
(215) |
(223) |
|
Other (2015: Including liabilities held for sale) |
(12) |
(324) |
(44) |
(44) |
(44) |
|
Long Term Liabilities |
|
(468) |
(470) |
(331) |
(331) |
(331) |
Long term borrowings |
(391) |
(416) |
(277) |
(277) |
(277) |
|
Other long term liabilities |
(76) |
(54) |
(54) |
(54) |
(54) |
|
Net Assets |
|
534 |
609 |
827 |
873 |
921 |
CASH FLOW |
||||||
Operating Cash Flow |
|
93 |
165 |
124 |
128 |
134 |
Net Interest |
(15) |
(12) |
(11) |
4 |
5 |
|
Tax |
(14) |
(15) |
(18) |
(23) |
(24) |
|
Capex |
(38) |
(65) |
(58) |
(51) |
(48) |
|
Acquisitions/disposals |
(93) |
2 |
365 |
0 |
0 |
|
Financing |
2 |
5 |
0 |
0 |
0 |
|
Dividends |
(23) |
(25) |
(28) |
(31) |
(32) |
|
Other |
92 |
(6) |
(5) |
(5) |
(5) |
|
Net Cash Flow |
3 |
49 |
368 |
23 |
30 |
|
Opening net debt/(cash) |
|
256 |
246 |
223 |
(146) |
(168) |
HP finance leases initiated |
0 |
0 |
0 |
0 |
0 |
|
Other |
7 |
(26) |
0 |
0 |
0 |
|
Closing net debt/(cash) |
|
246 |
223 |
(146) |
(168) |
(198) |
Source: Company accounts, Edison Investment Research
|