Last close As at 05/08/2026
ZAR28.10
▲ 0.23 (0.83%)
Market capitalisation
ZAR11,853m
Research: TMT
Altron’s FY24 results confirmed good progress with its strategic plan, with headline EPS from continuing operations up 36% y-o-y and well ahead of our forecast. The bulk of restructuring is now complete and has already boosted operating margins from 4.9% in FY21 to 9.0% in FY24. Altron is now positioned to drive revenue and profit growth through a combination of innovation, cross-selling and ongoing operational improvements.
Altron |
Transformation plan drives margin growth |
FY24 results |
Software and comp services |
5 June 2024 |
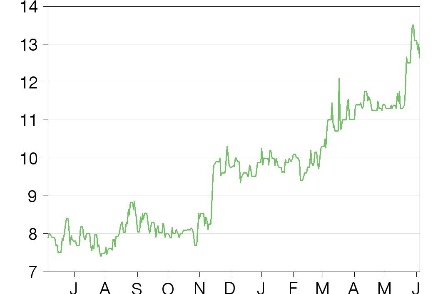
Share price performance
Business description
Next events
Analyst
Altron is a research client of Edison Investment Research Limited |
||||||||||||||||||||||||||||||||||||||||||
Altron’s FY24 results confirmed good progress with its strategic plan, with headline EPS from continuing operations up 36% y-o-y and well ahead of our forecast. The bulk of restructuring is now complete and has already boosted operating margins from 4.9% in FY21 to 9.0% in FY24. Altron is now positioned to drive revenue and profit growth through a combination of innovation, cross-selling and ongoing operational improvements.
Year end |
Revenue* (ZARm) |
PBT** |
Diluted EPS** |
HEPS*** (ZAR) |
DPS |
P/E |
Yield |
02/23 |
8,445 |
482 |
0.88 |
0.85 |
0.35 |
14.4 |
2.8 |
02/24 |
8,250 |
634 |
1.15 |
1.16 |
0.58 |
11.0 |
4.6 |
02/25e |
8,404 |
725 |
1.31 |
1.29 |
0.63 |
9.7 |
5.0 |
02/26e |
9,076 |
871 |
1.57 |
1.59 |
0.77 |
8.0 |
6.1 |
Note: *Continuing operations. **PBT and EPS are normalised, excluding amortisation of acquired intangibles and exceptional items, and are for continuing operations. ***Basic continuing headline EPS.
Strong FY24 performance from continuing operations
Altron reported revenue growth of -2% from continuing operations (+8% stripping out the ATM business sold in H124), with 20% growth in EBITDA before capital items and 23% growth in operating profit before capital items. Operating margin increased 1.9pp to 9.0% with improvement in the two largest businesses by revenue (Altron Systems Integration, Netstar) the main drivers of this growth. Headline basic EPS from continuing operations of ZAR1.16 was 16% ahead of our forecast, mainly due to better-than-expected performance from the Platform businesses and lower than forecast net finance costs. Year-end net debt was significantly lower than expected due to tight control of working capital.
Medium-term outlook maintained
Management maintained its medium-term target to triple operating profit from continuing operations from FY21 to FY26e, while highlighting short-term political uncertainty stemming from the recent South African election. We have revised our forecasts to reflect FY24 results, with upgrades to headline EPS (HEPS) from continuing operations offset by larger forecast losses in discontinued operations, leaving group HEPS broadly unchanged. We have increased our dividend forecasts as management targets a payout of 50% of HEPS from continuing operations.
Valuation: Undervalued versus international peers
We have updated our sum-of-the-parts valuation to reflect our revised forecasts and to roll forward by one year. After a 30% holding company/South Africa discount, we arrive at a valuation of ZAR24 per share, 91% above the current share price. A reverse DCF implies that the current share price is factoring in only modest revenue growth and minimal margin growth from FY27. In our view, evidence of continued margin progress and clarity over the disposal of the two discontinued businesses should provide triggers for share price upside.
Review of FY24 results
We summarise Altron’s FY24 results in Exhibit 1.
Exhibit 1: FY24 results highlights
ZARbn |
FY23 |
FY24e |
FY24a |
Diff |
y-o-y |
|
Revenues |
8,445.0 |
8,337.1 |
8,250.0 |
-1.0% |
-2.3% |
|
EBITDA |
1,251.0 |
1,488.1 |
1,502.0 |
0.9% |
20.1% |
|
EBITDA margin |
14.8% |
17.8% |
18.2% |
0.4% |
3.4% |
|
Normalised operating profit |
621.0 |
726.8 |
766.0 |
5.4% |
23.3% |
|
Normalised operating margin |
7.4% |
8.7% |
9.3% |
0.6% |
1.9% |
|
Reported operating profit |
540.0 |
645.8 |
704.0 |
9.0% |
30.4% |
|
Reported operating margin |
6.4% |
7.7% |
8.5% |
0.8% |
2.1% |
|
Normalised PBT |
482.0 |
574.8 |
634.0 |
10.3% |
31.5% |
|
Reported PBT |
401.0 |
493.8 |
572.0 |
15.8% |
42.6% |
|
Normalised net income – continuing operations |
338.8 |
393.6 |
445.5 |
13.2% |
31.5% |
|
Reported net income |
(4.0) |
(162.7) |
(164.0) |
0.8% |
N/A |
|
Normalised basic EPS – continuing operations (ZAR) |
0.90 |
1.04 |
1.18 |
13.2% |
31.0% |
|
Normalised diluted EPS – continuing operations (ZAR) |
0.88 |
1.02 |
1.15 |
12.4% |
30.1% |
|
Headline diluted EPS – continuing operations (ZAR) |
0.83 |
0.98 |
1.13 |
14.9% |
35.3% |
|
Headline diluted EPS – discontinued operations (ZAR) |
(0.55) |
(1.18) |
(1.37) |
15.7% |
147.1% |
|
Headline diluted EPS – group (ZAR) |
0.28 |
(0.20) |
(0.24) |
19.9% |
N/A |
|
Reported basic EPS (ZAR) |
(0.01) |
(0.43) |
(0.43) |
0.8% |
N/A |
|
Dividend per share (ZAR) |
0.35 |
0.49 |
0.58 |
18.0% |
65.8% |
|
Net debt – group |
563.0 |
672.3 |
313.0 |
-53.4% |
-44.4% |
|
Net debt/(cash) – continuing operations |
173.0 |
282.3 |
(198.0) |
N/A |
N/A |
Source: Altron, Edison Investment Research
For continuing operations, Altron reported a 2% revenue decline for FY24, slightly below our forecast. Stripping out the effect of the disposal of the ATM business from Altron Managed Solutions, which completed on 1 July 2023, underlying revenue increased 8% y-o-y. Despite the lower reported revenue, EBITDA from continuing operations increased 20% y-o-y and was marginally ahead of our forecast. Continuing operations EBITDA margin increased 3.4pp to 18.2% – we discuss the relative contributions to this growth in the divisional section below. Normalised operating profit was 5% ahead of our forecast and increased 23% y-o-y, while reported operating profit from continuing operations increased 30% y-o-y, resulting in a reported operating margin of 8.5% for continuing operations. Capital item charges totalled ZAR35m in FY24 for continuing operations compared to ZAR59m in FY23 – operating profit before these charges was ZAR739m in FY24, up 23% from ZAR599m in FY23. Net finance costs for continuing operations were ZAR134m, below our ZAR155m forecast, resulting in normalised PBT 10% ahead of our forecast representing growth of 32% y-o-y. Reported group EPS was in line with our forecast, whereas the HEPS loss was slightly larger than forecast. Diluted HEPS from continuing operations was 15% higher than our forecast at ZAR1.13 and 35% higher year-on-year. Diluted HEPS from discontinued operations of -ZAR1.37 was 16% lower than our -ZAR1.18 forecast, mainly due to lower-than-expected revenue from Altron Nexus in H224.
Group net debt of ZAR313m was significantly lower than our ZAR672m forecast, with the main difference being a larger than expected reduction in working capital requirements. For continuing operations, the company reported a year-end net cash position of ZAR198m compared to our forecast of net debt of ZAR282m.
The company announced a final dividend of ZAR0.33, which, when added to the interim dividend of ZAR0.25, results in a total dividend of ZAR0.58 for the year, 18% ahead of our forecast. The company policy is to pay out 50% of HEPS from continuing operations.
Divisional performance
Exhibits 2 and 3 below show performance by business line in FY24. As a reminder, this is the last time that Altron Managed Solutions, Altron Systems Integration and Altron Karabina will report their individual results. From 1 March, they were combined to create Digital Business, and together with Altron Security, will make up the IT Services group.
■
Altron Managed Solutions (AMS): as we noted earlier, the ATM business was sold on 1 July 2023. Excluding its contribution in FY23 and FY24, AMS generated revenue of ZAR846m in FY24, up 9% versus FY23 helped by 13% growth in outsourcing and managed services revenue. Reported EBITDA and operating profit declined by 56% and 55% respectively; excluding the ATM contribution, EBITDA was 6% higher year-on-year at ZAR54m.
■
Altron Systems Integration: the business reported revenue growth of 1.9% in FY24, with H124 y-o-y growth of 5.0% and a 0.8% decline in H224 reflecting the decision to move away from lower-margin work. Gross margin increased 3pp y-o-y and operating expenses fell by 13%. EBITDA increased from ZAR5m in FY23 to ZAR93m in FY24, 10% ahead of our forecast. Reflecting the restructuring undertaken over the last two years, the EBITDA margin increased 4.3pp to 4.6%. Operating profit increased from -ZAR20m in FY23 to ZAR87m in FY24, 11% ahead of our forecast, and the operating margin increased 5.3pp to 4.3%.
■
Altron Karabina: revenue grew 3% y-o-y and was slightly below our forecast. EBITDA grew 14% y-o-y and operating profit grew 57%, with the operating margin expanding 3.4pp to 9.9%. While the precise margin was not disclosed, gross margin increased 9pp y-o-y. Management noted that the business had seen reduced demand from two large customers and growth had been constrained by skills shortages, which it is addressing via training programmes.
■
Altron Security: revenue increased 3% y-o-y while EBITDA and operating profit declined 3% y-o-y, in line with our forecasts. This resulted in a decline in EBITDA margin of 1.4pp to 22.5% and in operating margin of 0.9pp to 16.0%. Management noted it had seen a drop in project services revenue due to customer capex constraints but also referred to less than optimal project management. It has taken corrective action to protect the gross margin and manage expenses and has put in place a growth plan for each segment.
■
Netstar: the business continued to make good progress in improving operational performance while growing revenues. Revenue was 11.6% higher year-on-year, helped by 27% growth in subscribers to more than 1.7 million and 44% growth in connected devices to more than 2.3m. By year-end, churn had reduced to 16% from 22% in FY23, the retention rate was 95%, pre-fitment conversion was 66% (FY23: 32%) and contract fulfilment reached 94% (FY23: 72%). EBITDA increased 27% y-o-y expanding the margin by 4.6pp to 38.4%, ahead of our 37.3% forecast. Reflecting the higher level of depreciation due to the growth in subscribers (tracking devices are depreciated over three years), operating profit increased 16% y-o-y and the operating margin increased 0.4pp to 10.7%.
■
Altron FinTech: revenue increased 5% y-o-y after an exceptionally strong year in FY23 when revenue grew 22% due to a high level of hardware purchases. EBITDA increased 22% y-o-y and was 12% higher than we forecast, resulting in margin expansion of 4.1pp to 30.0%. Operating profit increased 24% and the operating margin expanded 4.0pp to 26.3%, ahead of our 23.6% forecast. A higher proportion of higher-margin annuity revenues than in FY23, combined with the scale effect of higher revenues, drove the margin expansion.
■
Altron HealthTech: revenue increased 7% y-o-y (enterprise 9%, private practice 6%), EBITDA increased 3% and operating profit 6%, all in line with our forecasts. The operating margin declined marginally to 27.3%.
■
Altron Arrow: the joint venture grew revenue by 18% y-o-y, EBITDA by 33% and operating profit by 34%, expanding the operating margin by 1pp to 8.4%.
Exhibit 2: Revenue by business line
ZARm |
FY23 |
FY24e |
FY24a |
Diff |
y-o-y |
Managed Services |
|||||
Altron Managed Solutions |
1,882 |
1,174 |
1,179 |
0.4% |
-37.4% |
Digital Transformation |
|||||
Altron Systems Integration |
2,003 |
2,104 |
2,041 |
-3.0% |
1.9% |
Altron Security |
436 |
451 |
449 |
-0.4% |
3.0% |
Altron Karabina |
350 |
368 |
362 |
-1.6% |
3.4% |
2,789 |
2,923 |
2,852 |
-2.4% |
2.3% |
|
Own Platforms |
|||||
Netstar |
1,859 |
2,131 |
2,074 |
-2.7% |
11.6% |
Altron FinTech |
1,044 |
1,079 |
1,099 |
1.8% |
5.3% |
Altron HealthTech |
350 |
373 |
374 |
0.3% |
6.9% |
3,253 |
3,582 |
3,547 |
-1.0% |
9.0% |
|
Altron Arrow |
679 |
771 |
802 |
4.0% |
18.1% |
Corporate/consolidation |
(158) |
(113) |
(130) |
15.0% |
-17.7% |
Other |
521 |
658 |
672 |
2.1% |
29.0% |
Total Revenue |
8,445 |
8,337 |
8,250 |
-1.0% |
-2.3% |
Source: Altron, Edison Investment Research
Exhibit 3: Profitability by business line
EBITDA before capital items |
EBITDA margin before capital items |
||||||||||
FY23 |
FY24e |
FY24a |
Diff |
y-o-y |
FY23 |
FY24e |
FY24a |
Diff |
y-o-y |
||
Managed Services |
|||||||||||
Altron Managed Solutions |
117 |
57 |
51 |
-9.7% |
-56.4% |
6.2% |
4.8% |
4.3% |
-0.5pp |
-1.9pp |
|
Digital Transformation |
|||||||||||
Altron Systems Integration |
5 |
85 |
93 |
10.0% |
1,760.0% |
0.2% |
4.0% |
4.6% |
0.5pp |
4.3pp |
|
Altron Security |
104 |
102 |
101 |
-1.1% |
-2.9% |
23.9% |
22.6% |
22.5% |
-0.1pp |
-1.4pp |
|
Altron Karabina |
43 |
54 |
49 |
-9.3% |
14.0% |
12.3% |
14.7% |
13.5% |
-1.1pp |
1.3pp |
|
152 |
241 |
243 |
1.0% |
59.9% |
5.4% |
8.2% |
8.5% |
0.3pp |
3.1pp |
||
Own Platforms |
|||||||||||
Netstar |
629 |
795 |
797 |
0.2% |
26.7% |
33.8% |
37.3% |
38.4% |
1.1pp |
4.6pp |
|
Altron FinTech |
271 |
295 |
330 |
11.8% |
21.8% |
26.0% |
27.4% |
30.0% |
2.7pp |
4.1pp |
|
Altron HealthTech |
103 |
106 |
106 |
-0.3% |
2.9% |
29.4% |
28.5% |
28.3% |
-0.2pp |
-1.1pp |
|
1,003 |
1,197 |
1,233 |
3.0% |
22.9% |
30.8% |
33.4% |
34.8% |
1.4pp |
3.9pp |
||
Altron Arrow |
52 |
71 |
69 |
-2.8% |
32.7% |
7.7% |
9.2% |
8.6% |
-0.6pp |
0.9pp |
|
Corporate/consolidation |
(73) |
(77) |
(94) |
22.1% |
28.8% |
46.2% |
68.1% |
72.3% |
|||
Other |
(21) |
(6) |
(25) |
316.0% |
19.0% |
-4.0% |
-0.9% |
-3.7% |
-2.8pp |
0.3pp |
|
Total EBITDA |
1,251 |
1,488 |
1,502 |
0.9% |
20.1% |
14.8% |
17.8% |
18.2% |
0.4pp |
3.4pp |
|
Operating profit before capital items |
Operating margin before capital items |
||||||||||
FY23 |
FY24e |
FY24a |
Diff |
y-o-y |
FY23 |
FY24e |
FY24a |
Diff |
y-o-y |
||
Managed Services |
|||||||||||
Altron Managed Solutions |
73 |
35 |
33 |
-5.7% |
-54.8% |
3.9% |
3.0% |
2.8% |
-0.2pp |
-1.1pp |
|
Digital Transformation |
|||||||||||
Altron Systems Integration |
(20) |
79 |
87 |
10.7% |
-535.0% |
-1.0% |
3.7% |
4.3% |
0.5pp |
5.3pp |
|
Altron Security |
74 |
72 |
72 |
-0.1% |
-2.7% |
17.0% |
16.0% |
16.0% |
0.0pp |
-0.9pp |
|
Altron Karabina |
23 |
38 |
36 |
-5.3% |
56.5% |
6.6% |
10.3% |
9.9% |
-0.4pp |
3.4pp |
|
77 |
189 |
195 |
3.4% |
153.2% |
2.8% |
6.5% |
6.8% |
0.4pp |
4.1pp |
||
Own Platforms |
|||||||||||
Netstar |
192 |
212 |
222 |
4.6% |
15.6% |
10.3% |
10.0% |
10.7% |
0.7pp |
0.4pp |
|
Altron FinTech |
233 |
255 |
289 |
13.2% |
24.0% |
22.3% |
23.6% |
26.3% |
2.6pp |
4.0pp |
|
Altron HealthTech |
96 |
100 |
102 |
1.6% |
6.3% |
27.4% |
26.9% |
27.3% |
0.3pp |
-0.2pp |
|
521 |
568 |
613 |
8.0% |
17.7% |
16.0% |
15.9% |
17.3% |
1.4pp |
1.3pp |
||
Altron Arrow |
50 |
69 |
67 |
-2.9% |
34.0% |
7.4% |
8.9% |
8.4% |
-0.6pp |
1.0pp |
|
Corporate/consolidation |
(122) |
(155) |
(169) |
9.0% |
38.5% |
77.2% |
137.2% |
130.0% |
|||
Other |
(72) |
(86) |
(102) |
18.6% |
41.7% |
-13.8% |
-13.1% |
-15.2% |
-2.1pp |
-1.4pp |
|
Total operating profit |
599 |
705 |
739 |
4.8% |
23.4% |
7.1% |
8.5% |
9.0% |
0.5pp |
1.9pp |
|
Source: Altron, Edison Investment Research
Discontinued operations
This includes Altron Document Solutions (ADS) and Altron Nexus. In FY24, discontinued operations generated a net loss of ZAR574m compared to our ZAR500m forecast and a net loss of ZAR283m in FY23. Significant one-off charges were taken in both businesses in H124 for restructuring and provisions against inventory and receivables. The company has already put in place new management for both businesses and continues to be in active discussions with potential buyers of ADS. In H224, ADS returned to profitability and positive cash flow generation helped by strict working capital management and grew revenue 13% in FY24. Altron Nexus conversely saw a revenue decline of 35% in FY24, partly due to the loss of the Gauteng Broadband Network contract but also due to the transfer of the Huawei networking and enterprise services business into Altron Systems Integration from October 2023, and generated an EBITDA loss of ZAR421m and an operating loss of ZAR433m. There is also an active sales process underway for Nexus.
Outlook and changes to forecasts
Management maintained its medium-term outlook as per Exhibit 4. In the shorter term, management referenced the South African elections as potentially creating uncertainty. With the shape of the coalition government yet to be decided, it is difficult to quantify risks but, whatever the outcome, it is possible that this period of uncertainty will lead to delays in decision making by corporates and the public sector. Management is focused on controlling what it can and providing continuity for its customers.
|
Exhibit 4: Management guidance |
|
|
Source: Altron |
At a business line level, management aims to maintain Altron HealthTech, Altron FinTech and Altron Security margins at current levels, while targeting Netstar margins of 16%. As there is a global ongoing correction in demand in Altron Arrow’s market, we are forecasting a revenue decline in FY25 but management is aiming to maintain the operating margin.
We have revised our forecasts to reflect FY24 results. For FY25, we have increased our operating profit forecast by 2%, reflecting better profitability from the Platforms business (better FinTech profitability offset by slightly lower revenue in Netstar). For FY26, we have factored in slightly higher depreciation for Netstar and slightly lower revenue in Altron Systems Integration, which reduces our operating profit forecast by 3%. We are forecasting operating profit before capital items of ZAR1.0bn in FY26, slightly below management’s target. As we are now forecasting a lower net finance cost due to lower net debt, our normalised and reported PBT forecasts are higher in both years, driving upgrades to HEPS from continuing operations. We have reduced our revenue expectations for Altron Nexus, resulting in a larger loss from discontinued operations in both years. Overall, group HEPS is unchanged for FY25 and 1% higher in FY26.
Exhibit 5: Changes to forecasts
FY25e |
FY26e |
||||||||
ZARbn |
Old |
New |
Change |
y-o-y |
Old |
New |
Change |
y-o-y |
|
Revenues |
8,508.3 |
8403.6 |
-1.2% |
1.9% |
9,191.5 |
9075.9 |
-1.3% |
8.0% |
|
EBITDA |
1,689.3 |
1710.6 |
1.3% |
13.9% |
1,972.5 |
1971.9 |
0.0% |
15.3% |
|
EBITDA margin |
19.9% |
20.4% |
0.5% |
2.1% |
21.5% |
21.7% |
0.3% |
1.4% |
|
Normalised operating profit |
824.6 |
844.8 |
2.5% |
10.3% |
1,017.2 |
986.7 |
-3.0% |
16.8% |
|
Normalised operating margin |
9.7% |
10.1% |
0.4% |
0.8% |
11.1% |
10.9% |
-0.2% |
0.8% |
|
Reported operating profit |
787.6 |
802.8 |
1.9% |
14.0% |
980.2 |
954.7 |
-2.6% |
18.9% |
|
Reported operating margin |
9.3% |
9.6% |
0.3% |
1.0% |
10.7% |
10.5% |
-0.1% |
1.0% |
|
Normalised PBT |
652.6 |
724.8 |
11.1% |
14.3% |
841.2 |
870.7 |
3.5% |
20.1% |
|
Reported PBT |
615.6 |
682.8 |
10.9% |
19.4% |
804.2 |
838.7 |
4.3% |
22.8% |
|
Normalised net income – continuing operations |
453.6 |
508.4 |
12.1% |
14.1% |
590.5 |
611.5 |
3.6% |
20.3% |
|
Reported net income |
342.6 |
336.4 |
-1.8% |
-305.1% |
479.5 |
489.5 |
2.1% |
45.5% |
|
Normalised basic EPS – continuing operations (ZAR) |
1.20 |
1.34 |
12.1% |
14.1% |
1.56 |
1.61 |
3.5% |
20.3% |
|
Normalised diluted EPS – continuing operations (ZAR) |
1.18 |
1.31 |
11.3% |
14.1% |
1.53 |
1.57 |
2.8% |
20.3% |
|
Headline basic EPS – continuing operations (ZAR) |
1.16 |
1.29 |
11.4% |
11.0% |
1.52 |
1.59 |
4.5% |
23.2% |
|
Headline basic EPS – discontinued operations (ZAR) |
(0.20) |
(0.35) |
73.0% |
-75.1% |
(0.20) |
(0.24) |
20.9% |
-30.1% |
|
Headline basic EPS – group (ZAR) |
0.95 |
0.94 |
-1.7% |
-481.3% |
1.31 |
1.34 |
2.0% |
43.2% |
|
Headline diluted EPS – continuing operations (ZAR) |
1.13 |
1.25 |
10.6% |
11.0% |
1.49 |
1.55 |
3.8% |
23.2% |
|
Headline diluted EPS – discontinued operations (ZAR) |
(0.20) |
(0.34) |
71.8% |
-75.1% |
(0.20) |
(0.24) |
20.0% |
-30.1% |
|
Headline diluted EPS – group (ZAR) |
0.93 |
0.91 |
-2.4% |
-481.3% |
1.29 |
1.31 |
1.3% |
43.2% |
|
Reported basic EPS (ZAR) |
0.90 |
0.89 |
-1.8% |
-305.1% |
1.27 |
1.29 |
2.1% |
45.5% |
|
Dividend per share (ZAR) |
0.57 |
0.63 |
10.6% |
8.1% |
0.74 |
0.77 |
3.8% |
23.2% |
|
Net debt – group |
716.4 |
552.5 |
-22.9% |
76.5% |
729.4 |
634.1 |
-13.1% |
14.8% |
|
Net debt – continuing operations |
326.4 |
41.5 |
-87.3% |
-121.0% |
339.4 |
123.1 |
-63.7% |
196.7% |
|
Source: Edison Investment Research
Exhibit 6: Financial summary
Year end 28 February |
ZARm |
2019 |
2020 |
2021 |
2022 |
2023 |
2024 |
2025e |
2026e |
||
INCOME STATEMENT |
IFRS |
IFRS |
IFRS |
IFRS |
IFRS |
IFRS |
IFRS |
IFRS |
|||
Revenue |
|
|
15,723.0 |
7,383.0 |
7,505.0 |
7,930.0 |
8,445.0 |
8,250.0 |
8,403.6 |
9,075.9 |
|
Costs |
(14,116.0) |
(6,283.0) |
(6,472.0) |
(6,790.0) |
(7,194.0) |
(6,748.0) |
(6,693.0) |
(7,104.0) |
|||
EBITDA |
|
|
1,607.0 |
1,100.0 |
1,033.0 |
1,140.0 |
1,251.0 |
1,502.0 |
1,710.6 |
1,971.9 |
|
Normalised operating profit |
|
|
1,041.0 |
456.0 |
371.0 |
518.0 |
621.0 |
766.0 |
844.8 |
986.7 |
|
Amortisation of acquired intangibles |
0.0 |
0.0 |
0.0 |
(20.0) |
(22.0) |
(27.0) |
(27.0) |
(17.0) |
|||
Exceptionals/capital items |
(26.0) |
1.0 |
(23.0) |
(213.0) |
(59.0) |
(35.0) |
(15.0) |
(15.0) |
|||
Share-based payments |
0.0 |
0.0 |
0.0 |
0.0 |
0.0 |
0.0 |
0.0 |
0.0 |
|||
Reported operating profit |
1,015.0 |
457.0 |
348.0 |
285.0 |
540.0 |
704.0 |
802.8 |
954.7 |
|||
Net Interest |
(176.0) |
(255.0) |
(179.0) |
(146.0) |
(142.0) |
(134.0) |
(120.0) |
(116.0) |
|||
Joint ventures & associates (post tax) |
(1.0) |
(30.0) |
(41.0) |
3.0 |
3.0 |
2.0 |
0.0 |
0.0 |
|||
Exceptionals |
0.0 |
0.0 |
0.0 |
0.0 |
0.0 |
0.0 |
0.0 |
0.0 |
|||
Profit Before Tax (norm) |
|
|
864.0 |
171.0 |
151.0 |
375.0 |
482.0 |
634.0 |
724.8 |
870.7 |
|
Profit Before Tax (reported) |
|
|
838.0 |
172.0 |
128.0 |
142.0 |
401.0 |
572.0 |
682.8 |
838.7 |
|
Reported tax |
(158.0) |
(50.0) |
(34.0) |
(63.0) |
(105.0) |
(139.0) |
(184.4) |
(226.5) |
|||
Profit After Tax (norm) |
701.1 |
121.3 |
110.9 |
208.6 |
355.8 |
468.5 |
530.5 |
634.3 |
|||
Profit After Tax (reported) |
680.0 |
122.0 |
94.0 |
79.0 |
296.0 |
433.0 |
498.4 |
612.3 |
|||
Minority interests |
(39.0) |
20.0 |
12.0 |
(9.0) |
(17.0) |
(23.0) |
(22.0) |
(22.7) |
|||
Discontinued operations |
70.0 |
506.0 |
12,048.0 |
(174.0) |
(283.0) |
(574.0) |
(140.0) |
(100.0) |
|||
Net income (normalised) |
662.1 |
141.3 |
122.9 |
199.6 |
338.8 |
445.5 |
508.4 |
611.5 |
|||
Net income (reported) |
711.0 |
648.0 |
12,154.0 |
(104.0) |
(4.0) |
(164.0) |
336.4 |
489.5 |
|||
Basic average number of shares outstanding (m) |
371.0 |
371.2 |
371.6 |
371.9 |
377.3 |
377.3 |
378.6 |
378.7 |
|||
EPS – diluted normalised (ZAR) |
|
|
1.77 |
0.38 |
0.33 |
0.53 |
0.88 |
1.15 |
1.31 |
1.57 |
|
EPS – basic reported (ZAR) |
|
|
1.92 |
1.75 |
32.70 |
(0.28) |
(0.01) |
(0.43) |
0.89 |
1.29 |
|
EPS headline basic (ZAR) |
|
|
1.91 |
1.73 |
1.35 |
0.37 |
0.29 |
(0.25) |
0.94 |
1.34 |
|
Dividend (ZAR) |
0.44 |
0.55 |
1.44 |
0.30 |
0.35 |
0.58 |
0.63 |
0.77 |
|||
Revenue growth (%) |
-53.0% |
1.7% |
5.7% |
6.5% |
-2.3% |
1.9% |
8.0% |
||||
EBITDA Margin (%) |
10.2% |
14.9% |
13.8% |
14.4% |
14.8% |
18.2% |
20.4% |
21.7% |
|||
Normalised Operating Margin (%) |
6.6% |
6.2% |
4.9% |
6.5% |
7.4% |
9.3% |
10.1% |
10.9% |
|||
BALANCE SHEET |
|||||||||||
Fixed Assets |
|
|
4,171.0 |
4,550.0 |
3,793.0 |
3,965.0 |
4,013.0 |
4,139.0 |
4,407.2 |
4,630.4 |
|
Intangible Assets |
2,048.0 |
2,159.0 |
1,623.0 |
1,918.0 |
2,105.0 |
2,251.0 |
2,403.9 |
2,525.0 |
|||
Tangible Assets |
1,109.0 |
1,655.0 |
1,719.0 |
1,476.0 |
1,346.0 |
1,326.0 |
1,441.3 |
1,543.4 |
|||
Investments & other |
1,014.0 |
736.0 |
451.0 |
571.0 |
562.0 |
562.0 |
562.0 |
562.0 |
|||
Current Assets |
|
|
7,430.0 |
9,063.0 |
6,592.0 |
5,404.0 |
5,649.0 |
5,216.0 |
4,980.1 |
5,082.2 |
|
Stocks |
1,017.0 |
1,252.0 |
833.0 |
972.0 |
1,023.0 |
706.0 |
678.2 |
724.7 |
|||
Debtors |
4,725.0 |
5,726.0 |
2,497.0 |
1,961.0 |
2,055.0 |
1,684.0 |
1,715.3 |
1,852.6 |
|||
Cash & cash equivalents |
1,381.0 |
1,810.0 |
1,454.0 |
757.0 |
740.0 |
1,137.0 |
897.5 |
815.9 |
|||
Other (including assets held for sale) |
307.0 |
275.0 |
1,808.0 |
1,714.0 |
1,831.0 |
1,689.0 |
1,689.0 |
1,689.0 |
|||
Current Liabilities |
|
|
(6,804.0) |
(7,360.0) |
(3,753.0) |
(2,917.0) |
(3,274.0) |
(3,566.0) |
(3,505.6) |
(3,606.6) |
|
Creditors |
(5,026.0) |
(5,705.0) |
(2,319.0) |
(1,853.0) |
(1,964.0) |
(2,045.0) |
(1,984.6) |
(2,085.6) |
|||
Tax and social security |
(80.0) |
(110.0) |
(28.0) |
(77.0) |
(103.0) |
(127.0) |
(127.0) |
(127.0) |
|||
Short term borrowings |
(1,665.0) |
(1,347.0) |
(710.0) |
(244.0) |
(62.0) |
(514.0) |
(514.0) |
(514.0) |
|||
Lease liabilities |
0.0 |
(181.0) |
(108.0) |
(117.0) |
(111.0) |
(79.0) |
(79.0) |
(79.0) |
|||
Other (including liabilities held for sale) |
(33.0) |
(17.0) |
(588.0) |
(626.0) |
(1,034.0) |
(801.0) |
(801.0) |
(801.0) |
|||
Long Term Liabilities |
|
|
(1,424.0) |
(2,502.0) |
(1,766.0) |
(2,098.0) |
(2,088.0) |
(1,720.0) |
(1,720.0) |
(1,720.0) |
|
Long term borrowings |
(1,262.0) |
(1,707.0) |
(602.0) |
(854.0) |
(851.0) |
(425.0) |
(425.0) |
(425.0) |
|||
Lease liabilities |
0.0 |
(391.0) |
(971.0) |
(896.0) |
(788.0) |
(730.0) |
(730.0) |
(730.0) |
|||
Other long term liabilities |
(162.0) |
(404.0) |
(193.0) |
(348.0) |
(449.0) |
(565.0) |
(565.0) |
(565.0) |
|||
Net Assets |
|
|
3,373.0 |
3,751.0 |
4,866.0 |
4,354.0 |
4,300.0 |
4,069.0 |
4,161.7 |
4,386.0 |
|
Minority interests |
(162.0) |
(193.0) |
102.0 |
106.0 |
118.0 |
146.0 |
124.0 |
101.3 |
|||
Shareholders' equity |
|
|
3,211.0 |
3,558.0 |
4,968.0 |
4,460.0 |
4,418.0 |
4,215.0 |
4,285.7 |
4,487.2 |
|
CASH FLOW |
|||||||||||
Op Cash Flow before WC and tax |
1,095.0 |
1,084.0 |
968.0 |
440.0 |
346.0 |
210.0 |
623.8 |
825.7 |
|||
Working capital |
(406.0) |
(254.0) |
393.0 |
(44.0) |
194.0 |
579.0 |
(64.0) |
(82.6) |
|||
Exceptional & other |
656.0 |
865.0 |
859.0 |
672.0 |
755.0 |
822.0 |
617.8 |
704.1 |
|||
Tax |
(147.0) |
(169.0) |
(226.0) |
(94.0) |
(50.0) |
(131.0) |
(144.4) |
(196.5) |
|||
Net operating cash flow |
|
|
1,198.0 |
1,526.0 |
1,994.0 |
974.0 |
1,245.0 |
1,480.0 |
1,033.2 |
1,250.7 |
|
Capex |
(283.0) |
(258.0) |
(484.0) |
(396.0) |
(473.0) |
(567.0) |
(606.0) |
(649.3) |
|||
Acquisitions/disposals |
81.0 |
184.0 |
309.0 |
(76.0) |
(76.0) |
27.0 |
0.0 |
0.0 |
|||
Net interest |
(196.0) |
(231.0) |
(165.0) |
(127.0) |
(127.0) |
(104.0) |
(96.0) |
(92.0) |
|||
Equity financing |
0.0 |
0.0 |
0.0 |
0.0 |
0.0 |
0.0 |
0.0 |
0.0 |
|||
Dividends |
(111.0) |
(274.0) |
(220.0) |
(442.0) |
(152.0) |
(170.0) |
(243.7) |
(265.0) |
|||
Other |
(438.0) |
(648.0) |
(432.0) |
(408.0) |
(361.0) |
(304.0) |
(306.0) |
(306.0) |
|||
Net Cash Flow |
251.0 |
299.0 |
1,002.0 |
(475.0) |
56.0 |
362.0 |
(218.5) |
(61.6) |
|||
Opening net debt/(cash) |
|
|
2,033.0 |
1,623.0 |
1,336.0 |
453.0 |
811.0 |
563.0 |
313.0 |
552.5 |
|
FX |
27.0 |
24.0 |
29.0 |
(3.0) |
11.0 |
(6.0) |
0.0 |
0.0 |
|||
Other non-cash movements |
132.0 |
(36.0) |
(148.0) |
120.0 |
181.0 |
(106.0) |
(21.0) |
(20.0) |
|||
Closing net debt/(cash) |
|
|
1,623.0 |
1,336.0 |
453.0 |
811.0 |
563.0 |
313.0 |
552.5 |
634.1 |
|
Closing net debt/(cash) – continuing operations |
1,546.0 |
1,244.0 |
(142.0) |
341.0 |
173.0 |
(198.0) |
173.0 |
(198.0) |
|||
Source: Altron accounts, Edison Investment Research
|
|
Research: TMT
Checkit has announced a formal approach to the board of Crimson Tide, an AIM-listed provider of workflow management software, regarding a possible all-share offer for the company at a value of £12m. The Checkit board has attempted to engage the Crimson Tide board in constructive discussions several times over the last four years but discussions have never progressed. The company is announcing the terms of a possible offer to facilitate direct discussions with the shareholders of both companies before making a decision on whether to proceed with a firm offer. Checkit has until 5pm on 2 July to announce a firm intention to make an offer or announce that it does not intend to do so.