Track Group |
Better positioned |
FY15 and Q116 results |
Tech hardware & equipment |
15 February 2016 |
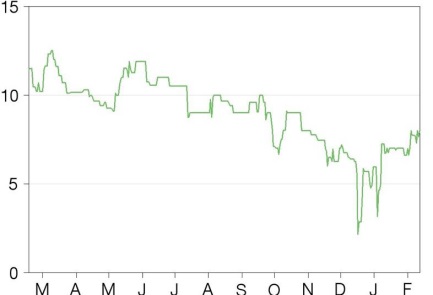
Share price performance
Business description
Next event
Analysts
Track Group is a research client of Edison Investment Research Limited |
|||||||||||||||||||||||||||||||||||||||||||||||
Track Group has restructured its business through the course of FY15 to create an end-to-end offender monitoring service. Several large contracts support organic growth and management continues to consider further acquisitions to expand the service offering. With debt refinanced and supply-chain processes streamlined, the business is in a stronger position to drive revenue growth, margins and cash flow.
Year end |
Revenue ($m) |
PBT* |
EPS* |
DPS |
P/E |
Yield |
09/14 |
12.3 |
(5.4) |
(54.4) |
0.0 |
N/A |
N/A |
09/15 |
20.8 |
(6.1) |
(59.8) |
0.0 |
N/A |
N/A |
09/16e |
28.1 |
(3.6) |
(35.2) |
0.0 |
N/A |
N/A |
09/17e |
42.0 |
2.8 |
27.2 |
0.0 |
28.2 |
N/A |
Note: *PBT and EPS are normalised, excluding exceptional items and share-based payments.
Restructuring designed to drive recurring revenue
Track Group has restructured its business to provide monitoring solutions to the corrections industry under a platform-as-a-service (PaaS) model, which it expects will create significant competitive advantage as it strives to acquire new contracts and grow recurring revenue. Track has also restructured $28m of short-term debt (due 2016) into $30.4m maturing in July 2018, improving its financial flexibility, in our view.
FY15 revenues boosted by M&A and large contract
Track reported 70% y-o-y revenue growth in FY15, showing the effect of recent acquisitions and the $3.9m contribution from the contract with the Chilean prison service. The company reported a net loss of $5.7m. Taking into account one-off items, Track reported adjusted EBITDA of $1.2m (6% margin).
Outlook is for rapid margin expansion
Company guidance suggests strong revenue growth and EBITDA margin expansion over FY16/FY17. We have revised our forecasts, conservatively assuming the company generates revenues and EBITDA at the lower end of the guidance range in both years. Q116 revenues of $6.3m (+36.7% y-o-y, +6.8% q-o-q) showed progress towards FY16 guidance. News of large monitoring contracts and sales of analytics solutions to existing and new customers will be crucial to track progress towards these targets.
Valuation: Contract wins key
Our reverse DCF suggests that the current valuation prices in a revenue CAGR of 15.5% to c $88m in 2025 with EBITDA margins reaching 25% at this time. To put this into context, we believe this could be achieved through securing three or four significant contracts similar in size to Chile over the next 10 years. The securing of further national/state-wide deals is therefore a key catalyst, as this could put Track Group ahead of this growth curve and improve commercial credentials.
Business update
Track Group’s tracking solutions blend real-time GPS tracking devices with around-the-clock monitoring and data analytics for the global offender management market. This encompasses the monitoring of parolees/probationers under community supervision orders (for both corrections and military organisations) and the monitoring of defendants pre-trial (for law enforcement). Over the past couple of years, the company has transitioned its business through a series of M&A transactions (see Exhibit 1).
Strategy: Providing end-to-end monitoring services
The company’s strategy is to expand its offerings on a subscription basis to provide an end-to-end offender management solution to support re-socialisation, monitoring and predictive analytics for offenders. Management wants to grow its portfolio of proprietary and non-proprietary real-time monitoring and intervention products through a combination of internal development and acquisition. The company’s expertise and hence current focus is on the offender management market. However, its tracking/monitoring technology could ultimately be applied to other verticals such as the home care market (for seniors or sufferers of Alzheimer’s) or asset tracking.
Reshaping the business
Track Group began operations primarily as a manufacturer producing the actual tracking device. In a strategic repositioning, through the acquisitions outlined below and restructuring of the procurement process, Track Group has transitioned its business to a service and analytics model. Although the company continues to produce the devices, management’s focus has shifted to providing an end-to-end service to the corrections industry.
Subscription-led model drives up proportion of recurring revenues
As electronic monitoring is a competitive area, Track Group aims to differentiate itself by providing a package of services from which its customers can select on a PaaS basis. This includes the basic tracking devices, add-ons including an alcohol monitoring device, monitoring services and/or analytics services.
The business model enables the company to generate recurring revenue from subscription contracts. This approach enables recurring and higher margin revenue compared to one-time sales of physical tracking devices. As a result, management expects the transition to this model to both accelerate revenue growth and lead to improved margins and cash flows.
Acquisitions broaden product offering and customer base
Exhibit 1: Recent acquisitions
Date |
Name |
Description |
Cost |
Mar-14 |
GPS Global |
Advanced electronic monitoring technology & platform |
$311k cash, $4.5m equity (issued), $3m equity (contingent) |
Jun-14 |
Emerge Monitoring |
Real-time alcoholic monitoring technology |
$7.7m cash |
Nov-14 |
G2 Research |
Device-agnostic analytics |
C$2m cash, C$0.6m equity (deferred), C$2m equity (contingent) |
Source: Track Group
■
GPS Global: this acquisition gives Track access to GPS Global’s Shadow device technology. The device has a much higher proportion of pre-built components than Track’s legacy ReliAlert device, which means that assembly and manufacturing costs are significantly lower. We note that while Track expects to replace ReliAlert tags with Shadow tags, the Shadow tag at present cannot be used where customers need voice communication-enabled tags.
■
Emerge Monitoring: this acquisition expanded the company’s customer base in the US (adding c 1,500 subscribers in FY14) and added a real-time alcohol monitoring system (RADAR).
■
G2 Research: this deal gives Track Group the ability to provide analytics for the monitoring data collected by its customers. The technology is device agnostic, which means that in addition to its existing customer base, Track could sell analytics solutions to organisations that use competitor tracking devices. G2’s customer base includes national security, law enforcement, community corrections, and health research organisations. The analytics services may also be developed to provide advanced warnings of crimes that may be committed by people wearing tags, based on their location and previous movements. This could be a key selling point for Track Group’s devices and could help maintain daily lease rates and win new customers. Analytics solutions are sold as recurring contracts or as ad-hoc projects.
With the company’s stated aim of broadening its product offering through internal development and M&A, we expect the company will make additional acquisitions.
Large contracts drive monitoring revenue growth
Chilean prison service contract well underway
In November 2013 Track Group signed a substantial contract with the Chilean prison service to supply up to 9,400 devices over 41 months, with the contract worth up to $70m revenue (assuming 100% utilisation of the 9,400 tags). A $3.4m performance bond was posted by Track Group as a condition of the contract and will be returned on successful completion. In FY15, this contract generated revenues of $3.9m (19% of total FY15 revenues) as tags were rolled out. We expect continued growth in the number of tags in use through FY16 and FY17.
New contract with Virginia DoC
In October 2015, Track Group was awarded a contract by the Virginia Department of Corrections (DoC) to provide monitoring services. The contract calls for Track Group to deliver solutions based on GPS and biometric voice verification technology designed to monitor more than 16,000 offenders and defendants. At the end of 2014, Virginia had 37,544 inmates incarcerated, with an additional 1,732 on parole and 54,966 on probation (source: Bureau of Justice Statistics).
The contract has a minimum term of two years, with four one-year extensions at Virginia’s option, for a total term of six years. The contract is valued at an estimated $11.3m over the six years. In addition, the contract allows other state agencies to secure monitoring services without a formal bidding process, which management believes could also enhance the company’s opportunities in Virginia. Successful execution of this contract could facilitate further expansion within the state and in contiguous markets.
Growing track record could help secure additional large contracts
We understand from management that there are a number of substantial contracts coming up for tender over the next few years; if Track Group can win some of these contracts it could prove transformational for the business. The company has indicated that the process to win the Chilean contract was extremely competitive and that Track Group won because it was able to demonstrate more consistent and intense oversight of the offenders being monitored. Management believes this win could lead to additional contracts in other markets. Track’s share of the US and international electronic monitoring markets is low, providing plenty of scope to grow.
Financials
Review of FY15 results
Track Group reported revenue growth of 70% in FY15. The Chilean contract generated revenues of $3.9m in the year (from zero in FY14) and we estimate that the remaining c $4m revenue increase was generated by the recently acquired businesses and a small improvement in the legacy Track Group business. The company noted that tag subscriptions grew from 6,400 at the end of FY14 to more than 10,000 at the end of FY15 – we estimate that the majority of this increase was from the roll-out of the Chilean contract.
Gross margin increased to 60.2%, showing an upwards progression through the year (Q1 55.7%, Q2 57.9%, Q3 62.0%, Q4 63.5%), helped by the contribution of higher-margin analytics sales from the G2 Research acquisition. During FY15, the business began using an external fulfilment service provider so now it no longer assembles, repairs, or processes inventory or monitoring equipment – this has also contributed to the improved margin.
In “Other Income”, the company reported $4.9m of disgorgement profits – we treat this as a one-off credit. The company paid a small amount of tax in several overseas territories; in the US the company has unrecognised tax losses worth $142m (these start to expire from 2020).
Exhibit 2: Track Group FY15 results highlights
$m |
FY15 |
FY14 |
y-o-y |
Revenues |
20.8 |
12.3 |
69.6% |
Gross profit |
12.5 |
6.8 |
85.0% |
Gross margin |
60.2% |
55.2% |
9.1% |
Company adjusted EBITDA |
1.2 |
-2.1 |
|
Operating profit |
-8.2 |
-7.7 |
6.2% |
Normalised net income |
-6.1 |
-5.4 |
|
Net income |
-5.7 |
-8.7 |
-35.2% |
Normalised EPS (c) |
-59.8 |
-54.4 |
-9.9% |
Reported EPS (c) |
-55.8 |
-87.9 |
36.5% |
Net debt |
26.1 |
19.4 |
34.6% |
Source: Track Group, Edison Investment Research
Review of Q116 results
On 9 February, the company reported Q116 results. The table below shows the key data:
Exhibit 3: Quarterly results highlights
$m |
Q116 |
Q115 |
y-o-y |
Revenues |
6.3 |
4.6 |
36.7% |
Gross profit |
3.9 |
2.6 |
51.0% |
Gross margin |
61.5% |
55.7% |
5.8% |
Loss from operations |
(1.4) |
(1.6) |
14.6% |
Net loss |
(2.1) |
(2.2) |
4.0% |
EPS ($) |
(0.21) |
(0.22) |
4.5% |
Net debt |
28.0 |
25.2 |
11.1% |
Source: Track Group
Revenue growth of 36.7% was driven by the growth in monitoring devices in the Americas (we assume this was mainly due to the Chile contract) and to a lesser extent the impact of the G2 Research acquisition (November 2014). The company noted that it had expanded deployment of its data analytics service to Detroit, Indianapolis and Philadelphia, also contributing to growth.
The company provided a reconciliation of net income to adjusted EBITDA.
Exhibit 3: EBITDA reconciliation
$m |
FY15 |
FY14 |
Q116 |
Q115 |
Net loss |
(5.67) |
(8.76) |
(2.13) |
(2.22) |
Interest expense |
2.54 |
0.92 |
0.70 |
0.67 |
Dividends on Series D preferred stock |
0.00 |
0.01 |
0.00 |
0.00 |
Tax |
0.02 |
0.06 |
0.01 |
0.00 |
Depreciation & amortisation |
4.40 |
2.43 |
1.19 |
1.08 |
Impairment |
0.23 |
0.37 |
0.06 |
0.06 |
Stock based compensation |
1.70 |
1.49 |
0.36 |
0.08 |
M&A costs |
0.43 |
1.18 |
0.00 |
(0.07) |
Other non-cash charges |
0.42 |
0.25 |
0.16 |
0.00 |
Non-recurring one-time charges |
1.85 |
0.00 |
0.00 |
0.00 |
Non-recurring one-time benefits |
(4.70) |
0.00 |
0.00 |
0.00 |
Adjusted EBITDA |
1.23 |
(2.04) |
0.34 |
(0.39) |
Adjusted EBITDA margin |
5.9% |
-16.7% |
5.3% |
-8.5% |
Source: Track Group
Operating expenses totalled $20.7m for FY15, up from $14.5m in FY14. Stripping out the one-off charges as per the reconciliation, we estimate “clean” operating expenses totalled $16.1m in FY15 ($11.2m FY14) and $13.2m excluding depreciation and amortisation ($9.6m FY14). The majority of the increase in costs will have been from the recent acquisitions. For Q116, clean operating expenses totalled $4.7m ($4.1m Q115) or $4.0m excluding depreciation ($3.5m Q115).
Outlook and changes to forecasts
The company has provided the following guidance:
Exhibit 4: Company guidance
FY16e |
FY17e |
|
Revenues |
$28-31m |
$42-47m |
Adjusted EBITDA |
15-20% |
25-30% |
Source: Track Group
We have revised our forecasts to reflect the low end of the range for both years. To achieve the low end of FY16 guidance, we expect the number of subscribers on the Chile contract to continue to grow and the Virginia DoJ contract to start to contribute. The acquisition of G2 Research also adds a combination of one-off project revenues and recurring revenues. On the Q1 revenue run rate, with no additional growth, Track Group would achieve FY16 revenues of $25.3m.
For FY17, we expect the company to earn revenues closer to $2m from the Virginia contract, with additional growth from Chile and growth in sales of analytics solutions.
Exhibit 5: Changes to forecasts
$m |
FY16e old |
FY16e new |
diff |
FY17e new |
Revenues |
32.8 |
28.1 |
-14.3% |
42.0 |
Gross profit |
21.4 |
18.3 |
-14.6% |
28.1 |
Gross margin |
65.3% |
65.0% |
-0.3% |
67.0% |
Adjusted EBITDA |
13.4 |
4.2 |
-68.6% |
10.8 |
Adjusted EBITDA margin |
41.0% |
15.0% |
-26.0% |
25.8% |
Normalised operating profit |
9.1 |
-0.7 |
-108.2% |
5.6 |
Normalised net income |
7.5 |
-3.6 |
-148.3% |
2.8 |
Net income |
4.1 |
-5.8 |
-239.5% |
0.7 |
Normalised EPS (c) |
74.0 |
-35.2 |
-147.6% |
27.2 |
Reported EPS (c) |
40.9 |
-56.2 |
-237.4% |
7.0 |
Net debt |
15.5 |
26.7 |
72.6% |
23.2 |
Source: Edison Investment Research
Cleaner balance sheet
In FY15 Track Group restructured its $28m of short-term unsecured debt maturing in 2016 into $30.4m maturing in July 2018 with the same lender, Conrent Invest. The 8% interest rate remains unchanged. Most of the additional $2.4m in financing relates to fees and interest accrued through to January 2016. Track Group’s amended debt facility also provides the company with a voluntary prepayment option that allows Track Group to prepay all principal and interest before July 2018 without incurring a penalty or prepayment fee.
Subsequently, Track Group entered into an agreement with Sapinda Asia for a $5m unsecured revolver that incurs interest at 8% pa on borrowed funds and 3% on the untapped amount outstanding on the revolver. Sapinda Asia is a major shareholder of Track Group. In our view the refinancing improves the company’s financial flexibility and should make it easier to finance future transactions. The company ended FY15 with cash of $4.9m versus $11.1m at the end of FY14.
The company needs capital to pursue strategic M&A to complement its organic growth initiatives. Earlier this month, the board and major shareholder approved an amendment to enable Track Group to issue up to 30m common shares from the previous authorization of 15m. We note that the company is pursuing an up-listing to a regulated exchange – this should provide the company with improved access to funding.
Valuation
If Track Group can follow up the Chilean and Virginia DoC contracts by securing further state or nationwide deals, we believe there is clear potential to drive upside. The opportunity for electronic monitoring of offenders is clearly substantial and there is further potential in other verticals such as healthcare and logistics, although the pace of growth and ultimate potential market size is difficult to quantify. Given Track’s comparatively early stage of development and the lack of direct peers, we believe that a reverse DCF provides the best gauge as to what the company needs to achieve to both justify its current valuation and drive further upside.
Reverse DCF
Our reverse DCF suggests that the current valuation prices in a revenue CAGR of 15.5% to c $88m in 2025 with EBITDA margins reaching 25% at this time. Revenue CAGR from 2017 to 2025 (ie after our explicit forecast period) is 9.7%. Our revenue forecasts assume annual growth of devices in use falling to 10% by 2025 before churn of 8%, with a declining daily lease price. In addition, we have factored in a CAGR of 8% for other revenues (which incorporates analytics and product sales) from 2017-2025. We estimate that this could be achieved through rolling-out and retaining only three or four significant contracts similar in volume size to Chile over the next 10 years. Our DCF assumes a WACC of 10% and terminal growth of 2%. There is a high degree of uncertainty in these assumptions and therefore it is useful to look at a range of revenue growth rates and terminal EBITDA margins (Exhibit 6). Varying the WACC by +1%/-1% impacts the valuation by -16%/+20%.
Exhibit 6: Sensitivity analysis – EBITDA margins
Revenue growth rate in 2017 |
|||||||
EBITDA Margin |
$ 7.7 |
26.0% |
31.0% |
36.0% |
41.0% |
46.0% |
51.0% |
15.0% |
3.2 |
3.4 |
3.7 |
4.0 |
4.4 |
4.7 |
|
20.0% |
4.6 |
5.0 |
5.4 |
5.8 |
6.3 |
6.9 |
|
25.0% |
6.1 |
6.6 |
7.1 |
7.7 |
8.3 |
9.0 |
|
30.0% |
7.6 |
8.1 |
8.8 |
9.5 |
10.2 |
11.1 |
|
35.0% |
9.0 |
9.7 |
10.4 |
11.3 |
12.2 |
13.2 |
|
Source: Edison Investment Research
Peer group multiples analysis
In the table below, we compare Track Group’s valuation to a selection of peers. They range from large companies where electronic monitoring is a small proportion of the business (3M, G4S) to smaller companies that are active in the wider tracking market. Assuming that Track Group is able to achieve the revenues and profitability in its recent outlook statement (our forecasts assume it reaches the low end of the range in FY16 and FY17), the valuation looks in line with the peer group on an EV/Sales and EV/EBITDA basis. If the company is able to reach the top end of its guidance range, this could drive share price upside.
Exhibit 7: Peer group valuation
Company |
Market Cap ($m) |
Current EV/S |
Next EV/S |
Current EV/ EBITDA |
Next EV/ EBITDA |
Current P/E |
Next P/E |
Current EBITDA margin |
Next EBITDA margin |
Track Group |
78.5 |
3.7x |
2.5x |
24.8x |
9.7x |
N/A |
28.2x |
15.0% |
25.8% |
3M Co |
91,969.0 |
3.3x |
3.2x |
11.4x |
10.9x |
18.2x |
16.7x |
29.1% |
29.5% |
G4S PLC |
4,485.0 |
0.7x |
0.6x |
7.8x |
7.4x |
12.0x |
11.1x |
8.5% |
8.6% |
Numerex |
106.6 |
1.3x |
1.2x |
11.3x |
7.1x |
70.0x |
80.0x |
11.7% |
17.4% |
SuperCom |
77.5 |
3.2x |
2.4x |
12.7x |
9.5x |
9.7x |
6.8x |
25.4% |
25.3% |
Trakm8 Holdings PLC |
112.7 |
3.0x |
2.5x |
17.6x |
13.3x |
19.0x |
12.9x |
17.0% |
18.7% |
Average |
2.3x |
2.0x |
12.2x |
9.6x |
25.8x |
25.5x |
18.3% |
19.9% |
|
Excl outlier |
14.7x |
11.9x |
Source: Edison Investment Research, Bloomberg. Note: Priced at 11 February 2016.
Exhibit 8: Financial summary
$'000s |
2013 |
2014 |
2015 |
2016e |
2017e |
||
30-September |
US GAAP |
US GAAP |
US GAAP |
US GAAP |
US GAAP |
||
PROFIT & LOSS |
|||||||
Revenue |
|
|
15,641 |
12,262 |
20,793 |
28,096 |
41,987 |
Cost of Sales |
(8,030) |
(5,499) |
(8,282) |
(9,838) |
(13,839) |
||
Gross Profit |
7,611 |
6,763 |
12,511 |
18,258 |
28,148 |
||
EBITDA |
|
|
2,966 |
(1,992) |
807 |
4,211 |
10,830 |
Company adjusted EBITDA |
|
|
|
(2,045) |
1,225 |
4,211 |
10,830 |
Operating Profit (before amort. and except.) |
552 |
(4,450) |
(3,593) |
(746) |
5,630 |
||
Exceptionals & share-based payments |
(1,549) |
(3,298) |
(4,633) |
(2,155) |
(2,069) |
||
Operating Profit |
(998) |
(7,748) |
(8,225) |
(2,901) |
3,561 |
||
Net Interest |
(1,094) |
(922) |
(2,542) |
(2,798) |
(2,805) |
||
Profit Before Tax (norm) |
|
|
(412) |
(5,358) |
(6,055) |
(3,587) |
2,825 |
Profit Before Tax (US GAAP) |
|
|
(17,916) |
(8,692) |
(5,648) |
(5,742) |
756 |
Tax |
0 |
(56) |
(20) |
(29) |
(38) |
||
Profit After Tax (norm) |
(412) |
(5,413) |
(6,076) |
(3,616) |
2,787 |
||
Profit After Tax (US GAAP) |
(17,916) |
(8,748) |
(5,669) |
(5,771) |
718 |
||
Average Number of Shares Outstanding (m) |
4.8 |
10.0 |
10.2 |
10.3 |
10.3 |
||
EPS - normalised (c) |
|
|
(8.5) |
(54.4) |
(59.8) |
(35.2) |
27.2 |
EPS - normalised fully diluted (c) |
|
|
(8.5) |
(54.4) |
(59.8) |
(35.2) |
27.2 |
EPS - (US GAAP) (c) |
|
|
(370.8) |
(87.9) |
(55.8) |
(56.2) |
7.0 |
Dividend per share (c) |
0.0 |
0.0 |
0.0 |
0.0 |
0.0 |
||
Gross Margin (%) |
48.7 |
55.2 |
60.2 |
65.0 |
67.0 |
||
EBITDA Margin (%) |
19.0 |
-16.2 |
3.9 |
15.0 |
25.8 |
||
Operating Margin (before GW and except.) (%) |
3.5 |
-36.3 |
-17.3 |
-2.7 |
13.4 |
||
BALANCE SHEET |
|||||||
Fixed Assets |
|
|
17,167 |
40,247 |
40,768 |
38,533 |
35,698 |
Intangible Assets |
15,414 |
33,321 |
33,667 |
30,405 |
26,223 |
||
Tangible Assets |
1,583 |
3,775 |
4,482 |
5,509 |
6,856 |
||
Other fixed assets |
170 |
3,150 |
2,619 |
2,619 |
2,619 |
||
Current Assets |
|
|
9,532 |
17,638 |
13,262 |
12,460 |
19,697 |
Stocks |
467 |
1,248 |
742 |
600 |
600 |
||
Debtors |
5,506 |
5,014 |
7,311 |
8,236 |
11,745 |
||
Cash |
3,382 |
11,102 |
4,903 |
3,318 |
7,045 |
||
Other |
176 |
274 |
306 |
306 |
306 |
||
Current Liabilities |
|
|
(2,695) |
(6,315) |
(5,865) |
(6,173) |
(7,631) |
Creditors |
(2,547) |
(4,409) |
(5,069) |
(6,173) |
(7,631) |
||
Short term borrowings |
(148) |
(1,906) |
(796) |
0 |
0 |
||
Long Term Liabilities |
|
|
(41) |
(31,654) |
(33,797) |
(33,517) |
(33,740) |
Long term borrowings |
(41) |
(28,568) |
(30,189) |
(30,016) |
(30,239) |
||
Other long term liabilities |
0 |
(3,085) |
(3,608) |
(3,501) |
(3,501) |
||
Net Assets |
|
|
23,963 |
19,916 |
14,368 |
11,304 |
14,023 |
CASH FLOW |
|||||||
Operating Cash Flow |
|
|
1,933 |
(4,389) |
(679) |
2,001 |
6,130 |
Net Interest |
(1,094) |
(193) |
(237) |
0 |
0 |
||
Tax |
0 |
0 |
0 |
(29) |
(38) |
||
Capex |
(560) |
(1,874) |
(2,456) |
(2,765) |
(2,365) |
||
Acquisitions/disposals |
0 |
(8,050) |
(1,783) |
0 |
0 |
||
Financing |
2,646 |
(3,217) |
(11) |
0 |
0 |
||
Dividends |
0 |
0 |
0 |
0 |
0 |
||
Net Cash Flow |
2,924 |
(17,723) |
(5,165) |
(792) |
3,727 |
||
Opening net debt/(cash) |
|
|
14,716 |
(3,194) |
19,373 |
26,082 |
26,698 |
Other |
14,986 |
(4,843) |
(1,545) |
177 |
(223) |
||
Closing net debt/(cash) |
|
|
(3,194) |
19,373 |
26,082 |
26,698 |
23,194 |
Source: Track Group, Edison Investment Research
|
Research: Investment Companies
Utilico Emerging Markets Limited