Last close As at 05/08/2026
—
— 0.00 (0.00%)
Market capitalisation
—
Research: Financials
Numis has continued to build its franchise against a difficult market background, with net additions to its corporate client roster during FY19 and market share gains within its equities business. Lack of corporate activity meant the return on equity was reduced to 7% last year but, on a medium-term view, there are good prospects for a substantial improvement, with a return to the five-year average of 18% not an unreasonable aspiration.
Written by
Numis Corporation |
Tough times but a positive start to FY20 |
FY19 results and outlook |
Financial services |
11 December 2019 |
Share price performance
Business description
Next events
Analysts
Numis Corporation is a research client of Edison Investment Research Limited |
|||||||||||||||||||||||||||||||||||||||||||||||
Numis has continued to build its franchise against a difficult market background, with net additions to its corporate client roster during FY19 and market share gains within its equities business. Lack of corporate activity meant the return on equity was reduced to 7% last year but, on a medium-term view, there are good prospects for a substantial improvement, with a return to the five-year average of 18% not an unreasonable aspiration.
Year end |
Revenue (£m) |
PBT* |
EPS* |
DPS |
P/E |
Yield |
09/17 |
130.1 |
38.3 |
25.9 |
12.0 |
10.0 |
4.6 |
09/18 |
136.0 |
31.6 |
23.0 |
12.0 |
11.2 |
4.6 |
09/19 |
111.6 |
12.4 |
8.1 |
12.0 |
31.9 |
4.6 |
09/20e |
125.5 |
21.1 |
15.1 |
12.0 |
17.1 |
4.6 |
Note: *PBT and EPS are on a reported basis and EPS is fully diluted.
FY19 results mainly in line
Revenues were down 18% on the prior year, in line with the indication given in the year-end trading update. Costs were controlled, with staff costs down 14% and total administrative costs 8% lower. Even so, PBT was down 61% to £12.4m, reflecting operational gearing and the impact of valuation write-downs in the investment portfolio (£2.2m), the main variation from our estimate. Diluted EPS were 65% lower at 8.1p and the full year dividend was maintained at 12p. The balance sheet remains strong with no debt and cash of £84.2m (FY18: £111.7m). Numis continued to add to its corporate client portfolio (a net increase of seven to 217), with new additions having a higher average market cap than departures. It notes that it has made market share gains in equities and that research payments have been resilient against a tough background.
Background difficult, but good start to FY20
While the background remains difficult with political uncertainty damping corporate activity, the first two months of the fiscal year have seen an encouraging start with revenues across the business ahead of the same period last year. There have been fund-raisings for Bovis Homes and Future, an advisory mandate on a £1.5bn M&A transaction and a significant (unnamed) private transaction. Numis remains a prime potential beneficiary of greater political certainty in the UK and a revival of confidence among its corporate and institutional client base.
Valuation reflects only part of the recovery potential
The prospective P/E multiple of over 17x and implied market ROE assumption of over 15% (see page 9) appear high at first sight, but arguably only discount part of the recovery and longer-term growth potential for Numis.
Keeping a focus on longer-term growth
Formation and development
Founded in the late 1980s by former CEO Oliver Hemsley, Numis was listed on AIM in 1996. It has grown to become a leading UK corporate advisory and stockbroking business and has set its vision as becoming ‘the investment bank of a generation’. The current co-CEOs, Alex Ham and Ross Mitchinson, joined the company in 2005 and 2008 respectively and assumed their roles in September 2016. Oliver Hemsley stepped down from the board and all executive responsibilities in May 2017.
A growing franchise
Numis has achieved a steady increase in the number of corporate clients with an accompanying increase in their average market capital: at the end of FY19 there were 217 clients with an average market cap of £888m (Exhibit 1). While the average size has increased and it now numbers seven FTSE 100 and 47 FTSE 250 companies among its clients, Numis has not given up its traditional strength in small-cap and mid-cap broking. The group has ranked number one in the Extel survey for UK small- and mid-caps for seven years. The strength of the research and sales team has also been evidenced by retention of the institutional client base and broad maintenance of research revenues following the implementation of MiFID II and the increased downward pressure on institutional research budgets that has accompanied this.
Revenue CAGR of 14% since FY12 despite difficult FY19
The evolution of revenues since FY12 is shown in Exhibit 2, with the growth in corporate client numbers feeding through to significant revenue growth until FY18. Even after the market-induced slowdown seen in FY19, compound annual growth in retainer, advisory and capital markets fees (investment banking segment) over the period shown was 20%. Last year capital markets fees alone accounted for 43% of total revenue, bolstered by a contribution of about eight percentage points from private transactions, a newer area of development for the group. Institutional commissions accounted for 30% of the total, while compound growth here has been limited to 8% by persistent pressure on commission rates and subdued market activity during FY19. As would be expected, trading has seen fluctuations in income but has contributed positively in each year, with the reduction in income seen last year largely arising from a one-off loss.
|
Exhibit 1: Corporate client numbers and market caps |
Exhibit 2: Revenue progression (year to 30 September) |
|
|
|
Source: Numis, Edison Investment Research |
|
Exhibit 1: Corporate client numbers and market caps |
|
|
Source: Numis, Edison Investment Research |
|
Exhibit 2: Revenue progression (year to 30 September) |
|
|
Source: Numis, Edison Investment Research |
The largest element of cost for the business is staff remuneration and for most of the period since 2012 the compensation ratio has remained close to the average value of 54%. Even though it rose in the more difficult years (FY12 and FY19), flexibility provided by the variable element of compensation contained the increase and limited the impact of lower revenues on the overall cost/income ratio. As a result of this discipline, an operating profit margin of between 22% and 29% was maintained for FY13–18, while in FY12 and FY19, when revenues were depressed, the margin was 7.5% and 10.6% respectively.
|
Exhibit 3: Cost ratios |
Exhibit 4: Average headcount and revenue per head |
|
|
|
Source: Numis, Edison Investment Research |
|
Exhibit 3: Cost ratios |
|
|
Source: Numis, Edison Investment Research |
|
Exhibit 4: Average headcount and revenue per head |
|
|
Source: Numis, Edison Investment Research |
The group undertook significant investment in staff recruitment during FY18 to support service levels to existing clients and further growth in the business. Additions were made in both the investment banking and equities businesses and the period-end headcount increased by 16% to 277. As shown in Exhibit 4, this contributed to marked growth in the average headcount in both FY18 and FY19, resulting in lower revenue per head, particularly in FY19 given the market-related reversal in revenues.
Looking through the near-term fluctuation in revenues and reflecting the group’s longer-term ambition, Numis remains committed to its strategy for achieving growth in the franchise by implementing the steps outlined below.
Steps to deliver the vision
In order to achieve the group’s overall vision of becoming the investment bank of a generation, management has identified five strategic pillars which, if successfully executed, should secure sustainable growth (subject to market cycles), profitability and attractive shareholder returns
1.
Build the size and quality of the corporate franchise. The aim here is to build further on the group’s development to date. Numis focuses on the quality of clients and aspires to attract corporates across a range of market capitalisations, and to provide a natural home for interesting and ambitious small caps.
2.
Become the leading UK equities platform. Numis is seeking to gain market share in UK equities and equity capital markets activity, and to maintain its number one Extel ranking.
3.
Develop complementary products and services. Under this heading the company looks to increase its advisory revenues, develop a position as a leader in private markets and, over time, generate significant revenues from new areas.
4.
Maintain operating and capital discipline. Additions to staff during FY18 and the prospective move to a new headquarters office expected in H221 have and will increase costs, but these measures are intended to support service provision to clients and to facilitate the longer-term development of the business.
5.
Deliver shareholder returns. The first four pillars are intended to result in the generation of revenue growth and a more stable margin and attractive return for shareholders over the cycle. The group’s commitment to the use of share buybacks to offset share issuance for staff compensation and to return excess cash should also contribute positively to returns and the level of earnings per share.
FY19 results
The revenue decline of 18% for FY19 versus FY18 was in line with the group’s indication in its year-end trading update. On the other income line there was a £3.9m swing from profit to loss arising from valuation write-downs in the investment portfolio and as a result total income was 21% lower. Costs fell by 8% driven by a 14% reduction in staff costs, which in turn reflected lower variable compensation. This left pre-tax profits down by 61% and EPS 65% lower after a higher effective tax rate of 25% versus 16%. Exhibit 5 provides a summary of the figures including the revenue analysis with additional comments noted below. Figures are compared with FY18 unless stated.
Exhibit 5: Five-year profit and loss analysis
£m unless stated |
FY15 |
FY16 |
FY17 |
FY18 |
FY19 |
Change FY19/FY18 |
Net trading gains |
4.1 |
6.5 |
9.0 |
9.6 |
4.0 |
-58.2% |
Institutional income |
29.3 |
31.9 |
35.8 |
37.9 |
33.3 |
-12.0% |
Equities |
33.4 |
38.4 |
44.8 |
47.5 |
37.3 |
-21.4% |
Corporate retainers |
8.9 |
9.6 |
11.6 |
12.4 |
13.4 |
7.5% |
Advisory fees |
17.9 |
16.3 |
14.4 |
17.3 |
12.6 |
-27.5% |
Capital markets |
37.7 |
48.0 |
59.4 |
58.8 |
48.4 |
-17.8% |
Investment banking |
64.6 |
73.9 |
85.3 |
88.6 |
74.3 |
-16.1% |
Total revenue |
98.0 |
112.3 |
130.1 |
136.0 |
111.6 |
-18.0% |
Other operating income |
(2.0) |
3.8 |
3.4 |
1.7 |
(2.2) |
-227.5% |
Total income |
96.0 |
116.1 |
133.5 |
137.8 |
109.4 |
-20.6% |
Staff costs |
(47.4) |
(58.9) |
(69.0) |
(75.3) |
(64.5) |
-14.3% |
Non-staff costs |
(22.7) |
(24.7) |
(26.4) |
(31.0) |
(33.0) |
6.3% |
Total administrative expenses |
(70.1) |
(83.6) |
(95.4) |
(106.3) |
(97.5) |
-8.3% |
Operating profit / loss |
25.9 |
32.5 |
38.1 |
31.4 |
11.9 |
-62.2% |
Finance income/expense |
0.2 |
0.0 |
0.2 |
0.2 |
0.6 |
159.4% |
Pre-tax profit |
26.1 |
32.5 |
38.3 |
31.6 |
12.4 |
-60.7% |
Tax |
(4.5) |
(6.1) |
(7.9) |
(5.0) |
(3.1) |
-37.4% |
Effective tax rate |
17.4% |
18.8% |
20.7% |
15.7% |
25.0% |
59.3% |
Attributable profit |
21.5 |
26.4 |
30.4 |
26.7 |
9.3 |
-65.0% |
Diluted EPS (p) |
18.3 |
22.4 |
25.9 |
23.0 |
8.1 |
-64.7% |
Dividend (p) |
12.0 |
12.0 |
12.0 |
12.0 |
12.0 |
0.0% |
Source: Numis, Edison Investment Research
■
Equities revenue was down 21% with £5.6m of the £10.1m decline arising in trading income, where the main driver was a loss associated with the underwriting of the Kier rights issue in the first half. Institutional income was affected by lower activity levels but, positively, the company reported that UK equities market share increased and research payments were stable in the face of continued downward pressure on institutional research budgets following the implementation of MiFID II (January 2018).
■
Investment banking saw a 16% reduction in overall revenues, with capital markets down 18% reflecting lower market activity (see background comments below). The decline here would have been substantially greater but for the contribution of c £9m from private transactions including a $460m fund-raising for Klarna (Swedish fintech business). Numis has been developing this area for several years but a refocus on later-stage transactions appears to have paid off handsomely. Advisory income (-28%) was affected by the lower incidence of M&A activity involving Numis clients, another symptom of the uncertain political backdrop.
■
The £2.2m negative item (other operating income) relating to the investment portfolio arose from valuation write-downs prompted by estimate revisions or, in one case, a fund-raising at a lower value. The portfolio value at the year-end was £14.9m and comprises strategic investments in a range of mainly early-stage unquoted investments, where Numis believes it can use its network to help develop the businesses.
■
The full year dividend was unchanged at 12p/share. The group aims to pay a stable dividend while remaining committed to returning excess cash to shareholders and mitigating the dilutive impact of share awards; during the year £12m (£16.3m) was spent on buying back shares.
Background and outlook
The charts below set the scene by showing the trends in money raised (new and further) on the main and AIM markets of the London Stock Exchange since 2010; the figures for 2019 are up to the end of November. The number of new issues and value of total issuance for the 11 months to end November 2019 versus the prior year period were down 41% and 15% respectively on the main market, with steeper declines of 76% and 40% for AIM. For the period of Numis’s financial year, the trends for AIM were broadly similar but the main market saw a modest increase in value of total issuance (+7%), while the number of new issues was down 12% reflecting a more concentrated market opportunity.
|
Exhibit 6: LSE main market issuance and IPO count |
Exhibit 7: LSE AIM issuance and new issue count |
|
|
|
Source: London Stock Exchange. Note: 2019 to end November |
|
Exhibit 6: LSE main market issuance and IPO count |
|
|
Source: London Stock Exchange. Note: 2019 to end November |
|
Exhibit 7: LSE AIM issuance and new issue count |
|
|
Source: London Stock Exchange. Note: 2019 to end November |
Next we look at recent equity market performance and trading volumes. The table below shows the performance of the FTSE All-Share, SmallCap and AIM All-Share indices for Numis’s FY19 and FY20 ytd periods. For FY19, the main feature is the much greater weakness shown in the AIM index perhaps reflecting concerns over the domestic outlook combined with repercussions of the collapse of Woodford IM and related liquidity concerns. In the period since end September, the movements are small but the small-cap and AIM indices are ahead and the All-Share down, perhaps a reflection of changing political expectations ahead of the UK general election and the strengthening of sterling that has accompanied this.
Exhibit 8: Equity indices recent performance
FTSE All-Share |
FTSE Small cap |
FTSE AIM All-Share |
|
FY19 |
-2% |
-6% |
-21% |
FY20 ytd |
-2% |
2% |
4% |
From five-year high |
-8% |
-8% |
-18% |
Source: Refinitiv as at 4 December 2019
Exhibit 9 charts the performance of the three indices since end 2017, underlining the divergence of the AIM index since the end of 2018. This weakness will have played into the weakness in issuance activity on AIM, while the heightened level of political and economic uncertainty prevailing since the EU referendum has contributed to reduced activity in both the main and AIM markets.
On this point, Exhibit 10 shows that trading activity has also weakened with the average daily value traded on the London Stock Exchange order book down 19% for Numis FY19 compared with the prior year.
|
Exhibit 9: FTSE AIM, All-Share and SmallCap indices |
Exhibit 10: LSE order book, average daily value traded |
|
|
|
Source: Refinitiv. Note: Total return indices. |
Source: London Stock Exchange (Main Market) |
|
Exhibit 9: FTSE AIM, All-Share and SmallCap indices |
|
|
Source: Refinitiv. Note: Total return indices. |
|
Exhibit 10: LSE order book, average daily value traded |
|
|
Source: London Stock Exchange (Main Market) |
Our next two charts show the trend in UK mergers and acquisitions since 2015 and in more detail since the beginning of 2018. These confirm the commentary from Numis and other market participants. By value, the 2019 quarterly run rate (to Q3) is 44% below the 2015–18 average and 39% lower than 2018. By number, 2019 is 8% down on 2018.
|
Exhibit 11: UK M&A transaction value 2015–19 |
Exhibit 12: UK M&A value and volume 2018 and 9M19 |
|
|
|
Source: ONS. Note: Total of inbound, outbound and domestic. |
Source: ONS, Edison Investment Research |
|
Exhibit 11: UK M&A transaction value 2015–19 |
|
|
Source: ONS. Note: Total of inbound, outbound and domestic. |
|
Exhibit 12: UK M&A value and volume 2018 and 9M19 |
|
|
Source: ONS, Edison Investment Research |
Looking ahead, there is potential for a bounce back in corporate activity in terms of both issuance and M&A if there is an increase in investor and corporate confidence in the post-election period. UK brokers have generally reported a healthy pipeline of potential transactions but uncertainty of execution given the uncertainty of political developments.
In its own outlook comments, Numis indicated that for the first two months of FY20 revenue across the group was ahead of the same period last year. This is an encouraging start given that the prior year period was not a soft comparison. In particular, Numis cites fund-raisings for Bovis Homes (£152m) and Future (£104m), an advisory role to Unite in its £1.4bn acquisition of Liberty Living and a significant (unnamed) private fintech transaction. Materially higher equities revenue in the period included strong trading gains and improved execution commissions.
Numis notes that its pipeline of private markets opportunities has continued to grow and, following a strong outcome in FY19, this could again make a material contribution to capital markets revenue. Similarly, the company maintains its strategic focus on developing M&A advisory business and mentions an increase in activity in recent months, which could play into a pick-up in transactions following the downturn last year.
While the timing and degree of a recovery in market activity remains in doubt, Numis’s investment in and strategic emphasis on continuing development of its franchise should mean it is well positioned to generate attractive returns on equity and cash flows to support returns to shareholders through dividends and share buybacks.
In the next section, we discuss our new estimates for FY20 and scenario analysis to give an indication of the potential sensitivity of the outcome to different revenue assumptions.
Financials
A comparison of headline figures for FY19 versus our estimates is shown in Exhibit 13 together with the FY20 estimated figures introduced with this note. The main difference between our FY19 estimate and the outcome was the £2.2m negative item in other income arising from portfolio write-downs, as discussed earlier.
Exhibit 13: FY19 actual versus estimate and FY20 estimate introduced
Revenue (£m) |
PBT (£m) |
EPS (p) |
DPS (p) |
|||||||||
Old |
New |
Change |
Old |
New |
Change |
Old |
New |
Change |
Old |
New |
Change |
|
09/19 |
111.6 |
111.6 |
0.0% |
13.8 |
12.4 |
-9.6% |
9.6 |
8.1 |
-15.8% |
12.0 |
12.0 |
0.0% |
09/20e |
125.5 |
21.1 |
15.1 |
12.0 |
||||||||
Source: Edison Investment Research. Note: FY19 old = Edison Investment Research estimate.
A segmental analysis of revenues shows the assumptions we have made for FY20 compared with the two prior years. Points to note here include the marked improvement assumed for net trading gains (no repetition of the Kier rights issue loss) and advisory fees (good start to year and continuing focus in this area). The increase assumed for capital markets is more muted, although still significant in absolute terms. This reflects an expectation of some increase in activity but a level of political and economic uncertainty continuing that may moderate the degree of recovery. Within equities Numis has announced that it expects to launch an electronic trading product that will address the growing use of such low-touch platforms. We have assumed that this will not have a significant effect on figures for FY20.
Exhibit 14: Analysis of revenue estimate
£000 |
2018 |
2019 |
2020e |
Change |
Net trading gains |
9,594 |
4,008 |
7,000 |
75% |
Institutional income |
37,866 |
33,317 |
35,000 |
5% |
Equities |
47,460 |
37,325 |
42,000 |
13% |
Corporate retainers |
12,430 |
13,357 |
14,025 |
5% |
Advisory fees |
17,335 |
12,576 |
17,500 |
39% |
Capital markets |
58,822 |
48,352 |
52,000 |
8% |
Investment banking |
88,587 |
74,285 |
83,525 |
12% |
Total revenue |
136,047 |
111,610 |
125,525 |
12% |
Source: Edison Investment Research
On non-staff costs we have allowed for a modest underlying increase but added approaching £2m for potential one-off costs associated with the move to a new London office with the lease beginning near the end of FY20 and relocation expected to take place in H221. This takes non-staff costs from £31.8m to an estimated £34.5m. The 50,000 square foot office will be c 60% larger than the existing one providing capacity for growth over the term of the 15-year lease. Including the effect of implementation of IFRS 16, Numis expects this will increase ongoing costs from FY21 by £3m. In addition to this there will be fitout costs that we estimate could be in the region of £7–9m (based on a recent Cushman and Wakefield cost report). These costs will be amortised over the lease term (c £0.6m pa) and in cash terms would be broadly balanced by the benefit of a three-year rent-free period (we estimate c £9m in total). For staff costs we have allowed for limited change in fixed costs and assumed variable compensation is equivalent to c 20% of pre-bonus profit.
Given the considerable uncertainty over revenue levels at this early stage in Numis’s financial year we have prepared an estimated sensitivity analysis to show some possible outcomes at different revenue levels. Note that for the other operating income line we have assumed a neutral position (no positive or negative impact from the investment portfolio). Non-staff costs are held flat across the scenarios and include the estimated one-off move-related costs mentioned above. These would drop out in FY21 but there will be additional ongoing costs following the move that would give rise to some incremental cost despite this (we estimate £1–2m). Staff costs are flexed to reflect movements in pre-bonus profitability with fixed costs unchanged between the scenarios. As shown, net profit varies between £7.8m and £20.7m on our assumptions.
Exhibit 15: Illustrative scenario analysis around 2020 estimate
£m unless stated |
Low |
Mid |
High |
Revenue |
108.9 |
125.5 |
134.0 |
Other operating income (investment portfolio) |
0.0 |
0.0 |
0.0 |
Total income |
108.9 |
125.5 |
134.0 |
Non staff costs |
(35.6) |
(35.6) |
(35.6) |
Staff costs |
(64.2) |
(69.3) |
(73.4) |
Operating profit |
9.1 |
20.6 |
25.0 |
Net finance income |
0.6 |
0.6 |
0.6 |
Pre-tax profit |
9.7 |
21.1 |
25.5 |
Tax |
(1.8) |
(4.0) |
(4.9) |
Net profit |
7.8 |
17.1 |
20.7 |
EPS (p) |
6.9 |
15.1 |
18.3 |
DPS (p) |
12.0 |
12.0 |
12.0 |
Return on equity |
6% |
12% |
15% |
Total cost/revenue |
92% |
84% |
81% |
Total staff cost/revenue |
59% |
55% |
55% |
Variable staff cost % of pre-bonus profit |
12% |
20% |
25% |
Source: Edison Investment Research
Numis remains financially strong with no debt and year-end cash and cash equivalents on the balance sheet of £84.2m (FY18: £111.7m; H119: £78.9m). The cash reduction during FY19 mainly reflected the £19m reduction in pre-tax profit compared with FY18 and a working capital outflow of £24m (versus the prior year inflow of £12m). For reference, the average working capital movement over the last five years has been an outflow of £3.4m. Liquidity has been enhanced through the arrangement of a revolving credit facility of £35m committed for three years; this provides additional headroom in the event that activity levels pick up in that period. While the level of net assets was 3.5% lower at £138.2m (which we calculate would give qualifying capital of £131.2m) this still leaves substantial headroom above the regulatory requirement with cover indicated to be c 2x.
Valuation
Our updated comparative valuation table (Exhibit 16) includes UK quoted brokers and a selection of US and European investment banks and advisory firms. A comparison of P/Es for the UK players is hampered by the negative impact of the uncertain political background, the availability of consensus forecast earnings and different financial year ends. Compared with the US and European companies, Numis trades on a higher P/E, which is understandable at a time when its earnings are likely to be more depressed than some of these peers.
Its price to book multiple is higher than its UK comparators but in line with the international peer group despite a lower ROE, which again can be understood on the basis that earnings are relatively depressed and should revert to a higher level in due course.
Exhibit 16: Peer comparison
Price |
Market cap |
Last reported |
Current P/E |
Yield |
ROE |
Price to book |
Last reported year-end |
|||
UK brokers |
||||||||||
Numis |
264 |
277 |
32.5 |
18.3 |
4.5 |
6.6 |
2.0 |
Sep-19 |
||
Arden |
18 |
5 |
Loss |
N/A |
0.0 |
N/A |
0.6 |
Oct-18 |
||
Cenkos |
42 |
24 |
10.0 |
40.2 |
9.5 |
8.0 |
0.8 |
Dec-18 |
||
FinnCap |
22 |
37 |
11.8 |
15.8 |
6.4 |
10.2 |
1.7 |
Mar-19 |
||
WH Ireland |
49 |
24 |
Loss |
N/A |
0.0 |
N/A |
1.4 |
Mar-19 |
||
UK brokers average |
18.1 |
24.7 |
4.1 |
8.3 |
1.3 |
|||||
US, European IB and advisory |
||||||||||
Bank of America |
33.5 |
301,426 |
12.8 |
12.3 |
1.6 |
10.5 |
1.2 |
Dec-18 |
||
Evercore |
75.7 |
3,447 |
8.4 |
9.6 |
2.5 |
69.7 |
4.0 |
Dec-18 |
||
Goldman Sachs |
221.8 |
78,540 |
8.8 |
10.1 |
1.4 |
12.3 |
1.1 |
Dec-18 |
||
Greenhill |
16.7 |
318 |
N/A |
N/A |
1.2 |
29.7 |
5.5 |
Dec-18 |
||
JP Morgan |
134.4 |
421,575 |
14.9 |
12.9 |
1.8 |
13.0 |
1.7 |
Dec-18 |
||
Moelis |
34.2 |
2,043 |
11.4 |
14.4 |
5.5 |
60.4 |
4.7 |
Dec-18 |
||
Morgan Stanley |
49.6 |
80,282 |
10.5 |
10.0 |
2.2 |
11.8 |
1.2 |
Dec-18 |
||
Stifel Financial |
61.7 |
4,221 |
11.7 |
10.6 |
0.8 |
14.2 |
1.4 |
Dec-18 |
||
Credit Suisse |
13.0 |
33,215 |
12.1 |
10.7 |
2.0 |
7.8 |
0.8 |
Dec-18 |
||
Deutsche Bank |
6.5 |
13,511 |
15.0 |
Loss |
1.7 |
N/A |
0.2 |
Dec-18 |
||
UBS |
12.1 |
46,602 |
9.3 |
10.1 |
5.8 |
9.5 |
0.9 |
Dec-18 |
||
US, European IB and advisory average |
11.5 |
11.2 |
2.4 |
23.9 |
2.1 |
|||||
Source: Refinitiv. Note: Priced at 9 December 2019. P/Es are for financial years therefore not all same period end.
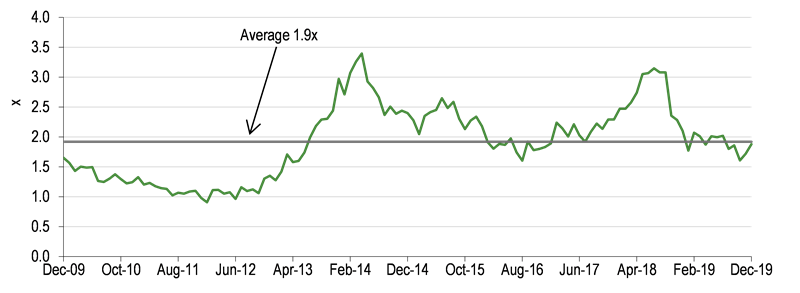
Exhibit 17 charts the history of the price to book ratio over the last 10 years showing how this has recently been oscillating round its average value and is currently almost exactly in line with this level. This again can be justified on the basis that, with continued growth in the client base, profitability is likely to improve significantly when corporate confidence returns.
|
Exhibit 17: Ten-year history of the price to book value ratio for Numis |
|
|
Source: Refinitiv, Edison Investment Research |
As in previous notes, we have used an ROE/COE valuation model to infer the ROE assumption required to match the 259p share price at time of writing: this gives a value of 15.8% (based on the FY19 NAV of 132p and assuming a cost of equity of 10% and growth of 4%). Our current forecast indicates an ROE of 12% for FY20 but on a medium-term view, with a return to more favourable market conditions and as benefits from the investment in staff made in FY18 are realised, a return in line with or above the five-year historical average of 18% does not appear an unrealistic outcome in subsequent years. The sensitivity of the valuation to changing growth and ROE assumptions is illustrated in Exhibit 18.
Exhibit 18: ROE/COE valuation output variations (value per share, p)
Growth rate (right) Return on equity |
2.0% |
3.0% |
4.0% |
5.0% |
6.0% |
10.0% |
132 |
132 |
132 |
132 |
132 |
12.0% |
165 |
169 |
176 |
184 |
198 |
15.0% |
214 |
226 |
242 |
263 |
296 |
18.0% |
263 |
282 |
307 |
343 |
395 |
20.0% |
296 |
320 |
351 |
395 |
461 |
Source: Edison Investment Research
Finally we include a table summarising the recent share price performance of the peer group stocks. Most of the UK stocks have experienced significant negative moves year-to-date reflecting the difficult market background, while on average the US and European stocks have recorded gains. Numis shares have performed noticeably better than the UK peers perhaps reflecting the evidence of franchise strength discussed earlier in the note and the perception that its UK corporate client base would benefit from a resolution of at least part of the political uncertainty following the election.
Exhibit 19: Recent share price performance comparison
% change |
One month |
Three months |
One year |
YTD |
From 12m high |
UK brokers |
|||||
Numis |
16.8 |
10.9 |
-5.4 |
10.2 |
-8.2 |
Arden Partners |
0.0 |
2.9 |
-41.0 |
-36.8 |
-41.9 |
Cenkos |
-12.5 |
-4.5 |
-35.4 |
-41.7 |
-43.2 |
FinnCap |
-7.2 |
-16.2 |
N/A |
-22.8 |
-23.8 |
WH Ireland |
-1.0 |
-3.0 |
-14.9 |
-28.1 |
-35.3 |
UK brokers average |
-0.8 |
-2.0 |
-24.2 |
-23.9 |
-30.5 |
US, European IB and advisory |
|||||
Bank of America |
0.8 |
17.0 |
31.8 |
36.0 |
-0.9 |
Evercore |
-3.2 |
-6.0 |
-1.4 |
5.8 |
-23.4 |
Goldman Sachs |
-0.5 |
4.6 |
23.5 |
32.8 |
-1.6 |
Greenhill |
-9.7 |
12.9 |
-33.2 |
-31.6 |
-46.3 |
JP Morgan |
3.1 |
16.5 |
30.1 |
37.7 |
-1.0 |
Moelis |
-2.8 |
0.8 |
-9.1 |
2.2 |
-27.8 |
Morgan Stanley |
0.9 |
15.1 |
20.0 |
25.1 |
-1.3 |
Stifel Financial |
1.5 |
9.8 |
36.1 |
49.0 |
-2.8 |
Credit Suisse |
-0.2 |
4.3 |
17.4 |
20.6 |
-7.9 |
Deutsche Bank |
-5.2 |
-10.8 |
-15.1 |
-6.1 |
-21.4 |
UBS |
-3.4 |
8.7 |
-5.0 |
-2.5 |
-13.6 |
US, European IB and advisory average |
-1.7 |
6.6 |
8.6 |
15.4 |
-13.4 |
Source: Refinitiv, Edison Investment Research. Note: Priced at 9 December 2019.
Exhibit 20: Financial summary
£000s |
2015 |
2016 |
2017 |
2018 |
2019 |
2020e |
||
Year end 30 September |
||||||||
PROFIT & LOSS |
||||||||
Revenue |
|
|
97,985 |
112,335 |
130,095 |
136,047 |
111,610 |
125,525 |
Administrative expenses (excl. amortisation and depreciation) |
(65,018) |
(76,120) |
(83,626) |
(94,603) |
(85,432) |
(92,810) |
||
Share based payment |
(4,104) |
(6,229) |
(10,454) |
(10,583) |
(10,914) |
(11,000) |
||
EBITDA |
|
|
28,863 |
29,986 |
36,015 |
30,861 |
15,264 |
21,715 |
Depreciation |
|
|
(882) |
(1,126) |
(1,226) |
(1,113) |
(1,124) |
(1,100) |
Amortisation |
(111) |
(125) |
(89) |
(49) |
(44) |
(30) |
||
Operating Profit (before amort. and except). |
|
|
27,870 |
28,735 |
34,700 |
29,699 |
14,096 |
20,585 |
Net finance income |
190 |
37 |
188 |
212 |
550 |
560 |
||
Other operating income |
(1,978) |
3,759 |
3,431 |
1,733 |
(2,210) |
0 |
||
Profit before tax |
|
|
26,082 |
32,531 |
38,319 |
31,644 |
12,436 |
21,145 |
Tax |
(4,533) |
(6,132) |
(7,942) |
(4,967) |
(3,110) |
(4,018) |
||
Profit after tax (FRS 3) |
|
|
21,549 |
26,399 |
30,377 |
26,677 |
9,326 |
17,127 |
Average diluted number of shares outstanding (m) |
117.6 |
118.0 |
117.2 |
115.8 |
114.8 |
113.2 |
||
EPS - basic (p) |
19.5 |
23.5 |
27.4 |
25.1 |
8.8 |
16.5 |
||
EPS - diluted (p) |
|
|
18.3 |
22.4 |
25.9 |
23.0 |
8.1 |
15.1 |
Dividend per share (p) |
11.50 |
12.00 |
12.00 |
12.00 |
12.00 |
12.00 |
||
NAV per share (p) |
102.0 |
113.5 |
125.0 |
135.0 |
131.7 |
134.5 |
||
ROE (%) |
19% |
22% |
23% |
19% |
6.6% |
12.4% |
||
EBITDA margin (%) |
29.5% |
26.7% |
27.7% |
22.7% |
13.7% |
17.3% |
||
Operating margin (before GW and except.) (%) |
28.4% |
25.6% |
26.7% |
21.8% |
12.6% |
16.4% |
||
BALANCE SHEET |
||||||||
Fixed assets |
|
|
6,724 |
5,522 |
6,147 |
8,215 |
6,832 |
6,202 |
Current assets |
|
|
279,114 |
312,462 |
407,850 |
533,033 |
326,641 |
328,140 |
Total assets |
|
|
285,838 |
317,984 |
413,997 |
541,248 |
333,473 |
334,342 |
Current liabilities |
|
|
(170,319) |
(188,895) |
(280,371) |
(398,112) |
(195,319) |
(195,319) |
Long term liabilities |
0 |
(12) |
0 |
0 |
0 |
0 |
||
Net assets |
|
|
115,519 |
129,077 |
133,626 |
143,136 |
138,154 |
139,023 |
CASH FLOW |
||||||||
Operating cash flow |
|
|
6,467 |
48,735 |
43,369 |
45,830 |
(2,748) |
28,557 |
Net cash from investing activities |
(3,632) |
84 |
(198) |
(1,014) |
(77) |
200 |
||
Net cash from (used in) financing |
(17,510) |
(19,580) |
(36,359) |
(29,035) |
(24,646) |
(27,258) |
||
Net cash flow |
|
|
(14,675) |
29,239 |
6,812 |
15,781 |
(27,471) |
1,499 |
Opening net (cash)/debt |
|
|
(74,518) |
(59,591) |
(89,002) |
(95,852) |
(111,673) |
(84,202) |
FX effect |
|
|
(252) |
172 |
38 |
40 |
0 |
0 |
Closing net (cash)/debt |
|
|
(59,591) |
(89,002) |
(95,852) |
(111,673) |
(84,202) |
(85,701) |
Source: Company data, Edison Investment Research
|
|||||||||||||||||||||||||||||||||||||||||||||
|
|
ADL Bionatur Solutions’ (ADL-BS) 9M19 results show €2.16m adjusted EBITDA and 127% year-on-year operating revenue growth to €33.2m, driven by 195% growth in contract manufacturing (CMO). On 2 December it announced a new seven-year CMO contract with a Swiss biotech client worth €20m to produce two novel cosmetics and/or nutrition products. ADL-BS is on track to report positive full-year EBITDA and maintained its FY19 revenue guidance of €50m. We now obtain an EV of €165.8m, translating into an equity valuation of €2.94 per share (from €3.02 previously) after adjusting for net debt.