Last close As at 05/08/2026
GBP16.60
▲ 38.00 (2.34%)
Market capitalisation
GBP316m
Research: Investment Companies
The Biotech Growth Trust
The Biotech Growth Trust |
Industry fundamentals remain positive |
Investment trusts |
21 February 2017 |
Share price/discount performance
Three-year performance vs index
Gearing
Analyst
|
|||||||||||||||||||||||||||||||||||||||||||||||||||||||||||||||||||||||||||||||||||
The Biotech Growth Trust (BIOG) is a specialist vehicle, aiming to generate long-term capital growth via investment in global biotech stocks. Following a particularly volatile period for the biotech industry, where concerns about drug pricing and investor risk aversion have weighed heavily on stock prices, the managers are hopeful that greater clarity regarding US healthcare policy will lead to continued improved performance of biotech stocks. Industry fundamentals remain attractive, including continued innovation and valuations are very supportive, which offers the potential for higher industry merger and acquisition activity.
12 months ending |
Share price |
NAV (%) |
NASDAQ |
World-DS |
FTSE World |
31/01/13 |
47.0 |
35.2 |
25.8 |
25.0 |
15.3 |
31/01/14 |
58.2 |
65.0 |
63.4 |
24.5 |
10.5 |
31/01/15 |
52.5 |
44.9 |
43.7 |
30.8 |
17.3 |
31/01/16 |
(22.1) |
(13.7) |
(11.7) |
0.5 |
(0.1) |
31/01/17 |
15.5 |
15.1 |
17.8 |
12.3 |
33.6 |
Source: Thomson Datastream. Note: All % on a total return basis in GBP.
Investment strategy: Rigorous bottom-up research
BIOG’s managers, Richard Klemm and Geoff Hsu, are able to draw on the deep research experience at OrbiMed Capital to construct a concentrated portfolio of global biotech stocks. Potential investee companies are subject to rigorous fundamental research, including an in-depth analysis of research pipelines; stocks are selected ahead of anticipated positive data, as potential acquisition targets or if they are approaching profitability. BIOG invests across the market cap-spectrum, although around two-thirds of the portfolio is held in major biotech companies. At the time of acquisition, no single position may exceed 15% and gearing of up to 20% of NAV is permitted.
Market outlook: Pullback leads to attractive valuation
The last 18 months have seen significant volatility in biotech shares and in aggregate the NASDAQ Biotechnology industry (NBI) has suffered a drawdown of c 25% from the high point achieved in July 2015. Concerns have centred on the outlook for US drug pricing and general investor risk aversion, although biotech stocks have risen by c 20% following the US presidential election. Sector valuations are still favourable – US biotech stocks are now trading at a discount to the broader market versus a typical premium and industry fundamentals remain attractive. As a result, investors may wish to consider a fund investing in an industry that has a history of innovation and potential above-average earnings growth.
Valuation: Modestly wider than historical averages
BIOG’s current 7.0% discount to cum-income NAV is modestly wider than the historical averages of the last one, three, five and 10 years (range of 4.1% to 6.2%). The board has an active discount control mechanism in place, aiming to keep the discount below 6%. In keeping with the aim of generating long-term capital growth rather than income, BIOG does not pay a dividend.
Exhibit 1: Trust at a glance
Investment objective and fund background |
Recent developments |
||||||||||||||||||||||||||||||||||||||||||||||||||||||||||||||||||||||
The Biotech Growth Trust seeks capital appreciation through investing in the worldwide biotechnology industry. Performance is measured against its benchmark index, the NASDAQ Biotechnology Index (sterling adjusted). |
■ 7 November 2016: interim results for six months ending 30 September 2016. NAV TR +20.5% versus benchmark +23.2%. Share price TR +21.7%. ■ 13 June 2016: announcement of the appointment of Julia le Blan as independent non-executive director at July 2016 AGM. ■ 25 May 2016: annual results for 12 months ending 31 March 2016. NAV TR |
||||||||||||||||||||||||||||||||||||||||||||||||||||||||||||||||||||||
Forthcoming |
Capital structure |
Fund details |
|||||||||||||||||||||||||||||||||||||||||||||||||||||||||||||||||||||
AGM |
July 2017 |
Ongoing charges |
1.0% |
Group |
Frostrow Capital LLP |
||||||||||||||||||||||||||||||||||||||||||||||||||||||||||||||||||
Final results |
May 2017 |
Net gearing |
3.5% |
Manager |
OrbiMed |
||||||||||||||||||||||||||||||||||||||||||||||||||||||||||||||||||
Year end |
31 March |
Annual mgmt fee |
See page 7 |
Address |
25 Southampton Buildings, |
||||||||||||||||||||||||||||||||||||||||||||||||||||||||||||||||||
Dividend paid |
N/A |
Performance fee |
See page 7 |
||||||||||||||||||||||||||||||||||||||||||||||||||||||||||||||||||||
Launch date |
June 1997 |
Trust life |
Indefinite |
Phone |
+44 (0)20 3008 4910 |
||||||||||||||||||||||||||||||||||||||||||||||||||||||||||||||||||
Continuation vote |
Every five years – next 2020 |
Loan facilities |
See page 7 |
Website |
|||||||||||||||||||||||||||||||||||||||||||||||||||||||||||||||||||
Sector exposures: change since 2013 |
Share buyback policy and history (financial years) |
||||||||||||||||||||||||||||||||||||||||||||||||||||||||||||||||||||||
Following an adjustment to the investment objective in October 2013, BIOG is no longer required to invest the majority of assets in companies with a market capitalisation below $3bn at the time of acquisition. |
Renewed annually, the trust has authority to purchase up to 14.99% and allot up to 10% of issued share capital. There is a discount control mechanism in place with a target level of no more than a 6% discount to NAV. |
||||||||||||||||||||||||||||||||||||||||||||||||||||||||||||||||||||||
|
|
||||||||||||||||||||||||||||||||||||||||||||||||||||||||||||||||||||||
Shareholder base (as at 31 January 2017) |
Portfolio exposure by geography (as at 31 January 2017) |
||||||||||||||||||||||||||||||||||||||||||||||||||||||||||||||||||||||
|
|
||||||||||||||||||||||||||||||||||||||||||||||||||||||||||||||||||||||
Top 10 holdings (as at 31 January 2017) |
|||||||||||||||||||||||||||||||||||||||||||||||||||||||||||||||||||||||
|
|||||||||||||||||||||||||||||||||||||||||||||||||||||||||||||||||||||||
Source: The Biotech Growth Trust, Edison Investment Research, Morningstar, Frostrow Capital. Note: *N/A where not in January 2016 top 10.
Market outlook: Attractive sector valuation
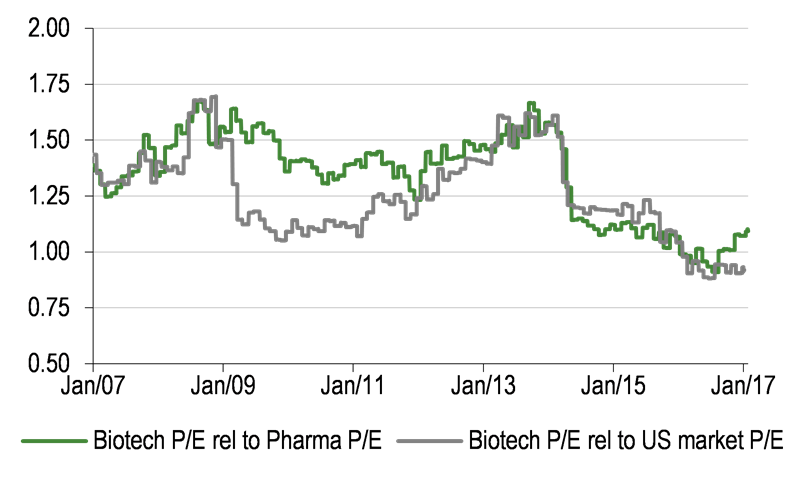
Against a backdrop of long-term outperformance versus world equities (Exhibit 2, left-hand side), the last 18 months has been a volatile period for biotech investors. Following on from allegations of industry price gouging in H215, in early 2016 there was a period of heightened investor risk aversion; the NBI fell by 21.0% in dollar terms during January. In the run-up to the US presidential election there was repeated commentary from both leading candidates about perceived high pricing of pharmaceuticals; the NBI took another leg down ahead of the election result, falling by 11.4% in dollar terms during October 2016, although it has rallied meaningfully following the election of Trump. The relative valuation of biotech stocks remains attractive (Exhibit 2, right-hand side); compared to US equities, global biotech stocks are very close to the lowest relative valuation of the last 10 years.
|
Exhibit 2: Biotech index performance and valuation |
|
NASDAQ Biotech and FTSE World indices over 10 years (£-based) |
World-DS Biotech P/E relative to World-DS Pharma and US-DS over 10 years |
|
|
|
Source: Thomson Datastream, Edison Investment Research. Note: Using Datastream pharmaceutical, biotech and US indices. |
|
While relative valuations versus world pharma stocks have risen from the low point in mid-2016, as shown in Exhibit 3, the largest US biotech stocks are more attractively valued than the largest US pharma stocks. For 2017e, the median top-five biotech company has a forward P/E multiple of 13.6x versus 16.4x for the median top-five pharma company. In addition, some of the larger US biotech stocks such as Celgene and Regeneron have meaningful estimated earnings growth over the next five years, much higher than any of the top-five pharma companies.
Exhibit 3: Consensus estimates EPS growth rates and valuations of US large-cap biotech & pharma companies
Top biotech |
5y CAGR |
2017e P/E |
2018e P/E |
PEG |
Top pharma |
5y CAGR |
2017e P/E |
2018e P/E |
PEG |
Amgen |
6.4% |
13.6x |
13.1x |
2.1x |
Johnson & Johnson |
5.5% |
16.4x |
15.7x |
3.0x |
Celgene |
19.8% |
16.4x |
13.7x |
0.8x |
Pfizer |
5.8% |
12.8x |
11.7x |
2.2x |
Gilead Sciences |
-6.0% |
7.7x |
8.3x |
-1.3x |
Merck |
6.8% |
16.9x |
15.5x |
2.5x |
Biogen |
7.1% |
13.3x |
12.4x |
1.9x |
AbbVie |
9.3% |
11.0x |
9.4x |
1.2x |
Regeneron Pharmaceuticals |
17.4% |
28.8x |
24.0x |
1.7x |
Bristol-Myers Squibb |
9.1% |
18.6x |
16.7x |
2.0x |
Median |
7.1% |
13.6x |
13.1x |
1.7x |
Median |
6.8% |
16.4x |
15.5x |
2.2x |
Source: Edison Investment Research, Bloomberg. Note: Data at 13 February 2017.
While there is an overhang to the biotech industry until investors have more clarity on President Trump’s healthcare policies – he has talked about lower drug pricing, but has also discussed the possibility of less regulation, faster FDA approval of drugs, lower corporate tax rates and repatriation of overseas capital – biotech industry fundamentals remain positive. New therapeutic classes are being developed, which could generate multiple billions of dollars in drug revenues in the years ahead, in areas such as oncology and infectious diseases. There is a growing demand for healthcare, both in the developed world as a result of aging populations, and from emerging economies due to a rising middle class. In addition, the US regulatory environment remains favourable for the healthcare industry. For investors wanting exposure to the biotech sector, a specialist fund with a good long-term record of outperformance versus its benchmark, may appeal.
Fund profile: Specialist investment in biotech sector
BIOG was launched in June 1997, is listed on the Main Market of the London Stock Exchange and since May 2005 has been managed by OrbiMed Capital. OrbiMed is the largest global healthcare-specialist investment manager with c $14bn assets under management and a track record of more than 20 years investing in both public and private equity; it employs more than 100 investment professionals, many of whom have medical and scientific backgrounds. BIOG is managed by Richard Klemm and Geoff Hsu, who are based in New York; they aim to generate capital growth from a concentrated global portfolio of biotech and related shares (33 holdings at the end of January 2017). UK-based Frostrow Capital is the alternative investment fund manager providing company secretarial, administration and marketing services.
BIOG is benchmarked against the NBI, although the managers select stocks on a bottom-up basis, without reference to benchmark weightings. There are broad investment guidelines in place – at the time of acquisition, a maximum of 15% of NAV may be invested in any individual stock, 10% in unquoted investments and $15m in private equity funds managed by OrbiMed; gearing of up to 20% of NAV is permitted.
The fund managers: Geoff Hsu and Richard Klemm
The manager’s view: Retaining positive industry outlook
We spoke to Hsu who explains that following the US election, a Trump rather than Clinton victory coupled with a Republican Congress was viewed as a more favourable outcome for the biotech industry and the NBI rallied by c 20%. However, Trump has since talked about US drug pricing being too high. On 31 January 2017, he met with the CEOs of some of the largest pharma and biotech companies and suggested “the pricing has been astronomical”. He stated that Medicare needs to negotiate heavily on drug pricing and he is in favour of increased competition as a means of lowering prices. However, it is not all bad news for the pharma and biotech industries. Trump is pro-innovation – he wants more generic and innovative drug approvals, which could lead to shorter timelines and lowering the bar for drug approvals at the FDA. Hsu comments that the reason that Mylan, Turing Pharmaceuticals and Valeant Pharmaceuticals were able to raise prices aggressively on old drugs was due to a lack of competing products.
President Trump has also talked about the potential for lower corporate taxes and the ability for companies with overseas assets to repatriate their offshore capital at reduced tax rates. He is keen for US companies to invest domestically, thus creating more jobs – this is consistent with his ‘America First’ philosophy. The manager suggests that until there is more clarity on drug pricing, the NBI is unlikely to have a sustained rally; however, he remains hopeful that policy will become clearer during 2017 and share prices will once again be driven by positive industry fundamentals.
In the meantime, the biotech industry is supported by attractive valuations following a significant industry drawdown since mid-2015; the NBI is trading at a discount to the S&P 500 Index, rather than at a historical premium. Hsu suggests that this could be a catalyst for more industry mergers and acquisitions, which could be a catalyst for biotech stocks to revalue in aggregate. If international companies are able to repatriate their overseas cash at reasonable tax rates, this would provide even more capital that could be used for acquisitions. Some of the recently announced industry bids have been at significant premiums, due to corporate acquirers valuing assets at much higher prices than in the public markets. Examples of recently closed deals were Pfizer’s acquisition of Medivation, which was at a 210% premium to Medivation’s 2016 low stock price and Sunovian Pharmaceuticals, which announced a bid for Cynapsus Therapeutics at a 280% premium off its 2016 low.
The manager suggests that innovation remains very strong within the biotech industry; for example, he expects the first gene therapy to be approved in 2017 and the regulatory environment remains supportive. Considering news flow within the biotech industry over the last few months, Hsu suggests that as ever, there will be successes and failures in drug trials. Good news included Tesaro’s announcement of positive trial results for its PARP inhibitor niraparib for ovarian cancer, and Biogen Idec’s Phase III trial for nusinersen for children with spinal muscular atrophy was stopped early due to overwhelming efficacy. Negative news included Alexion Pharmaceuticals’ announcement of top-line results from its Phase III REGAIN study of Soliris in patients with refractory generalised myasthenia gravis; it barely missed its statistical significant end point and Eli Lilly’s Phase III trial of Alzheimer’s drug solanezumab was high profile and also barely missed its end point. The manager suggests that the news from Eli Lilly was frustrating, as early indications for the drug were positive and Alzheimer’s is a huge, untapped market.
Asset allocation
Investment process: Rigorous proprietary research
The managers are able to draw on the significant resources at OrbiMed, which has more than 100 investment professionals, many of whom have PhDs or are former founders or CEOs of healthcare companies. Stocks are selected on a bottom-up basis following rigorous fundamental research, which involves financial modelling, an assessment of research pipelines and identification of likely catalysts. Meeting with company management forms a key part of the investment process, to understand the commercial prospects and development programs for individual drugs. Stocks are purchased ahead of anticipated positive data, if they are viewed as a potential takeover candidate or for early-stage companies, if they are approaching profitability. Portfolio exposure is broad, across the market-cap spectrum. Holdings are constantly reassessed to ensure the investment rationale still holds true; turnover tends to be higher for smaller-cap companies within the portfolio.
Current portfolio positioning
At end-January 2017, BIOG’s top 10 positions were 71.4% of the portfolio, this was broadly in line with 71.1% at end-January 2016 – seven holdings were common to both periods. The majority of assets held are US equities (c 85% at end-January 2017), reflecting the country’s dominance in the global biotech industry; the portfolio is broadly split between major biotech (c 65%), emerging biotech (c 28%) and specialty pharma (c 7%). Over time, the allocation to specialty pharma has declined, as the manager suggests these companies are more vulnerable to pricing pressure.
Formerly the largest holding in the BIOG portfolio, now the ninth-largest position, Amgen is the largest global biotech company (market cap c $130bn). It recently had positive trial data for a long-awaited study in cholesterol drug Repatha, which successfully reduced heart attacks and other cardiovascular events. Repatha met both its primary and secondary endpoints and no new safety issues were observed; sell-side analysts have suggested that Repatha’s revenues could exceed $1bn in 2018. Amgen also released positive Q416 results, beating both top- and bottom-line consensus expectations, while raising guidance for both 2017 estimated sales and earnings.
Within the emerging biotech exposure, BIOG’s largest position is Incyte Corp; its IDO (immune checkpoint) inhibitor could be a key part of combination therapies in multiple cancers. Other holdings include Vertex Pharmaceuticals, which the manager suggests could have exciting news in H217 regarding Orkambi, its cystic fibrosis drug, and Array BioPharma, which has binimetinib in Phase III trials for melanoma and colorectal cancer.
Performance: Outperformance over the long term
For H117 (to 30 September 2016) BIOG’s NAV and share price total return of 20.5% and 21.7% respectively trailed the 23.2% benchmark total return. The largest contributor was Biogen Idec, which had positive nusinersen Phase III data in spinal muscular atrophy and there was speculation that the company may be acquired. The largest detractor was Ono Pharmaceutical, which BIOG has since sold. Ono was affected by negative data from partner Bristol-Myers Squibb’s Opdivo in a Phase III trial for untreated lung cancer and by concerns of lower Opdivo pricing in Japan.
|
Exhibit 4: Investment trust performance to 31 January 2017 |
|
Price, NAV and benchmark total return performance, one-year rebased |
Price, NAV and benchmark total return performance (%) |
|
|
|
Source: Thomson Datastream, Edison Investment Research. Note: Three-, five- and 10-year performance figures annualised. |
|
Exhibit 4 shows BIOG’s absolute returns; over one year they have been enhanced by sterling weakness. Relative returns in Exhibit 5 show that BIOG has outperformed the benchmark in both share price and NAV total return terms over five and 10 years, while trailing over one and three years. As a reference, BIOG has significantly outperformed world pharma and biotech stocks (represented by the Datastream pharmaceutical & biotechnology index) and the FTSE World index over five and 10 years and FTSE All-Share index over three, five and 10 years.
|
Exhibit 5: Share price and NAV total return performance, relative to indices (%) |
||||||||
|
One month |
Three months |
Six months |
One year |
Three years |
Five years |
10 years |
|
Price relative to NASDAQ Biotechnology |
(4.3) |
0.2 |
(4.2) |
(2.0) |
(8.2) |
3.9 |
5.1 |
|
NAV relative to NASDAQ Biotechnology |
0.9 |
1.8 |
(1.3) |
(2.3) |
(3.7) |
4.6 |
10.3 |
|
Price relative to World-DS Pharm & Bio |
(1.0) |
6.2 |
2.0 |
2.8 |
(7.1) |
38.8 |
77.7 |
|
NAV relative to World-DS Pharm & Bio |
4.3 |
7.9 |
5.0 |
2.4 |
(2.5) |
39.7 |
86.6 |
|
Price relative to FTSE World |
(2.1) |
2.5 |
(12.3) |
(13.6) |
(12.4) |
60.0 |
146.5 |
|
NAV relative to FTSE World |
3.1 |
4.1 |
(9.7) |
(13.9) |
(8.1) |
61.0 |
158.8 |
|
Price relative to FTSE All-Share |
(1.0) |
2.5 |
(9.2) |
(3.8) |
11.9 |
103.2 |
246.4 |
|
NAV relative to FTSE All-Share |
4.3 |
4.2 |
(6.5) |
(4.2) |
17.4 |
104.5 |
263.6 |
|
|
Source: Thomson Datastream, Edison Investment Research. Note: Data to end-January 2017. Geometric calculation. |
||||||||
|
Exhibit 6: NAV total return performance relative to benchmark over five years |
||||||||
|
||||||||
|
Source: Thomson Datastream, Edison Investment Research |
||||||||
Capital structure and fees
BIOG is a conventional investment trust, with one class of share; there are currently 55.8m shares in issue. Gearing of up to 20% of net assets is permitted, which was increased from 10% to 15% in 2014 and from 15% to 20% in 2015 – BIOG has an overdraft facility with JPMorgan Chase.
Portfolio manager OrbiMed receives an annual fee of 0.65% of net assets, while Frostrow Capital is paid 0.3% of the market cap plus £60,000. In FY16, ongoing charges were 1.0%, which was a 20bp reduction versus the prior year. A performance fee is payable – 16.5% of outperformance versus the benchmark is split between OrbiMed (15%) and Frostrow (1.5%). It is calculated quarterly, but only paid if outperformance is maintained; no performance fee was paid in H117 or FY16.
Dividend policy and record
BIOG aims for capital growth; as biotech companies are generally early-stage firms, very few pay a dividend. The last dividend that BIOG declared was 0.2p per share in 2001. For H117, net revenue return was £0.59m, which was a 72% increase versus H116 (£0.34m) (1.0p per share versus 0.5p).
Peer group comparison
BIOG is a member of the AIC Sector Specialist: Biotechnology & Healthcare sector, which comprises two biotech-focused investment trusts (Biotech Growth Trust and International Biotechnology Trust) and three generalist healthcare funds (Polar Capital Global Healthcare Growth and Income Trust, Worldwide Healthcare Trust and recently listed BB Healthcare Trust). To enable a broader comparison, we have included two Swiss-quoted funds: BB Biotech and HBM Healthcare Investments – their dividends are paid out of capital, rather than portfolio income. BIOG’s NAV total return ranks first out of four funds over 10 years and second out of six funds over five years. Over one and three years, BIOG’s relative performance has been more challenging, largely as a result of stock-specific issues; it ranks fourth and fifth out of six funds over one and three years respectively. Its risk-adjusted returns, as measured by the Sharpe ratio, are below the peer group-weighted average over one and three years. BIOG’s discount is broadly in line with the peer average, its ongoing charge is lower and in line with most of the trusts highlighted, a performance fee is payable. BIOG currently has the second highest gearing in the peer group and reflecting its focus on capital growth, it does not pay a dividend.
Exhibit 8: Biotech and healthcare investment companies, as at 13 February 2017
% unless stated |
Market cap £m |
NAV TR 1 Year |
NAV TR 3 Year |
NAV TR 5 Year |
NAV TR 10 Year |
Sharpe 1y (NAV) |
Sharpe 3y (NAV) |
Discount (ex-par) |
Ongoing charge |
Perf. fee |
Net gearing |
Dividend yield (%) |
Biotech Growth Trust |
413.8 |
30.1 |
44.9 |
217.6 |
534.9 |
0.5 |
0.2 |
(4.9) |
1.0 |
Yes |
103 |
0.0 |
BB Biotech |
3,421.7 |
49.1 |
73.8 |
311.6 |
525.2 |
1.0 |
0.5 |
(1.5) |
1.1 |
No |
101 |
4.8 |
HBM Healthcare Investments |
825.4 |
5.6 |
66.2 |
210.4 |
|
(0.4) |
0.5 |
(20.8) |
1.7 |
Yes |
100 |
5.1 |
International Biotechnology |
221.2 |
43.4 |
77.3 |
208.9 |
313.3 |
0.9 |
0.5 |
(9.4) |
1.4 |
Yes |
100 |
3.9 |
Polar Capital Global Healthcare |
234.0 |
26.7 |
41.7 |
107.1 |
|
0.6 |
0.1 |
(5.0) |
1.0 |
Yes |
100 |
2.1 |
Worldwide Healthcare |
1,055.2 |
37.2 |
72.9 |
196.2 |
384.6 |
1.1 |
0.6 |
(1.2) |
0.9 |
Yes |
108 |
0.7 |
Weighted average |
38.9 |
69.6 |
260.6 |
487.8 |
0.8 |
0.5 |
(4.7) |
1.2 |
102 |
3.9 |
||
BIOG rank in sector |
4 |
4 |
5 |
2 |
1 |
5 |
5 |
3 |
4 |
2 |
6 |
Source: Morningstar, Edison Investment Research. Note: TR=total return. Sharpe ratio is a measure of risk-adjusted return. The ratios shown are calculated by Morningstar for the past 12- and 36-month periods by dividing a fund’s annualised excess returns over the risk-free rate by its annualised standard deviation. Net gearing is total assets less cash and equivalents as a percentage of net assets.
The board
There are seven directors on the BIOG board, of whom six are independent. Chairman, Andrew Joy was appointed in March 2012 and assumed his current role in July 2016, following the retirement of the Rt Hon Lord Waldegrave of North Hill. The other independent directors and their dates of appointment are: Peter Keen (June 1997); Professor Dame Kay Davies (March 2012); Stephen Bates (July 2015); the Rt Hon Lord Willetts (November 2015); and Julia Le Blan (July 2016). Sven Borho was appointed in March 2006; as a founding member of BIOG’s portfolio manager OrbiMed, he is considered to be non-independent. The directors have backgrounds in accountancy, investment management, life sciences and politics.
|
|