Last close As at 05/08/2026
GBP16.60
▲ 38.00 (2.34%)
Market capitalisation
GBP316m
Research: Investment Companies
The Biotech Growth Trust
The Biotech Growth Trust |
Positive industry fundamentals |
Investment trusts |
20 July 2016 |
Share price/discount performance
Three-year cumulative perf. graph
Gearing
Analysts
|
|||||||||||||||||||||||||||||||||||||||||||||||||||||||||||||||||||||||||||||
The Biotech Growth Trust (BIOG) is a specialist investment trust that aims to generate capital growth from a portfolio of global biotech stocks. The fund is concentrated, currently holding 32 positions invested across the market capitalisation spectrum. Over the last 12 months, the industry has been volatile following controversy over US drug pricing and heightened risk aversion. However, the managers believe that industry fundamentals remain intact and companies that develop novel treatments will be able to price their products accordingly. Industry valuations look attractive compared with other sectors and there is evidence of an upturn in merger and acquisition activity. BIOG’s recent investment performance has been affected by disappointing data from some holdings, but medium- and longer-term performance remains positive.
12 months ending |
Share price |
NAV |
NASDAQ Biotech (%) |
World-DS |
FTSE World index (%) |
30/06/12 |
47.0 |
35.3 |
25.2 |
10.4 |
(3.5) |
30/06/13 |
37.1 |
37.0 |
39.1 |
32.5 |
22.1 |
30/06/14 |
28.3 |
37.7 |
31.7 |
15.9 |
10.0 |
30/06/15 |
59.6 |
60.9 |
56.8 |
26.0 |
9.9 |
30/06/16 |
(23.0) |
(21.4) |
(17.7) |
9.4 |
14.6 |
Note: Twelve-month rolling discrete £-adjusted total return performance.
Investment strategy: Seeking company catalysts
Managers Geoff Hsu and Richard Klemm are part of a team of more than 100 professionals at OrbiMed, the largest global specialist healthcare investment manager. Stocks are selected following rigorous fundamental research, with the aim of identifying companies with potential catalysts such as positive trial data, product approvals, attracting a takeover bid or approaching profitability. Over the last 12 months the fund has become more concentrated; the top 10 positions now account for c 75% of the portfolio. Gearing of up to 20% of net assets is permitted.
Market outlook: Fundamentals intact, higher M&A
Following a volatile 12 months in the biotech sector as a result of controversy about US drug pricing and macroeconomic concerns affecting higher beta-sectors, biotech company valuations look attractive versus history, pharma companies and the broader stock market. Low valuations have led to merger and acquisition activity, which has the potential to accelerate. Biotech industry fundamentals remain intact and the regulatory environment is favourable. For investors who seek exposure to an evolving industry with the potential for high earnings growth at an attractive valuation, a concentrated specialist trust investing in the global biotech industry may hold appeal.
Valuation: Discount broadly in line with averages
BIOG’s current share price discount to NAV of 4.8% is broadly in line with the historical averages of the last one, three, five and 10 years (range of 4.3% to 6.2%). There is scope for the discount to narrow if BIOG’s near-term performance versus the benchmark improves and/or investor sentiment towards the biotech sector becomes more favourable.
Exhibit 1: Trust at a glance
Investment objective and fund background |
Recent developments |
|||||||||||||||||||||||||||||||||||||||||||||||||||||||||||||||||||||
The Biotech Growth Trust seeks capital appreciation through investing in the worldwide biotechnology industry. Performance is measured against its benchmark index, the NASDAQ Biotechnology Index (sterling adjusted). |
■ 13 June 2016: Announcement of the appointment of Julia le Blan as independent non-executive director at July 2016 AGM. ■ 25 May 2016: Annual results for 12 months ending 31 March 2016. NAV TR |
|||||||||||||||||||||||||||||||||||||||||||||||||||||||||||||||||||||
Forthcoming |
Capital structure |
Fund details |
||||||||||||||||||||||||||||||||||||||||||||||||||||||||||||||||||||
AGM |
July 2017 |
Ongoing charges |
1.0% |
Group |
Frostrow Capital LLP |
|||||||||||||||||||||||||||||||||||||||||||||||||||||||||||||||||
Interim results |
November 2016 |
Net gearing |
2.6% |
Managers |
OrbiMed |
|||||||||||||||||||||||||||||||||||||||||||||||||||||||||||||||||
Year end |
31 March |
Annual management fee |
See page 7 |
Address |
25 Southampton Buildings, |
|||||||||||||||||||||||||||||||||||||||||||||||||||||||||||||||||
Dividend paid |
N/A |
Performance fee |
See page 7 |
|||||||||||||||||||||||||||||||||||||||||||||||||||||||||||||||||||
Launch date |
June 1997 |
Trust life |
Indefinite |
Phone |
+44 (0)20 3008 4910 |
|||||||||||||||||||||||||||||||||||||||||||||||||||||||||||||||||
Continuation vote |
Every five years – next 2020 |
Loan facilities |
See page 7 |
Website |
||||||||||||||||||||||||||||||||||||||||||||||||||||||||||||||||||
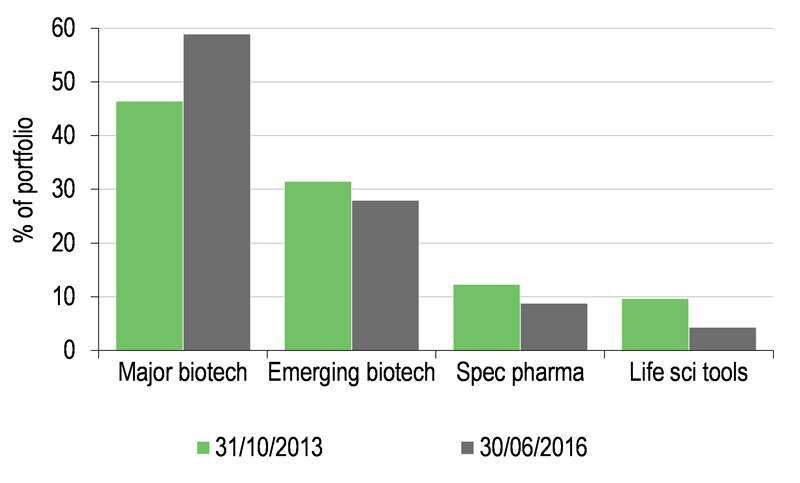
Sector exposures: change since 2013 |
Share buyback policy and history |
|||||||||||||||||||||||||||||||||||||||||||||||||||||||||||||||||||||
Following an adjustment to the investment objective in October 2013, BIOG is no longer required to invest the majority of assets in companies with a market capitalisation below $3bn at the time of acquisition. |
Renewed annually, the trust has authority to purchase up to 14.99% and allot up to 10% of issued share capital. There is a discount control mechanism in place with a target level of no more than a 6% discount to NAV. Financial years shown. |
|||||||||||||||||||||||||||||||||||||||||||||||||||||||||||||||||||||
|
|
|||||||||||||||||||||||||||||||||||||||||||||||||||||||||||||||||||||
Shareholder base (as at 30 June 2016) |
Distribution of portfolio (as at 30 June 2016) |
|||||||||||||||||||||||||||||||||||||||||||||||||||||||||||||||||||||
|
|
|||||||||||||||||||||||||||||||||||||||||||||||||||||||||||||||||||||
Top 10 holdings (as at 30 June 2016) |
||||||||||||||||||||||||||||||||||||||||||||||||||||||||||||||||||||||
|
||||||||||||||||||||||||||||||||||||||||||||||||||||||||||||||||||||||
Source: The Biotech Growth Trust, Edison Investment Research, Bloomberg, Morningstar. Note: *N/A where not in June 2015 top 10.
Market outlook: Biotech valuations look attractive
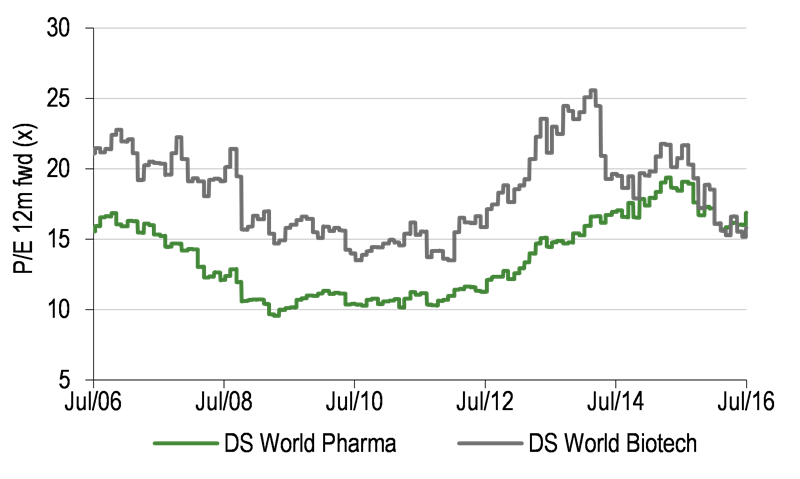
The high-beta nature of biotech stocks can lead to periods of volatility. Over the last 12 months there have been two significant periods of weakness. In the second half of September 2015, the NASDAQ Biotech Index fell by 20% after Turing Pharmaceuticals hiked the price of a 60-year-old anti-parasitic drug from $13.50 to $750 per tablet, which led to allegations of industry price gouging. Pre-election rhetoric surfaced again in January 2016, which coincided with a period of investor risk aversion, and led to another leg down for biotech stocks. As a result, valuations within the group have declined meaningfully. As shown in Exhibit 2, illustrated by Datastream indices, world biotech stocks are now cheaper on a forward P/E basis than world pharma stocks and are also cheaper than the broader US market. Biotech fundamentals remain intact, with new therapeutic classes being developed that industry experts suggest could each yield $5-10bn in annual drug revenues in years ahead, in areas such as immuno-oncology, hepatitis B and gene therapy. Attractive industry valuations suggest an upturn in merger and acquisition activity is likely, which could refocus investors’ attention towards favourable industry dynamics.
|
Exhibit 2: Healthcare sector valuations |
|
World-DS Pharma and World-DS biotech forward P/Es over 10 years |
World-DS Biotech P/E relative to World-DS Pharma and US-DS over 10 years |
|
|
|
Source: Thomson Datastream, Edison Investment Research. Note: Using Datastream pharmaceutical, biotech and US indices. |
|
Fund profile: Specialist biotech investment
BIOG has a premium listing on the London Stock Exchange and is one of four investment trusts in the AIC specialist sector: Biotech & Healthcare. It aims to generate capital growth via global investment in biotech shares and related securities. Since May 2005, the fund has been managed by OrbiMed Capital, the world’s largest healthcare-dedicated investment company. It has a team of more than 100 professionals with scientific, medical, investment and operational experience and c $15bn of assets under management. BIOG’s two lead fund managers, Geoff Hsu and Richard Klemm, are based in New York. UK-based Frostrow Capital is the alternative investment fund manager (AIFM) and provides company secretarial, administration and marketing services.
BIOG is benchmarked against the sterling-adjusted NASDAQ Biotechnology Index, although stock selection is bottom-up without reference to benchmark weightings. The majority of the portfolio is invested in US equities: c 90% at the end of June 2016, with c 60% invested in major biotech companies and the balance in emerging biotech, life science and specialty pharma companies. There are broad investment limits: no more than 15% of the portfolio at the time of acquisition can be in a single stock; up to 10% can be in unquoted investments; and up to $15m can be invested in private equity funds managed by OrbiMed. Gearing of up to 20% of net assets is permitted.
The fund managers: Geoff Hsu and Richard Klemm
The manager’s view: Very positive on industry outlook
We met with manager Geoff Hsu, who commented on the volatility in the biotech sector over the last 12 months. Following a large upward move in the sector, the NASDAQ Biotech Index sold off in the late summer of 2015 as a result of comments by Hilary Clinton and others about the high price of prescription drugs in the US. This was followed in January 2016 by a period of heightened investor risk aversion as a result of macroeconomic concerns, which led to high-beta sectors of the stock market, including biotech, coming under pressure. The drawdown in the NASDAQ Biotech Index has been severe, even greater than during the global financial crisis and similar to the bursting of the NASDAQ bubble in 2000-02. This has led to valuations in the sector beginning to look very attractive, which in turn the manager believes will lead to increased M&A activity and will refocus investor attention on attractive industry fundamentals. Deals have already been announced, such as Pfizer’s bid for Anacor Pharmaceuticals at a 55% premium and Sanofi’s hostile bid for Medivation, which had led to other companies considering a bid for the company. The manager explains that typically, $5-10bn market cap was the sweet spot for acquisition targets. However, given sharp share price declines, there is the potential for larger companies to be acquired. Company managements should be receptive to reasonable bids given that the financing environment is not as benign as it was; there has been a slowdown in secondary financing and in a volatile market there is unlikely to be a large appetite for IPOs.
The manager notes that there have recently been some high-profile clinical disappointments such as for Biogen’s Phase II trial for its multiple sclerosis drug opicinumab. However, despite negative headlines, he says that innovation within the industry continues and that novel products will continue to command premium prices. There have been periods in the past when US politicians have tried to put pressure on biotech and pharma companies to lower the price of their products. In each instance, they have been unsuccessful, and the manager believes that there will be no change in legislation following the presidential election. When branded drugs become subject to generic competition, their prices typically fall by 95%, which has kept drug spending as a proportion of total US healthcare spending generally around 10% over the last 50 years (nine out of 10 prescriptions filled in the US are generic). Bill Gates has recently defended the status quo for US drug pricing given its role in funding research and development. The biotech industry regulatory environment remains favourable; in 2015, the FDA approved 45 novel drugs (more than a third were first-in-class medicines and 47% were for orphan diseases), which was the largest number of approvals since 1996.
Q1 is seasonally the weakest period for earnings of biotech companies. Q216 results and beyond should therefore be higher, serving as a reminder to investors that there is good earnings growth in the sector. As a result, the manager believes that sentiment towards the biotech sector will become more positive, merger and acquisition activity will increase and valuations are very attractive. Looking at Exhibit 3, the median growth rates and valuations of most large-cap biotech companies compare favourably with those of large-cap pharma companies.
Exhibit 3: Consensus estimates EPS growth rates and valuations of the large-cap biotech & pharma companies
Top biotech |
5y CAGR |
2016e P/E |
2017e P/E |
PEG |
Top pharma |
5y CAGR |
2016e P/E |
2017e P/E |
PEG |
Amgen |
8.2% |
14.4x |
13.2x |
1.8x |
Johnson & Johnson |
5.5% |
18.6x |
17.5x |
3.4x |
Gilead |
1.0% |
7.1x |
7.0x |
6.8x |
Pfizer |
7.7% |
14.8x |
13.7x |
1.9x |
Celgene |
21.8% |
17.9x |
14.5x |
0.8x |
Merck |
6.1% |
16.0x |
15.8x |
2.6x |
Biogen |
9.2% |
13.3x |
12.5x |
1.4x |
Bristol-Myers Squibb |
22.4% |
29.5x |
23.5x |
1.3x |
Regeneron |
16.4% |
33.6x |
24.6x |
2.0x |
AbbVie |
13.1% |
13.6x |
11.5x |
1.0x |
Median |
9.2% |
14.4x |
13.2x |
1.8x |
Median |
7.7% |
16.0x |
15.8x |
1.9x |
Source: Edison Investment Research, Bloomberg. Note: Data at 13 July 2016.
At the end of June 2016, data from Bloomberg showed that the biotech sector was trading at a 12-month forward P/E of 11.2x, which compared to a multiple for the S&P 500 Index of 15.6x; the biotech sector was cheaper than all 10 sectors of the broader market.
Asset allocation
Investment process: Detailed fundamental analysis
The managers employ a detailed bottom-up stock selection process. They are able to draw on the resources of the team at OrbiMed, which has c 100 professionals, more than 20 of whom (including Klemm) have medical degrees and/or PhDs. The investment process puts great emphasis on company visits in a bid to understand the commercial prospects and development programmes for individual drugs. BIOG’s managers use statistical analysis alongside their fundamental research, to determine what they believe to be likely catalysts such as positive trial data or product approvals. Companies are also purchased in anticipation of being taken over, or if an early-stage company is approaching profitability.
BIOG has a concentrated portfolio, comprised of large-cap and emerging biotech stocks plus specialty pharma and life science tools companies. This ensures that portfolio exposure is broad, from mature companies with multiple product lines through to earlier-stage companies with encouraging preclinical or early-phase clinical trial data. Portfolio companies are rotated frequently especially in the smaller-cap positions.
Current portfolio positioning
At the end of June 2016, BIOG held 32 positions, with the top 10 representing 74.9% of the portfolio. This is an increase in concentration over the last 12 months; at the end of June 2015, the top 10 positions were 58.4% of the fund. The increase in concentration is partly as a result of the stock prices of smaller-cap biotech companies falling further than larger-cap companies over the last 12 months, which is to be expected given that they are higher beta stocks.
The biggest position in the portfolio is Amgen, the largest biotech company in the industry. It has a calcitonin gene-related peptide (CGRP) inhibitor in Phase III trials, a new class of product for the treatment of migraine. Data released so far have indicated that the product is very effective in reducing the number of migraine days. The company has committed to double-digit annual earnings growth, which will be helped by recent cost cutting, and has a history of delivering on earnings forecasts. Amgen has a 2.5% dividend yield, and in line with other large-cap biotech companies, is returning cash to shareholders via share repurchases.
Examples of two newer names in the portfolio are BeiGene and Minerva Neurosciences. BeiGene is a Chinese company and the manager believes that its BTK inhibitor for the treatment of lymphoma looks promising. US company Minerva Neurosciences has a portfolio that the manager considers interesting. It has a CNS platform with three candidates in Phase II studies for schizophrenia, major depressive disorders and insomnia. Data already presented has de-risked the story; more data is expected to be presented next year.
Performance: Positive long-term, absolute and relative
In FY16 (ending 31 March), BIOG’s NAV total return of -24.8% trailed the benchmark NASDAQ Biotechnology Index total return of -21.8% and its share price fell by 26.3%, widening the discount to NAV from 4.9% to 6.8% over the course of the financial year. The largest contributors to performance were Ono Pharmaceutical (2.9% contribution), led by strong sales of cancer drug Opdivo, and takeover targets including Synageva BioPharma (1.7%), which was acquired by Alexion Pharmaceuticals with an announced 140% premium. The largest detractors were Biogen
(-4.4%), whose sales of multiple sclerosis drug Tecfidera have lagged expectations, leading to lower earnings guidance, and GW Pharmaceuticals (-3.1%), where investors were cautious ahead of results of a Phase III trial testing Epidiolex for paediatric epilepsy.
|
Exhibit 4: Investment trust performance to 30 June 2016 |
|
Price, NAV and benchmark total return performance, one-year rebased |
Price, NAV and benchmark total return performance (%) |
|
|
|
Source: Thomson Datastream, Edison Investment Research. Note: Three, five and 10-year performance figures annualised. |
|
Despite near-term underperformance, BIOG’s NAV total return is ahead of the benchmark over three, five and 10 years. As a reference to UK shareholders, BIOG has significantly outperformed the FTSE All-Share Index over these time periods and absolute returns have been strong. Annualised NAV total returns over three, five and 10 years are 20.3%, 26.4% and 20.0%, respectively. As shown in Exhibit 6, there have been periods of volatility, but outperformance versus the benchmark has been positive over the last five years.
|
Exhibit 5: Share price and NAV total return performance, relative to indices (%) |
||||||||
|
One month |
Three months |
Six months |
One year |
Three years |
Five years |
10 years |
|
Price relative to NASDAQ Biotechnology |
(4.2) |
(2.3) |
(2.4) |
(6.5) |
(7.3) |
7.3 |
13.5 |
|
NAV relative to NASDAQ Biotechnology |
(1.9) |
(0.4) |
0.7 |
(4.5) |
2.5 |
9.1 |
20.9 |
|
Price relative to World-DS Pharm & Bio |
(11.8) |
(8.1) |
(22.1) |
(29.6) |
(1.3) |
36.1 |
69.4 |
|
NAV relative to World-DS Pharm & Bio |
(9.7) |
(6.3) |
(19.6) |
(28.2) |
9.1 |
38.4 |
80.4 |
|
Price relative to FTSE World index |
(11.1) |
(4.5) |
(26.7) |
(32.8) |
13.8 |
94.5 |
158.5 |
|
NAV relative to FTSE World index |
(9.0) |
(2.5) |
(24.4) |
(31.4) |
25.8 |
97.8 |
175.3 |
|
Price relative to FTSE All-Share index |
(6.5) |
(0.8) |
(21.3) |
(24.7) |
32.8 |
134.4 |
244.4 |
|
NAV relative to FTSE All-Share index |
(4.3) |
1.2 |
(18.8) |
(23.1) |
46.9 |
138.4 |
266.8 |
|
|
Source: Thomson Datastream, Edison Investment Research. Note: Data to end-June 2016. Geometric calculation. |
||||||||
|
Exhibit 6: NAV performance relative to benchmark over five years |
||||||||
|
||||||||
|
Source: Thomson Datastream, Edison Investment Research |
||||||||
Discount: Narrower than 12-month average
BIOG’s current share price discount to NAV of 4.8% is narrower than the 6.2% average of the last 12 months. Over the last year, the range was a premium of 0.7% to an 11.8% discount, which occurred during a period of investor risk aversion in January 2016. The current discount is broadly in line with the averages of the last three, five and 10 years (range of 4.3% to 5.2%). The board employs an active discount control mechanism, which aims to limit the share price discount to NAV at 6%. In FY17 to date, 2.15m shares have been repurchased at an average price of 619.2p. The board will also issue shares to manage a premium. As shown in Exhibit 1, shares were allotted in FY13 and FY14, followed by a modest number of shares issued in FY15.
|
Exhibit 7: Share price premium/discount to NAV over three years (%) |
|
|
Source: Thomson Datastream, Edison Investment Research. Note: NAV with debt at fair value. |
Capital structure and fees
BIOG is a conventional investment trust with one class of share; there are currently 58.1m ordinary shares outstanding. Gearing of up to 20% of net assets is permitted following an increase from 10% to 15% in 2014 and from 15% to 20% in 2015. This is via an overdraft facility with JPMorgan Chase. Net gearing at the end of June 2016 was 2.6%. The manager comments that gearing was high (close to 15%) going into the weakness in summer 2015 due to strong industry fundamentals, and having been hurt by being geared into the downturn, he does not want to run the risk of having no gearing if investor sentiment towards the sector becomes more positive.
BIOG pays OrbiMed an annual management fee of 0.65% of net assets, while Frostrow Capital is paid 0.3% of market cap, plus £60,000. Ongoing charges in FY16 were 1.0%, a reduction of 20 basis points versus the prior financial year. A performance fee is payable to reward outperformance versus the benchmark; 16.5% of outperformance generated is split between portfolio manager OrbiMed (15%) and AIFM Frostrow Capital (1.5%). It is calculated quarterly but only paid if outperformance is maintained. No performance fee was paid in FY16.
Dividend policy and record
BIOG aims for capital appreciation rather than income growth. In addition, biotech companies are often in the early stages of business development, reinvesting cash for future growth rather than returning it to shareholders. As a result, BIOG has not historically paid a dividend; the last was 0.2p per share in 2001. In FY16, the net revenue return was £0.83m (1.3p per share), a c 600% increase versus the prior year (£0.12m and 0.2p).
Peer group comparison
The AIC specialist Biotech & Healthcare sector comprises two biotech-focused investment trusts (Biotech Growth Trust and International Biotechnology Trust) and two generalist healthcare funds (Polar Capital Global Healthcare and Worldwide Healthcare). To provide a broader comparison, we have also included two funds quoted in Switzerland: BB Biotech and HBM Healthcare, whose dividends are paid from capital distributions rather than portfolio income. BIOG’s NAV total return ranks first out of four funds over 10 years and second out of all six funds over five years. Near-term performance has been more challenging, resulting in one- and three-year rankings towards the bottom of the group. Risk-adjusted returns as measured by the Sharpe ratio are below the peer-group average over one and three years. BIOG’s share price discount to NAV is below average, its ongoing charge is broadly in line, and in common with most of the peers, a performance fee is payable. Reflecting its focus on capital appreciation, BIOG does not pay a dividend.
Exhibit 8: Biotech and healthcare investment companies, as at 13 July 2016
% unless stated |
Market cap £m |
NAV TR 1 Year |
NAV TR 3 Year |
NAV TR 5 Year |
NAV TR 10 Year |
Sharpe 1y (NAV) |
Sharpe 3y (NAV) |
Discount (ex-par) |
Ongoing charge |
Perf. fee |
Net gearing |
Dividend yield (%) |
Biotech Growth Trust |
386.1 |
(21.4) |
65.4 |
232.6 |
568.2 |
(1.4) |
0.6 |
(5.6) |
1.00 |
Yes |
102 |
0.0 |
BB Biotech |
2,784.8 |
(24.5) |
62.0 |
249.2 |
516.9 |
(1.4) |
0.6 |
(1.2) |
1.12 |
No |
102 |
6.3 |
HBM Healthcare Investments |
720.0 |
17.1 |
111.4 |
155.9 |
|
0.1 |
1.2 |
(29.8) |
1.68 |
Yes |
100 |
5.9 |
International Biotechnology Trust |
183.8 |
(12.8) |
76.3 |
203.9 |
296.3 |
(1.2) |
0.7 |
(12.7) |
1.65 |
Yes |
100 |
0.0 |
Polar Capital Global Healthcare |
231.9 |
8.5 |
48.2 |
115.8 |
|
(0.9) |
0.9 |
(5.4) |
1.06 |
Yes |
100 |
1.9 |
Worldwide Healthcare |
949.6 |
3.5 |
88.9 |
178.2 |
393.8 |
(0.8) |
1.2 |
(5.3) |
0.96 |
Yes |
109 |
0.6 |
Sector weighted average |
(11.7) |
73.8 |
214.9 |
484.9 |
(1.0) |
0.8 |
(6.8) |
1.17 |
103 |
4.9 |
||
BIOG rank in sector |
4 |
5 |
4 |
2 |
1 |
5 |
5 |
4 |
3 |
2 |
5 |
Source: Morningstar, Edison Investment Research. Note: TR=total return. Sharpe ratio is a measure of risk-adjusted return. The ratios shown are calculated by Morningstar for the past 12- and 36-month periods by dividing a fund’s annualised excess returns over the risk-free rate by its annualised standard deviation. Net gearing is total assets less cash and equivalents as a percentage of net assets. BB Biotech and HBM Healthcare are listed in Switzerland and not part of the AIC peer group. All data shown is in GBP.
The board
There are seven directors on the board of BIOG, of whom six are independent. Following the retirement of chairman the Rt Hon Lord Waldegrave of North Hill at the July 2016 AGM, the board will now be chaired by Andrew Joy, who was appointed in 2012. The other independent directors (with year of appointment) are: Peter Keen (1997); Professor Dame Kay Davies (2012); Steven Bates; and the Rt Hon Lord Willetts (both in 2015). The newest member of the board is Julia Le Blan, who was appointed at the 2016 AGM. Sven Borho is a non-independent director, appointed in 2006. He is a founding partner of OrbiMed, BIOG’s portfolio manager. The board members have backgrounds in accountancy, investment management, life sciences and politics.
|