Last close As at 05/08/2026
GBP3.17
▲ 1.50 (0.48%)
Market capitalisation
GBP2,914m
Research: Investment Companies
Templeton Emerging Markets Inv. Trust
Templeton Emerging Markets Inv. Trust |
New lead manager broadens TEMIT’s portfolio |
Investment trusts |
22 July 2016 |
Share price/discount performance
Three-year cumulative perf. graph
Gearing
Analysts
|
|||||||||||||||||||||||||||||||||||||||||||||||||||||||||||||||||||||||||||||||||||||
Templeton Emerging Markets Investment Trust (TEMIT) invests in emerging market-listed equities or in companies listed elsewhere where the majority of their revenues are derived from emerging markets. Since 1 October 2015, TEMIT has been managed by Carlos von Hardenberg, who has broadened the trust’s exposure; he aims to generate long-term capital growth by investing in a portfolio of c 90 companies diversified by sector and geography. The manager has a value bias and stocks are selected following thorough fundamental analysis. Although performance in 2015 was challenging, the trust has outperformed its benchmark over 10 years and 2016 performance to date has shown a marked improvement.
12 months ending |
Total share price return (%) |
Total NAV |
MSCI Emerging Markets (%) |
MSCI World (%) |
FTSE All-Share (%) |
30/06/12 |
(17.2) |
(17.1) |
(13.7) |
(2.2) |
(3.1) |
30/06/13 |
5.0 |
8.3 |
6.8 |
23.3 |
17.9 |
30/06/14 |
2.7 |
1.8 |
1.7 |
10.6 |
13.1 |
30/06/15 |
(6.6) |
(5.2) |
3.5 |
10.9 |
2.6 |
30/06/16 |
(0.1) |
3.0 |
3.9 |
15.1 |
2.2 |
Note: Twelve-month rolling discrete £-adjusted total return performance.
Investment strategy: Disciplined stock selection
The manager and his team of c 50 global managers and analysts seek undervalued stocks with good fundamentals and strong management teams. The macroeconomic environment is considered and stocks undergo a disciplined evaluation process before being considered for inclusion in the portfolio. Stocks are held for the long term; the manager is patient, acknowledging that it can take time for value to be realised. Following the change in lead manager, there are a higher number of stocks in the portfolio with greater exposure to technology, smaller-cap companies and frontier markets. The trust typically runs a small cash balance.
Market outlook: Potential outperformance of EM
Despite the possibility that volatility remains elevated due to macroeconomic uncertainties, there is potential for emerging markets to outperform developed markets given higher growth forecasts and attractive valuations. In its April 2016 World Economic Outlook, the IMF forecasts emerging markets growth of 4.8% pa from 2016 to 2021, compared to 1.9% pa for advanced economies. The weaker performance of the MSCI Emerging Markets index versus the MSCI World index over the last five years has left its forward earnings multiple at a 24% discount (11.9x versus 15.7x), its price-to-book multiple at a 30% discount (1.45x versus 2.08x) and its dividend yield modestly higher (2.8% versus 2.7%).
Valuation: Wider than average discount
TEMIT’s current share price discount to cum-income NAV of 12.5% is similar to the 12-month average of 12.8%, but wider than the averages of the last three, five and 10 years (range of 8.8% to 11.1%). This suggests potential for the discount to narrow if investment performance continues to improve and/or investor sentiment towards emerging market equities becomes more positive.
Exhibit 1: Trust at a glance
Investment objective and fund background |
Recent developments |
||||||||||||||||||||||||||||||||||||||||||||||||||||||||||||||||||||||
Launched in June 1989, Templeton Emerging Markets Investment Trust (TEMIT) was one of the first emerging markets funds in the UK. The trust seeks long-term capital appreciation through investment in companies operating in emerging markets, or those with stocks listed on the stock markets of such countries. This may include companies that have a significant amount of their revenues in emerging markets, but which are listed on stock exchanges in developed countries. The benchmark is the MSCI Emerging Markets index. |
■ 8 June 2016: Proposed appointment of Simon Jeffreys as non-executive director at July 2016 AGM. ■ 8 June 2016: Proposed annual dividend of 8.25p for FY16, payable on 22 July. ■ 8 June 2016: Preliminary results for 12 months to 31 March 2016. NAV TR ■ 1 October 2015: Appointment of Carlos von Hardenberg as lead manager. |
||||||||||||||||||||||||||||||||||||||||||||||||||||||||||||||||||||||
Forthcoming |
Capital structure |
Fund details |
|||||||||||||||||||||||||||||||||||||||||||||||||||||||||||||||||||||
AGM |
July 2016 |
Ongoing charges |
FY16 1.22% |
Group |
Templeton Asset Management |
||||||||||||||||||||||||||||||||||||||||||||||||||||||||||||||||||
Interim results |
November 2016 |
Net cash |
3.6% |
Manager |
Carlos von Hardenberg |
||||||||||||||||||||||||||||||||||||||||||||||||||||||||||||||||||
Year end |
31 March |
Annual mgmt fee |
1.10% of net assets |
Address |
5 Morrison Street, Edinburgh, |
||||||||||||||||||||||||||||||||||||||||||||||||||||||||||||||||||
Dividend paid |
July |
Performance fee |
None |
||||||||||||||||||||||||||||||||||||||||||||||||||||||||||||||||||||
Launch date |
12 June 1989 |
Trust life |
Indefinite |
Phone |
+44 (0)871384 2505 |
||||||||||||||||||||||||||||||||||||||||||||||||||||||||||||||||||
Continuation vote |
Five yearly (last in 2014) |
Loan facilities |
Up to 10% of net assets. |
Website |
|||||||||||||||||||||||||||||||||||||||||||||||||||||||||||||||||||
Dividend policy and history |
Share buyback policy and history |
||||||||||||||||||||||||||||||||||||||||||||||||||||||||||||||||||||||
Dividends are paid annually in July. The stable dividend in 2016 follows five consecutive years of rising dividends. |
TEMIT is authorised to repurchase up to 14.99% and allot up to 5% of its ordinary shares. Financial years shown. |
||||||||||||||||||||||||||||||||||||||||||||||||||||||||||||||||||||||
|
|
||||||||||||||||||||||||||||||||||||||||||||||||||||||||||||||||||||||
Shareholder base (as at 30 June 2016) |
Portfolio exposure by geography (ex-cash at 30 June 2016) |
||||||||||||||||||||||||||||||||||||||||||||||||||||||||||||||||||||||
|
|
||||||||||||||||||||||||||||||||||||||||||||||||||||||||||||||||||||||
Top 10 holdings (as at 30 June 2016) |
|||||||||||||||||||||||||||||||||||||||||||||||||||||||||||||||||||||||
|
|||||||||||||||||||||||||||||||||||||||||||||||||||||||||||||||||||||||
Source: Templeton Emerging Markets Investment Trust, Edison Investment Research, Bloomberg, Morningstar. Note: *N/A where not in June 2015 top 10.
Recent change in lead manager
Carlos von Hardenberg has been TEMIT’s lead manager since 1 October 2015. He has been working closely with former manager Mark Mobius, executive chairman of Templeton Emerging Markets Group, and senior research analyst Chetan Sehgal for the last 13 years. Following his appointment, changes implemented mean that the portfolio is now more diversified; the number of holdings has nearly doubled, increasing from c 50 to c 90, with a lower exposure to resources and financial stocks and greater exposure to technology stocks. There has also been a selective increase in exposure to small-caps and frontier markets. As a result of changes to the structure of the portfolio, transaction costs in FY16 increased to 0.24% of average net assets (£3.9m) versus 0.10% (£2.0m) in the previous year.
Along with a detailed stock selection process, the manager has added an overlay of macroeconomic research focusing on factors such as currencies, interest rates, commodities and local macroeconomic data. He draws on the experience of the existing, experienced global team of analysts but has adapted communication with the regional offices, moving from regular global meetings to von Hardenberg holding more focused calls with individual regional offices. The roles of analysts have been simplified. Previously, analysts had both sector and geographic responsibilities, but are now either sector or regional specialists. The measurement of analysts’ ideas is very transparent and the manager stresses the importance of their input.
Fund profile: Pioneer emerging markets trust
Launched in June 1989 and quoted on the London (LSE) and New Zealand stock exchanges, TEMIT was one of the first funds listed in the UK focusing on emerging markets. The manager aims to generate long-term capital growth by investing primarily in equities listed in emerging markets or companies listed elsewhere that have a significant proportion of their revenues generated in emerging markets. The trust is managed by Carlos von Hardenberg, now based in London, who is supported by former lead manager Mark Mobius, based in Hong Kong, and Chetan Sehgal, based in Mumbai, and is able to draw on the resources of a global network of more than 50 portfolio managers and analysts based in 20 Franklin Templeton offices around the world. Borrowings of up to 10% of net assets are permitted, but have not been utilised in recent years. The portfolio is run with a small net cash position.
The fund manager: Carlos von Hardenberg
The manager’s view: Plenty of available opportunities in EM
Manager von Hardenberg comments that emerging markets have been volatile recently and lacked direction. Near-term concerns affecting market sentiment have included declining corporate earnings estimates, political issues, currency moves, economic slowdown in China and lower commodity prices. However, with the expertise of local research offices, he has been able to identify a large number of companies that fit his value criteria. Additionally, he looks for superior management teams with good corporate governance track records. Following emerging market growth and earnings expectations being revised lower over the last three years, the manager suggests that ‘lower for longer’ is very evident so he looks for companies that have superior growth prospects in relation to the overall market, as well as attractive valuations.
Some of the recent additions to the portfolio such as Tencent, China’s most successful and largest online gaming company, would seem atypical holdings for a value manager like Franklin Templeton as the stocks do not look cheap on traditional valuation metrics such as P/E multiples. However, the manager initiated these positions after conducting thorough fundamental research including sum-of-the-parts valuation analysis, concluding that the full value of the underlying businesses is not reflected in market valuations following share price weakness. He maintains a disciplined focus on the long-term future of potential investments, identifying catalysts that will enable value to be realised. In a fast-evolving industry like technology, he considers it important to determine the ability of a company’s management to adapt to the changing environment.
Looking at emerging markets as a whole, the manager considers that sentiment is dominated by views on the Chinese economy and the shift from investment- to consumption-led growth. He is concerned about China’s financial sector, where there is a lack of clarity surrounding insurance companies, and he believes the proportion of non-performing bank loans is higher than the reported numbers suggest. As a result, TEMIT has no exposure to large-cap Chinese financial stocks. The manager observes that a lot of Chinese entrepreneurs are trying to get money out of the country and the authorities have not done enough to restrict capital flows. He is also concerned about further devaluation of the Chinese currency, suggesting there is still room for adjustment, although he currently does not expect a dramatic move.
The manager notes that some other Asian nations are performing well, highlighting South Korea and Taiwan as having revolutionary technology companies that he believes have sufficient competitive advantages to ensure that their market-leading positions are assured over the next decade. He is also positive on countries such as Vietnam, which is attracting a large amount of foreign direct investment and benefits from deep sea ports, a pro-business government and a low tax environment. Market liquidity is currently an issue, but a change in foreign ownership rules could see this improve. TEMIT has recently gained board approval to invest in the country.
Asset allocation
Investment process: Disciplined long-term approach
The manager follows a disciplined, fundamental approach to picking stocks, seeking to identify companies that are trading at a discount to the value of their underlying businesses, while taking into account the macroeconomic environment. Investment decisions are taken without reference to weightings in the benchmark index. Positions are generally held for the long term.
There is a five-step investment process: screening companies in terms of valuation, size and liquidity; fundamental analysis focusing on future earnings and cash flow potential, strength of the balance sheet and the capability of investee company management teams plus their corporate governance policies; team evaluation of potential holdings; portfolio construction, taking into account fund investment guidelines and risk attributes; and evaluation of the portfolio and attribution analysis on a weekly basis. Risk is mitigated via sector and geographic diversification. In addition, there are weekly, monthly and quarterly assessments by the independent Performance Analysis and Investment Risk (PAIR) team. Currency exposure is not hedged; it is viewed as an inherent risk when investing in emerging markets and hedging is considered prohibitively expensive.
Current portfolio positioning
At the end of FY16 (31 March), an analysis of TEMIT versus its benchmark showed the portfolio had lower P/E and P/CF multiples and a higher P/B ratio than the MSCI Emerging Markets index, with a similar dividend yield and average market cap.
At the end of June 2016, the top 10 holdings accounted for 39.2% of the portfolio; this was a slight decrease in concentration versus 41.7% a year ago. However, following a reorganisation of the portfolio under the new manager, only five names were common to both periods. Brilliance China Automotive remains the largest position, albeit with a lower exposure. It is an automobile manufacturer operating a joint venture with BMW for the production and sale of the BMW 3 and 5 series in China. It had a tough operating environment in 2015 due to price cuts and higher dealer incentives. However, the manager expects that new product launches will lead to improved sales and profitability later in 2016, especially given that the penetration of luxury cars in China remains low. The manager considers that Brilliance China Automotive has one of the strongest management teams in the industry and follows the German model of a high level of corporate governance.
Exhibit 2: Portfolio sector exposure vs benchmark (% unless stated)
Portfolio end-June 2016 |
Portfolio end-June 2015 |
Change |
Index weight |
Active weight vs index (pts) |
Trust weight/ index weight (x) |
|
Information technology |
27.6 |
8.3 |
19.3 |
22.5 |
5.1 |
1.2 |
Consumer discretionary |
19.7 |
18.3 |
1.4 |
10.5 |
9.2 |
1.9 |
Financials |
19.3 |
27.3 |
-8.0 |
26.1 |
-6.8 |
0.7 |
Consumer staples |
12.3 |
8.7 |
3.7 |
8.5 |
3.9 |
1.5 |
Energy |
8.4 |
20.9 |
-12.5 |
7.5 |
1.0 |
1.1 |
Materials |
5.4 |
10.9 |
-5.5 |
6.3 |
-0.9 |
0.9 |
Industrials |
3.8 |
5.7 |
-1.9 |
6.2 |
-2.3 |
0.6 |
Healthcare |
2.6 |
0.0 |
2.6 |
2.7 |
-0.1 |
1.0 |
Telecommunications |
0.8 |
0.0 |
0.8 |
6.6 |
-5.8 |
0.1 |
Utilities |
0.0 |
0.0 |
0.0 |
3.2 |
-3.2 |
0.0 |
100.0 |
100.0 |
100.0 |
Source: TEMIT, Edison Investment Research. Note: Excludes cash. Numbers subject to rounding.
As shown in Exhibit 2, there have been major changes to the portfolio on a sectoral basis over the last 12 months. There is a much larger exposure to technology (19.3pp) and significant reductions in exposure to commodity sectors (energy 12.5pp and materials 5.5pp), along with a lower weighting to financials (8.0pp). The largest overweight is the consumer discretionary sector.
Exhibit 3: Portfolio geographic exposure vs benchmark (% unless stated)
Portfolio end-June 2016 |
Portfolio end-June 2015 |
Change (pts) |
|
Hong Kong/China |
19.3 |
29.4 |
-10.1 |
South Korea |
12.7 |
7.7 |
4.9 |
Brazil |
12.0 |
13.3 |
-1.2 |
India |
9.0 |
5.7 |
3.3 |
Taiwan |
8.9 |
0.0 |
8.9 |
Thailand |
5.5 |
13.8 |
-8.3 |
UK |
5.4 |
3.9 |
1.5 |
Russia |
5.2 |
2.0 |
3.2 |
Indonesia |
5.0 |
6.8 |
-1.8 |
South Africa |
4.6 |
5.3 |
-0.8 |
Peru |
3.7 |
2.6 |
1.1 |
Pakistan |
3.2 |
4.7 |
-1.5 |
Hungary |
1.2 |
0.0 |
1.2 |
Cambodia |
0.8 |
0.0 |
0.8 |
Mexico |
0.8 |
0.0 |
0.8 |
Saudi Arabia |
0.8 |
0.0 |
0.8 |
Kenya |
0.5 |
0.0 |
0.5 |
Turkey |
0.5 |
3.4 |
-2.9 |
Other |
0.7* |
1.4** |
-0.6 |
100.0 |
100.0 |
Source: TEMIT, Edison Investment Research. Note: Excludes cash. Numbers subject to rounding. *Argentina and Philippines; **Jordan, Nigeria and Singapore.
As shown in Exhibit 3, a broad geographic exposure is maintained with changes to country weightings less dramatic than sectoral changes. The largest decreases are in Hong Kong/China (10.1pp) and Thailand (8.3pp), with the largest increase to Taiwan (8.9pp), led by investment in technology companies including Taiwan Semiconductor Manufacturing and Hon Hai Precision Industry (an electronics manufacturer).
Performance: Improvement in near-term results
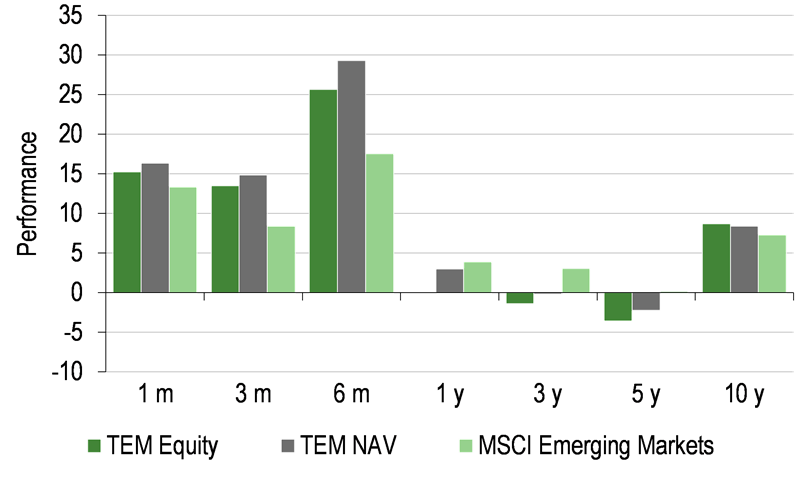
For FY16 (ending March) TEMIT underperformed the benchmark, with a NAV total return of 8.8% compared to the total return of the MSCI Emerging Markets index of 17.1%; however, as shown in the exhibits below, near-term performance has improved. The largest detractor to performance in FY16 was Brilliance China Automotive, whose share price decline contributed 1.7% to relative underperformance. Longer term, performance over three and five years has been affected by TEMIT’s exposure to resource stocks, which has now been reduced; however, relative performance over 10 years remains positive both in terms of NAV and share price total returns.
|
Exhibit 4: Investment trust performance to 30 June 2016 |
|
Price, NAV and benchmark total return performance, one-year rebased |
Price, NAV and benchmark total return performance (%) |
|
|
|
Source: Thomson Datastream, Edison Investment Research. Note: Three-, five- and 10-year performance figures annualised. |
|
TEMIT’s NAV has outperformed the MSCI Emerging Markets index over one, three and six months and is now only modestly behind the benchmark over one year. Both share price and NAV total returns are ahead of the benchmark over 10 years. As a reference to UK investors, TEMIT’s NAV and share price have outperformed the FTSE All-Share index over the shorter time periods shown in Exhibit 5; its NAV has also modestly outperformed over one year. The 10-year performance versus the FTSE All-Share index is positive in both NAV and share price terms.
|
Exhibit 5: Share price and NAV total return performance, relative to indices (%) |
||||||||
|
One month |
Three months |
Six months |
One year |
Three years |
Five years |
10 years |
|
Price relative to MSCI Emerging Markets |
1.7 |
4.7 |
6.9 |
(3.8) |
(12.4) |
(17.4) |
13.7 |
|
NAV relative to MSCI Emerging Markets |
2.6 |
6.0 |
10.0 |
(0.9) |
(9.2) |
(11.5) |
10.7 |
|
Price relative to MSCI World |
7.0 |
4.3 |
12.8 |
(13.2) |
(32.1) |
(51.1) |
1.9 |
|
NAV relative to MSCI World |
8.0 |
5.5 |
16.1 |
(10.5) |
(29.6) |
(47.6) |
(0.7) |
|
Price relative to FTSE All-Share |
12.1 |
8.4 |
20.5 |
(2.2) |
(19.2) |
(38.5) |
36.3 |
|
NAV relative to FTSE All-Share |
13.1 |
9.7 |
24.0 |
0.7 |
(16.2) |
(34.2) |
32.7 |
|
|
Source: Thomson Datastream, Edison Investment Research. Note: Data to end-June 2016. Geometric calculation. |
||||||||
|
Exhibit 6: NAV performance relative to MSCI Emerging Markets over 10 years |
||||||||
|
||||||||
|
Source: Thomson Datastream, Edison Investment Research |
||||||||
Exhibit 6 shows the performance of TEMIT’s NAV versus its benchmark over the last 10 years. Periods of underperformance were seen between late 2007 and late 2008, during the global financial crisis and in 2015, a period characterised by weak commodity prices. However, these have been outweighed by periods of outperformance. Notably, there has been a significant improvement in near-term relative performance, coinciding with the change in lead manager of the fund.
Discount: In a widening trend, with near-term volatility
Over the last three years there has been a widening in the discount. The current share price discount to cum-income NAV of 12.5% compares to the averages of the last one and three years of 12.8% and 11.1% respectively. Volatility in the discount recently increased following the Brexit vote. The board is active in managing the discount. In FY16, 20.9m shares (6.6% of shares in issue at the start of the financial year) were repurchased at an average price of 447.3p and discounts between 9.6% and 15.4%, which increased NAV by 0.8%. As shown in Exhibit 1, share repurchases have continued in FY17 – to date 6.9m shares at an average price of 464.7p.
|
Exhibit 7: Share price discount to NAV (including income) over three years |
|
|
Source: Thomson Datastream, Edison Investment Research |
Capital structure and fees
TEMIT is a conventional investment trust with a single share class; there are currently 291.1m ordinary shares in issue. Gearing of up to 10% of net assets is permitted, but has not been utilised in recent years. The board is cautious with regard to the use of gearing as emerging markets are inherently volatile and stock market moves are unpredictable in both extent and timing. The manager has indicated that he would support a modest level of gearing, given his positive long-term outlook for emerging markets; any changes made by the board with respect to gearing would be carried out after consultation with major shareholders. TEMIT aims to remain near fully invested; cash at the end of June 2016 was 3.6%.
TEMIT pays a management and administration fee to Templeton Asset Management of 1.10% of net assets; no performance fee is payable. In FY16, the ongoing charge rose to 1.22% versus 1.20% in the previous year due to a reduction in average net assets.
Dividend policy and record
TEMIT aims for capital growth rather than yield, but dividends are paid annually (Exhibit 1). In FY16, earnings per share of 7.05p were 24% lower than the previous year. However, the level of revenue reserves built up in prior years supported the dividend being maintained at 8.25p (FY16 coverage ratio of 85%); this followed five years of dividend increases.
Peer group comparison
Exhibit 8 shows the AIC Emerging Markets sector excluding trusts with market caps lower than £50m; TEMIT is by far the largest of the peers. Its NAV total returns for most periods shown are at the lower end of the selected group, although it ranks equal third over one year after a recent improvement in performance. Risk-adjusted returns as measured by Sharpe ratios are in line over one year and modestly below average over three years. TEMIT’s discount to NAV is wider than the peer group average, while its ongoing charge is one of the lowest and there is no performance fee. Among the five trusts in the group that pay a dividend, TEMIT’s yield is lower than average.
Exhibit 8: Selected peer group as at 19 July 2016
% unless stated |
Market cap £m |
NAV TR 1 Year |
NAV TR 3 Year |
NAV TR 5 Year |
NAV TR 10 Year |
Sharpe 1y (NAV) |
Sharpe 3y (NAV) |
Discount (ex-par) |
Ongoing charge |
Perf. fee |
Net gearing |
Dividend yield (%) |
Templeton Emerging Mkts IT |
1,572.3 |
13.9 |
5.0 |
(4.7) |
143.2 |
(0.5) |
(0.3) |
(13.3) |
1.22 |
No |
100 |
1.5 |
Aberdeen Emerging Markets |
242.4 |
13.2 |
12.9 |
3.6 |
78.9 |
(0.7) |
(0.2) |
(15.5) |
1.12 |
Yes |
100 |
N/A |
Aberdeen Frontier Markets IT |
101.0 |
7.8 |
9.5 |
28.2 |
-- |
(0.6) |
(0.2) |
(8.2) |
1.63 |
Yes |
98 |
N/A |
BlackRock Frontiers |
205.4 |
13.9 |
27.8 |
69.8 |
-- |
(0.7) |
0.3 |
1.1 |
1.45 |
Yes |
105 |
3.3 |
Fundsmith Emerging Equities Trust |
224.7 |
11.1 |
-- |
-- |
-- |
(0.8) |
(1.1) |
1.4 |
1.73 |
No |
100 |
N/A |
Genesis Emerging Markets Fund |
766.6 |
14.5 |
14.4 |
16.5 |
157.4 |
(0.5) |
(0.1) |
(12.6) |
1.55 |
No |
100 |
N/A |
JPMorgan Emerging Markets |
840.6 |
16.1 |
21.6 |
24.7 |
157.0 |
(0.3) |
0.1 |
(12.8) |
1.16 |
No |
97 |
0.9 |
JPMorgan Global Emerg Mkts Inc |
335.3 |
13.4 |
8.7 |
29.3 |
-- |
(0.5) |
(0.2) |
(0.8) |
1.24 |
No |
107 |
4.3 |
Utilico Emerging Markets |
414.5 |
10.8 |
22.5 |
40.5 |
179.0 |
(0.7) |
0.2 |
(9.4) |
1.14 |
Yes |
120 |
3.2 |
Group weighted average |
13.8 |
13.2 |
15.8 |
148.9 |
(0.5) |
(0.2) |
(10.5) |
1.30 |
102 |
2.0 |
||
TEMIT rank in peer group |
1 |
3= |
8 |
8 |
4 |
4 |
8 |
8 |
6 |
4 |
4 |
Source: Morningstar, Edison Investment Research. Note: TR=total return. Sharpe ratio is a measure of risk-adjusted return. The ratios shown are calculated by Morningstar for the past 12- and 36-month periods by dividing a fund’s annualised excess returns over the risk-free rate by its annualised standard deviation. Net gearing is total assets less cash and equivalents as a percentage of net assets.
The board
There are currently seven members on the TEMIT board, six of whom are independent. Paul Manduca was appointed to the board in August 2015 and became chairman in November 2015. The other independent directors (and years of appointment) are Christopher Brady and Peter Harrison (2007), Hamish Buchan (2008) and Beatrice Hollond (2014). Non-independent director Gregory Johnson was appointed in 2007; he is chairman and director of Franklin Resources, the parent company of the investment manager. Neil Collins, former senior independent director, stood down at the July 2016 AGM. His successor is Simon Jeffreys who is currently on the board of St James’s Place, SimCorp, Henderson International Income Investment Trust and Aon UK. Hamish Buchan has taken over as senior independent director.
|
Euromoney Institutional Investor