Last close As at 05/08/2026
NZD4.75
▲ −0.03 (−0.63%)
Market capitalisation
NZD499m
Research: Healthcare
AFT Pharmaceuticals recently reported its FY18 results. Operating revenue grew 15.7% compared to FY17, approximately double the 8.1% growth seen the year before. The Australian market, which now represents over 61% of revenues at N$49.2m, was leading the way with 32.7% growth, thanks to patients switching from codeine-containing products. Revenues in New Zealand fell by 7% from NZ$29.2m to NZ$27.1m due to the company no longer being the sole supplier of Metoprolol. Maxigesic continues to do well internationally and is now launched in 10 countries.
Written by
AFT Pharmaceuticals |
Strong FY18 results |
Financial update |
Pharma & biotech |
30 May 2018 |
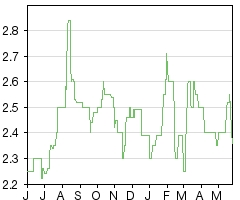
Share price performance
Business description
Next events
Analysts
AFT Pharmaceuticals is a research client of Edison Investment Research Limited |
|||||||||||||||||||||||||||||||||||||||||||||||
AFT Pharmaceuticals recently reported its FY18 results. Operating revenue grew 15.7% compared to FY17, approximately double the 8.1% growth seen the year before. The Australian market, which now represents over 61% of revenues at N$49.2m, was leading the way with 32.7% growth, thanks to patients switching from codeine-containing products. Revenues in New Zealand fell by 7% from NZ$29.2m to NZ$27.1m due to the company no longer being the sole supplier of Metoprolol. Maxigesic continues to do well internationally and is now launched in 10 countries.
Year end |
Revenue (NZ$m) |
PBT* |
EPS* |
DPS |
P/E |
Yield |
03/17 |
69.2 |
(18.5) |
(0.19) |
0.0 |
N/A |
N/A |
03/18 |
80.1 |
(12.9) |
(0.13) |
0.0 |
N/A |
N/A |
03/19e |
99.6 |
0.0 |
0.05 |
0.0 |
N/A |
N/A |
03/20e |
120.7 |
9.9 |
0.10 |
0.0 |
23.6 |
N/A |
Note: *PBT and EPS are normalised, excluding amortisation of acquired intangibles, exceptional items and share-based payments.
Australia is the key near-term revenue driver
Revenue in Australia was up 32.7% in FY18 compared to FY17, thanks in large part to Maxigesic sales increasing by 65%. Growth is expected to continue to be robust as patients switch from codeine-containing products (which are no longer available over the counter after 1 February 2018 due to re-scheduling) to Maxigesic.
FY19 a key year for Maxigesic globally
Maxigesic is currently sold and launched in 10 countries and distribution agreements are in place in a total of 125. New launches were negatively affected by slower than expected registrations in the EU, but the company believes that regulatory delays are behind it, with launches in countries such as Spain, Portugal, France, Ireland and the Nordics expected by the end of CY18.
A potential positive catalyst in New Zealand
In January, the New Zealand Medicines Classification Committee announced a recommendation that all codeine combination medicines be upscheduled from over-the-counter to prescription-only status from 2020. This should boost Maxigesic sales in AFT’s home market considerably once it takes effect.
Valuation: NZ$478m or NZ$4.91 per share
We are increasing our valuation to NZ$478m or NZ$4.91 per share from NZ$460m or NZ$4.73 per share, mainly due to increased expectations for Australian revenues due to higher Maxigesic sales and rolling forward our NPV. This was partly mitigated by slight reductions in expectations for New Zealand and Rest of World (RoW), and a higher net debt balance. We continue to expect that AFT will achieve EBITDA break-even in FY19.
Momentum increasing
AFT recently reported operating revenue of NZ$80.1m for FY18, ending on 31 March 2018. This marks a 15.7% increase over FY17, a marked acceleration in sales growth compared to the 8.1% growth seen over the year before. The pretax loss for the period was NZ$12.7m, compared to an FY17 loss of NZ$18.3m.
Exhibit 1: FY18 results by segment
NZ$000s |
Revenues (2018) |
Revenues (2017) |
Loss before tax (2018) |
Loss before tax (2017) |
Australia |
49,193 |
37,064 |
538 |
(3,663) |
New Zealand |
27,096 |
29,168 |
(4,598) |
(5,782) |
Asia |
1,286 |
1,005 |
(698) |
(689) |
Rest of World |
2,496 |
1,968 |
(7,907) |
(8,226) |
Total |
80,071 |
69,205 |
(12,666) |
(18,330) |
Source: AFT Pharmaceuticals
The Australian segment reported particularly strong results, thanks to Maxigesic revenues increasing by 65% (due to less stringent scheduling for Maxigesic, as well as the announcement that products containing codeine would no longer be available without a prescription), which is especially impressive as that growth is on top of the 133% growth seen in FY17 for Maxigesic in Australia.. The outlook for Maxigesic in Australia remains strong, as market research conducted by the company suggests that 40-47% of current consumers who buy 750m OTC codeine analgesics each year in Australia could switch to another OTC analgesic rather than get a doctor’s prescription, which they have been forced to do as of 1 February 2018 (two months before the end of FY18).
Additional Maxigesic launches coming in FY19
Maxigesic is now sold and launched in a total of 10 countries – Australia, New Zealand, Brunei, Israel, Italy, Malta, Serbia, Singapore, United Arab Emirates and the UK. New launches were negatively affected by slower than expected registrations in the EU, but the company believes regulatory delays are behind it with launches in countries such as Spain, Portugal, France, Ireland and the Nordics expected by the end of CY18. Additionally, licensing discussions are ongoing in areas such as the US, Canada, China, Russia and Brazil.
Exhibit 2: Current and upcoming Maxigesic launches
Country |
Status |
Australia |
Launched |
New Zealand |
Launched |
Israel |
Launched |
Italy |
Launched |
Malta |
Launched |
Serbia |
Launched |
Singapore/Brunei |
Launched |
UK |
Launched |
United Arab Emirates |
Launched |
Iraq |
Launch pending CY Q218 |
Malaysia |
Launch pending CY Q218 |
Central America |
Launch pending CY Q218 |
Ireland |
Launch pending CY Q218 |
Belgium |
Launch pending CY H218 |
Luxembourg |
Launch pending CY H218 |
France |
Launch pending CY H218 |
Hong Kong |
Launch pending CY H218 |
Spain |
Launch pending CY Q418 |
Portugal |
Launch pending CY Q418 |
Nordics |
Launch pending CY Q418 |
Mexico |
Launch pending CY Q418 |
Eastern Europe & Balkans |
Launch pending CY18 |
US and Canada |
Licensing discussions starting |
China, South Korea and Taiwan |
Licensing discussions starting |
Russia |
Licensing discussions starting |
Brazil and Latin America |
Licensing negotiations underway |
Country |
Australia |
New Zealand |
Israel |
Italy |
Malta |
Serbia |
Singapore/Brunei |
UK |
United Arab Emirates |
Iraq |
Malaysia |
Central America |
Ireland |
Belgium |
Luxembourg |
France |
Hong Kong |
Spain |
Portugal |
Nordics |
Mexico |
Eastern Europe & Balkans |
US and Canada |
China, South Korea and Taiwan |
Russia |
Brazil and Latin America |
Status |
Launched |
Launched |
Launched |
Launched |
Launched |
Launched |
Launched |
Launched |
Launched |
Launch pending CY Q218 |
Launch pending CY H218 |
Launch pending CY Q418 |
Launch pending CY18 |
Licensing discussions starting |
Licensing negotiations underway |
Source: AFT Pharmaceuticals
Valuation
We are increasing our valuation to NZ$478m or NZ$4.91 per share from NZ$460m or NZ$4.73 per share, mainly due to increased expectations for Australian revenues and rolling forward our NPV. This was partly mitigated by slight reductions to expectations for New Zealand and RoW and a higher net debt balance. Our fundamental assumptions such as terminal growth and terminal EBIT margin remain unchanged. We expect to update our valuation following additional information regarding the status of Maxigesic launches.
Exhibit 3: DCF sensitivity table (NZ$/share)
Terminal EBIT margin |
|||||
Terminal revenue growth |
15% |
25% |
34% |
38% |
42% |
-2% |
2.29 |
3.05 |
3.73 |
4.03 |
4.34 |
-1% |
2.37 |
3.20 |
3.94 |
4.28 |
4.61 |
0% |
2.47 |
3.38 |
4.20 |
4.57 |
4.93 |
1% |
2.59 |
3.61 |
4.52 |
4.92 |
5.33 |
2% |
2.75 |
3.89 |
4.91 |
5.37 |
5.82 |
3% |
2.95 |
4.25 |
5.42 |
5.94 |
6.46 |
4% |
3.21 |
4.73 |
6.09 |
6.70 |
7.30 |
5% |
3.58 |
5.40 |
7.03 |
7.76 |
8.49 |
Source: Edison Investment Research
Financials
We have increased our revenue estimates for FY19 from NZ$98.0m to NZ$99.6m due to the acceleration in sales in Australia, although this was partially offset by slightly lower estimates for New Zealand and RoW. We have also increased our SG&A expense estimates for FY19 by NZ$1.1m due to higher than expected spending in FY18 and decreased R&D expense estimates by NZ$2.2m due to lower than expected spending and the fact that the significant clinical trials for Maxigesic oral and IV formulations are largely completed. We are also introducing 2020 estimates (see Exhibit 4), which include operating revenue of $120.7m, indicating growth of 21.1%, with growth driven by both Australia and Maxigesic launches globally. The company reported a cash position of NZ$6.8m at the end of FY18 and has a further US$5m (NZ$7.2m) available from a loan facility, which can be drawn by 30 September 2018.
Exhibit 4: Edison forecast changes
NZ$m |
2019e |
2020e |
||
Old |
New |
Old |
New |
|
Revenue |
98.0 |
99.6 |
N/A |
120.7 |
PBT, normalised |
(0.54) |
0.04 |
N/A |
9.86 |
EPS, normalised (NZ$) |
(0.01) |
0.00 |
N/A |
0.10 |
Source: Edison Investment Research
Exhibit 5: Financial summary
NZ$000 |
2016 |
2017 |
2018 |
2019e |
2020e |
||
March |
NZ GAAP |
NZ GAAP |
NZ GAAP |
NZ GAAP |
NZ GAAP |
||
PROFIT & LOSS |
|||||||
Revenue |
|
|
64,014 |
69,205 |
80,071 |
99,634 |
120,742 |
Cost of Sales |
(40,435) |
(43,207) |
(45,880) |
(52,987) |
(59,841) |
||
Gross Profit |
23,579 |
25,998 |
34,191 |
46,646 |
60,901 |
||
EBITDA |
|
|
(7,821) |
(15,125) |
(10,479) |
1,918 |
11,729 |
Operating Profit (before amort. and except.) |
(7,667) |
(14,982) |
(10,353) |
2,044 |
11,855 |
||
Intangible Amortisation |
114 |
183 |
214 |
214 |
214 |
||
Exceptionals |
0 |
0 |
0 |
0 |
0 |
||
Other |
(618) |
2,245 |
741 |
778 |
817 |
||
Operating Profit |
(8,171) |
(12,554) |
(9,398) |
3,036 |
12,886 |
||
Net Interest |
(3,145) |
(3,531) |
(2,527) |
(2,000) |
(2,000) |
||
Profit Before Tax (norm) |
|
|
(10,812) |
(18,513) |
(12,880) |
44 |
9,855 |
Profit Before Tax (reported) |
|
|
(11,316) |
(16,085) |
(11,925) |
1,036 |
10,886 |
Tax |
42 |
(58) |
(58) |
0 |
0 |
||
Profit After Tax (norm) |
(10,770) |
(18,571) |
(12,938) |
44 |
9,855 |
||
Profit After Tax (reported) |
(11,274) |
(16,143) |
(11,983) |
1,036 |
10,886 |
||
Average Number of Shares Outstanding (m) |
96.8 |
97.1 |
97.2 |
97.3 |
97.3 |
||
EPS (NZ$) |
|
|
(0.11) |
(0.19) |
(0.13) |
0.00 |
0.10 |
EPS - normalised (c) |
|
|
(11.12) |
(19.12) |
(13.30) |
4.56 |
10.13 |
EPS - (reported) (NZ$) |
|
|
(0.12) |
(0.17) |
(0.12) |
0.01 |
0.11 |
Dividend per share (c) |
0.00 |
0.00 |
0.00 |
0.00 |
0.00 |
||
Gross Margin (%) |
36.8 |
37.6 |
42.7 |
46.8 |
50.4 |
||
EBITDA Margin (%) |
N/A |
N/A |
N/A |
1.9 |
9.7 |
||
Operating Margin (before GW and except.) (%) |
N/A |
N/A |
N/A |
2.1 |
9.8 |
||
BALANCE SHEET |
|||||||
Fixed Assets |
|
|
3,249 |
4,171 |
8,291 |
10,933 |
13,618 |
Intangible Assets |
2,111 |
2,548 |
5,118 |
7,561 |
10,004 |
||
Tangible Assets |
407 |
386 |
330 |
529 |
771 |
||
Investments |
731 |
1,237 |
2,843 |
2,843 |
2,843 |
||
Current Assets |
|
|
62,055 |
54,060 |
48,312 |
54,106 |
63,527 |
Stocks |
17,686 |
18,718 |
24,412 |
24,399 |
27,103 |
||
Debtors |
16,288 |
19,362 |
16,954 |
22,471 |
24,961 |
||
Cash |
28,055 |
15,980 |
6,946 |
7,236 |
11,462 |
||
Other |
26 |
0 |
0 |
0 |
0 |
||
Current Liabilities |
|
|
(13,511) |
(15,019) |
(18,489) |
(19,467) |
(21,503) |
Creditors |
(13,511) |
(15,019) |
(18,489) |
(19,467) |
(21,503) |
||
Short term borrowings |
0 |
0 |
0 |
0 |
0 |
||
Long Term Liabilities |
|
|
(23,161) |
(23,426) |
(30,654) |
(37,854) |
(37,854) |
Long term borrowings |
(23,161) |
(23,426) |
(30,654) |
(37,854) |
(37,854) |
||
Other long term liabilities |
0 |
0 |
0 |
0 |
0 |
||
Net Assets |
|
|
28,632 |
19,786 |
7,460 |
7,718 |
17,788 |
CASH FLOW |
|||||||
Operating Cash Flow |
|
|
(11,326) |
(15,473) |
(8,319) |
(1,927) |
9,251 |
Net Interest |
(3,145) |
(3,531) |
(2,527) |
(2,000) |
(2,000) |
||
Tax |
42 |
(58) |
(58) |
0 |
0 |
||
Capex |
(694) |
(1,598) |
(2,853) |
(2,982) |
(3,024) |
||
Acquisitions/disposals |
0 |
0 |
(3,002) |
0 |
0 |
||
Financing |
38,357 |
9,042 |
877 |
0 |
0 |
||
Dividends |
(1,652) |
0 |
(412) |
0 |
0 |
||
Net Cash Flow |
21,582 |
(11,618) |
(16,294) |
(6,910) |
4,226 |
||
Opening net debt/(cash) |
|
|
16,039 |
(4,894) |
7,446 |
23,708 |
30,618 |
HP finance leases initiated |
0 |
0 |
0 |
0 |
0 |
||
Other |
(649) |
(722) |
32 |
(0) |
(0) |
||
Closing net debt/(cash) |
|
|
(4,894) |
7,446 |
23,708 |
30,618 |
26,392 |
Source: Company accounts, Edison Investment Research
|
|
The placing has given Celyad a cash boost of €46.1m gross adding to the €34m on 31 December 2017. Celyad is designing a set of sophisticated clinical trials to expand understanding of its novel NKR CAR T-cell therapy. The THINK study, focused on AML and colorectal cancers, showed a near complete response (CR) in AML in Q417 plus two other AML responses and two colorectal stable disease cases. The highest THINK dose range should complete in H218. The SHRINK study, NKR CAR T-cells plus chemotherapy in metastatic colorectal cancer (mCRC), has dosed its first patient. The indicative value has been adjusted to €1040m, €85 per share.