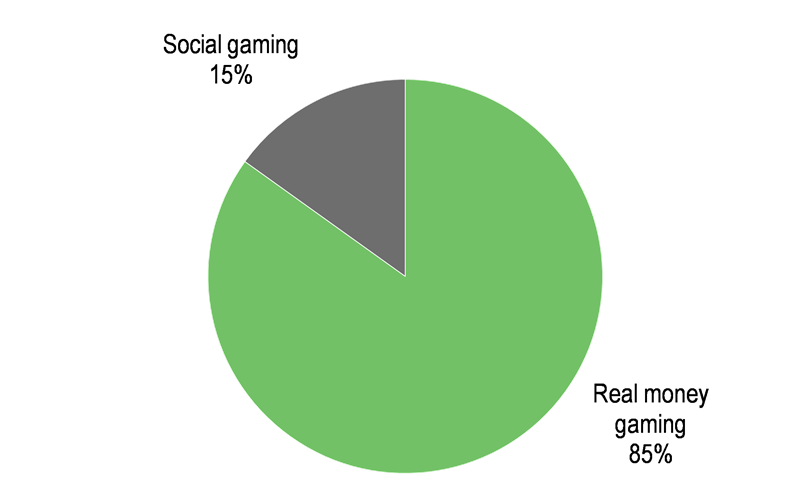
Financials: strong growth in FY16, acquisitions will boost FY17
Exhibit 10 analyses the FY16 results and our forecasts down to the EBITDA level while Exhibit 11 shows our overall numbers. Part of the reported growth in FY16 came from the full year effect of InfiApps (only in for one month of FY15). Stride also provided FY15 pro forma results, adjusted for InfiApps and also for the full year effect of POC (only in for nine-months of FY15).
Reported revenue and adjusted EBITDA increased by 72% and 68% to £47.8m and £12.3m respectively; pro forma increases were 22% and 27%, an excellent performance. The results were in line with our estimates but Stride’s 19 September trading update had reported that adjusted EBITDA would be “not less than £12.3m” and thus there was perhaps a small element of disappointment at the lack of a beat. Adjusted (diluted) EPS increased by 45% to 20.3p (our estimate 19.6p) which represented a pro forma increase of 6%.
FY16 real money gaming (RMG) EBITDA up 17% (up 33% proforma)
FY16 RMG revenue increased by 31% (both reported and like-for-like). There was a 37% increase in funded players (to 71,220) and 7% increase in yield per player to £120 per month (£27.70 per week). On average a player stays for 18-20 weeks, generating a lifetime value of £507 in FY16 (up 5%). Stride does not disclose the cost of acquiring players, which is competitively sensitive, but we believe it is around £100 ie the gross profit per player is over £400. The FY16 RMG adjusted EBITDA was £8.2m, 17% up on FY15 (reported) and 33% on a pro forma (adjusting for POC). The margin was very similar on a pro forma basis at 23.5% (FY15P: 23.2%). Gaming tax (POC) is 15% of UK NGR and we estimate that FY16 marketing costs were c 25% of revenue, with total distribution costs at c 36% of and admin costs at c 26%.
Exhibit 10: Recent results and estimates
Year end 31 August (£m) |
FY15 |
FY15P |
FY16 RMG* |
FY16 social* |
FY16 |
FY17e |
FY18e |
Stride real money gaming (RMG) |
26.7 |
26.7 |
35.0 |
|
35.0 |
42.0 |
52.5 |
Tarco/8Ball real money gaming (RMG) |
|
|
|
|
33.4 |
36.0 |
Social gaming |
1.1 |
12.6 |
|
12.8 |
12.8 |
13.4 |
14.5 |
Net gaming revenue (NGR) |
27.8 |
39.3 |
35.0 |
12.8 |
47.8 |
88.8 |
103.0 |
COS (POC gaming tax) |
(2.8) |
(3.6) |
(5.4) |
0.0 |
(5.4) |
(11.3) |
(16.8) |
% of RMG NGR |
10.3% |
13.5% |
15.4% |
0.0% |
15.4% |
15.0% |
19.0% |
Gross profit |
25.1 |
35.7 |
29.6 |
12.8 |
42.4 |
77.5 |
86.2 |
Marketing cost |
(7.0) |
(9.6) |
(8.7) |
(2.2) |
(10.9) |
(20.7) |
(23.4) |
Marketing % |
25.2% |
24.4% |
25.0% |
17.0% |
22.8% |
23.4% |
22.7% |
Other distribution costs |
(2.9) |
(6.8) |
(4.1) |
(3.6) |
(7.8) |
(17.0) |
(19.7) |
Other distribution % |
10.4% |
17.4% |
11.9% |
28.2% |
16.2% |
19.1% |
19.2% |
Admin costs |
(7.8) |
(9.5) |
(8.5) |
(2.9) |
(11.4) |
(20.2) |
(22.0) |
Admin % |
28.2% |
24.3% |
24.3% |
22.8% |
23.9% |
22.8% |
21.4% |
Adjusted EBITDA |
7.3 |
9.7 |
8.2 |
4.1 |
12.3 |
19.5 |
21.0 |
RMG EBITDA |
7.0 |
6.2 |
|
|
8.2 |
15.3 |
16.5 |
Social gaming EBITDA |
0.3 |
3.5 |
|
|
4.1 |
4.2 |
4.5 |
Adjusted EBITDA margin |
26.3% |
24.7% |
23.5% |
32.0% |
25.8% |
22.0% |
20.4% |
RMG EBITDA margin % |
26.4% |
23.2% |
|
|
23.5% |
20.3% |
18.6% |
Social gaming EBITDA margin % |
24.3% |
28.0% |
|
|
32.0% |
31.3% |
31.0% |
Source: Stride Gaming, Edison Investment Research. Note* figures in italics are Edison estimates.
Margin expansion in social gaming in FY16
InfiApps focused more on profitability than revenues in FY16, increasing the level of player engagement and monetisation. The daily ARPPU increased by 22% to $35 yet pro forma revenues only increased by 1.8% and constant currency revenues slipped 6%, implying that player numbers were down. However, proforma EBITDA increased by 17% to £4.1m, a margin of 32% (FY15P: 28%) and compared with the £14.6m initial acquisition cost (plus earn-out) the business will have been usefully accretive. Distribution costs are higher in social than in RMG (we estimate c 45%) since platforms such as the iOS App Store and Google Play charge c 30% of revenues for hosting. The admin ratio is broadly similar but of course social gaming revenues do not bear the 15% POC gaming tax.
Acquisitions are accretive in FY17
We materially increased our forecasts in our 19 September Update note to include Tarco/8Ball: we raised our FY17e EBITDA by 46% (to £19.5m) and diluted EPS by 14% (to 22.5p). We are not changing them at this stage, since November and December are important trading months; we believe we are the lower end of a market consensus EBITDA range of £19.5m to £20.2m. Overall we expect RMG revenues of £75.4m, including £33.4m from Tarco/8Ball, an approximate 18% like-for-like growth rate. Our forecast FY17 RMG EBITDA of £15.3m implies a 20.3% margin (FY16: 23.5%) since both Taro and 8Ball pay third-party platform fees and Tarco in particular was much less efficiently run (offering useful scope for improvement).
Our social gaming forecasts are also unchanged since we assume the improved player engagement will flow through to a cautious 5% revenue improvement in FY17, with the EBITDA margin dropping slightly (31.3% versus 32.0%) to allow for a little additional marketing.
Overall our FY17 forecasts are for 59% EBITDA growth and 11% adjusted EPS growth.
Synergies to offset POC cost pressures in FY18
Prior to the acquisitions of Tarco and 8Ball we forecast virtually flat EBITDA in FY18 due to the extension of the POC gaming tax to ‘free play’ ie essentially taxing gross (pre-bonus) revenues rather than NGR. If we assume a 25% rate of bonusing this raises the effective rate on NGR to 20%, but we assume a small amount of mitigation and non-UK revenues and apply a 19% rate. The earn-out periods end in August 2017 (8Ball) and December 2017 (Tarco) and beyond this Stride believes that it can achieve £2.5m of cost synergies (across marketing, admin and distribution) and £3m of revenue synergies (increasing LTV, yield, cash hold and cross-selling lapsing Tarco/8Ball players onto its higher margin proprietary platform). Adding in c 8% growth in social gaming gives us overall revenue of £103m in FY18e (up 16%), EBITDA of £21.0m (up 8%) and adjusted EPS of 23.6p (up 5%) allowing for a modest increase in tax rate, to c 8%.
Net cash and strong positive cash flows
Stride generated £13.7m of operating cash flow (after tax) in FY16, an EBITDA conversion rate of 111%. The £22.2m cost of acquisitions was more than covered by £25.9m net proceeds from the August fund-raise (12.0m new shares at 225p/share) and year end net cash (after player balances and the £8m loan taken out to fund the InfiApps deal) was £11.3m (end FY15: net debt of £3.1m). On top of that Stride is holding £3m of cash in escrow for the Tarco earn-out. The total cash balance was £10.3m more that our £4.0m estimate, but working capital was favourably affected by the timing of the Tarco and 8Ball acquisitions on the last day of the financial year and adjusting for this, we believe the underlying position was as we expected.
Stride’s RMG business generally has very high cash conversion of c 100% while the social gaming rate is c 70%. Stride has already paid a £4.0m earn-out payment in respect of InfiApps but the payments for Tarco and 8Ball do not fall due until FY18 (and will be part settled in shares). With fairly modest capex requirements we expect net cash to increase to £15.5m by August 2017 (unchanged from our previous forecast). Net cash should continue to rise strongly in FY18 too, in the absence of further likely acquisitions.
Progressive dividend policy
Stride declared a final dividend of 1.4p, which when added to the 1.1p interim dividend makes a full year total of 2.5p (Edison estimate: 2.4p). It will be paid on 1 February 2017 to shareholders on the register on 5 January. The payout ratio is still relatively low (c 12% of adjusted earnings) as befits a growth company with plenty of opportunities to put cash towards acquisitions, but the board nevertheless has a stated objective of a progressive dividend policy.
Debt refinanced at an attractive rate
Stride financed £8.0m of the InfiApps consideration in July 2015 by way of a shareholder loan bearing a 7.5% interest rate. Post year end, in November 2016 it refinanced it with an £8m loan facility with Barclays, which matures in four years’ time and only bears an interest rate of 3.6% plus LIBOR. We believe this demonstrates Stride’s credibility as a still relatively young company.
The £8.0m debt was only 7.5% of FY16 year-end grow assets of £105.7m, up from £48.7m at August 2015 due to the acquisitions (intangible assets increased from £36.4m to £73.6m). Year-end net assets were £69.2m, up from £30.8m.
Exhibit 11: Financial summary
|
|
£m |
2014 |
2015 |
2016 |
2017e |
2018e |
August |
|
|
UK GAAP |
IFRS |
IFRS |
IFRS |
IFRS |
PROFIT & LOSS |
|
|
|
|
|
|
|
Revenue |
|
|
8.5 |
27.8 |
47.8 |
88.8 |
103.0 |
Cost of Sales |
|
|
0.0 |
(2.8) |
(5.4) |
(11.3) |
(16.8) |
Gross Profit |
|
|
8.5 |
25.1 |
42.4 |
77.5 |
86.2 |
EBITDA |
|
|
1.2 |
7.3 |
12.3 |
19.5 |
21.0 |
Operating Profit (norm) |
|
|
1.2 |
7.3 |
12.0 |
18.7 |
20.0 |
Amortisation of acquired intangibles |
|
(0.3) |
(2.5) |
(4.2) |
(9.0) |
(9.0) |
Exceptionals |
|
|
(0.1) |
(3.3) |
(5.1) |
(5.0) |
0.0 |
Share based payments |
|
|
0.0 |
(1.0) |
(1.9) |
0.0 |
0.0 |
Operating Profit |
|
|
0.8 |
0.4 |
0.8 |
4.7 |
11.0 |
Net Interest |
|
|
0.0 |
(0.1) |
(0.7) |
(0.4) |
(0.4) |
Profit Before Tax (norm) |
|
|
1.2 |
7.2 |
11.3 |
18.3 |
19.6 |
Profit Before Tax (FRS 3) |
|
|
0.8 |
0.4 |
0.1 |
4.3 |
10.6 |
Tax (reported) |
|
|
0.0 |
0.1 |
(0.5) |
(1.3) |
(1.6) |
Profit After Tax (norm) |
|
|
1.2 |
6.2 |
10.9 |
17.1 |
18.0 |
Profit After Tax (FRS 3) |
|
|
0.8 |
0.4 |
(0.4) |
3.1 |
9.0 |
|
|
|
|
|
|
|
|
Average Number of Shares Outstanding (m) |
|
31.2 |
43.8 |
51.5 |
67.4 |
70.0 |
EPS - normalised (p) |
|
|
0.0 |
14.2 |
21.2 |
25.3 |
25.8 |
EPS - normalised fully diluted (p) |
|
|
4.0 |
14.0 |
20.3 |
22.5 |
23.6 |
EPS - (IFRS) (p) |
|
|
0.0 |
0.9 |
(0.8) |
4.5 |
12.9 |
Dividend per share (p) |
|
|
0.00 |
0.00 |
2.50 |
2.80 |
3.00 |
|
|
|
|
|
|
|
|
Gross Margin (%) |
|
|
100.0 |
90.1 |
88.7 |
87.3 |
83.7 |
EBITDA Margin (%) |
|
|
14.6 |
26.3 |
25.8 |
22.0 |
20.4 |
Operating Margin (before GW and except.) (%) |
|
14.6 |
26.1 |
25.0 |
21.1 |
19.4 |
|
|
|
|
|
|
|
|
BALANCE SHEET |
|
|
|
|
|
|
|
Fixed Assets |
|
|
0.1 |
37.1 |
78.7 |
77.2 |
75.5 |
Intangible Assets |
|
|
0.0 |
36.4 |
73.6 |
72.0 |
70.0 |
Tangible Assets |
|
|
0.0 |
0.2 |
0.7 |
0.8 |
1.0 |
Investments |
|
|
0.1 |
0.5 |
4.4 |
4.4 |
4.5 |
Current Assets |
|
|
5.7 |
11.7 |
27.1 |
31.9 |
38.2 |
Stocks |
|
|
0.0 |
0.0 |
0.0 |
0.0 |
0.0 |
Debtors |
|
|
5.7 |
4.2 |
5.8 |
6.4 |
7.0 |
Cash |
|
|
0.0 |
7.4 |
21.1 |
25.5 |
31.2 |
Other |
|
|
0.0 |
0.0 |
0.2 |
0.0 |
0.0 |
Current Liabilities |
|
|
(1.2) |
(7.7) |
(26.1) |
(20.6) |
(19.7) |
Creditors |
|
|
(0.8) |
(5.2) |
(16.3) |
(18.6) |
(17.5) |
Player balances |
|
|
(0.4) |
(1.4) |
(1.8) |
(2.0) |
(2.2) |
Short term borrowings |
|
|
0.0 |
(1.1) |
(8.0) |
0.0 |
0.0 |
Long Term Liabilities |
|
|
0.0 |
(10.2) |
(10.5) |
(15.5) |
(10.5) |
Long term borrowings |
|
|
0.0 |
(8.0) |
0.0 |
(8.0) |
(8.0) |
Other long term liabilities |
|
|
0.0 |
(2.2) |
(10.5) |
(7.5) |
(2.5) |
Net Assets |
|
|
4.6 |
30.8 |
69.2 |
73.0 |
83.5 |
|
|
|
|
|
|
|
|
CASH FLOW |
|
|
|
|
|
|
|
Operating Cash Flow |
|
|
0.0 |
4.6 |
14.4 |
13.5 |
19.9 |
Net Interest |
|
|
0.0 |
0.0 |
(0.6) |
(0.4) |
(0.3) |
Tax |
|
|
0.0 |
(0.1) |
(0.7) |
(1.1) |
(1.4) |
Capex |
|
|
0.0 |
(0.6) |
(1.9) |
(2.1) |
(2.3) |
Acquisitions/disposals |
|
|
0.0 |
(18.1) |
(22.2) |
(4.0) |
(18.4) |
Financing |
|
|
0.0 |
10.4 |
25.9 |
0.0 |
10.0 |
Dividends |
|
|
0.0 |
(3.0) |
(0.6) |
(1.8) |
(2.0) |
Net Cash Flow |
|
|
0.0 |
(6.6) |
14.4 |
4.1 |
5.5 |
Opening net debt/(cash) |
|
|
0.0 |
0.0 |
3.1 |
(11.3) |
(15.5) |
Moving in player balances |
|
|
0.0 |
1.0 |
0.0 |
0.0 |
0.0 |
Other adjustments |
|
|
0.0 |
2.5 |
0.0 |
(0.0) |
(0.0) |
Closing net debt/(cash) |
|
|
0.0 |
3.1 |
(11.3) |
(15.5) |
(21.0) |
Source: Stride Gaming accounts, Edison Investment Research. Note: net debt/(cash) excludes player balances.
Contact details |
Revenue by geography (FY16) |
Unit 450 Highgate Studios 53-79 Highgate Road London NW5 1TL
+44 (0)20 7284 6080
www.stridegaming.com |

|
Contact details |
Unit 450 Highgate Studios 53-79 Highgate Road London NW5 1TL
+44 (0)20 7284 6080
www.stridegaming.com |
Revenue by geography (FY16) |
|
Management team |
|
CEO: Eitan Boyd |
COO: Darren Sims |
Eitan has more than 15 years’ experience in the online bingo sector. He founded the B2B Globalcom bingo network (later renamed Dragonfish) in 2002, which he later sold to 888 Holdings for $42m in 2007. Following the successful sale of Globalcom, he went on to launch Wink Bingo, a B2C bingo operator, which was also sold to 888 in 2009 for £60m. |
Darren has more than a decade of online bingo experience. He was instrumental in the sale of Globalcom to 888 and was integral to its post-acquisition assimilation as 888’s VP of Bingo. He rejoined Eitan Boyd at Spacebar Media just before the sale of Wink Bingo to 888 |
CFO: Ronen Kannor |
Non-executive chairman: Nigel Payne |
Ronen joined the Stride senior management team in October 2014. He has more than 12 years’ experience in financial management roles in the real estate and business intelligence sectors |
Nigel has more than 20 years’ experience as a director of both publicly listed and private companies. He previously held the CFO and CEO roles at Sportingbet. Sportingbet was one of the world’s largest online gambling companies and during his time there Nigel was involved in successfully executing a number of M&A transactions. |
Management team |
CEO: Eitan Boyd |
Eitan has more than 15 years’ experience in the online bingo sector. He founded the B2B Globalcom bingo network (later renamed Dragonfish) in 2002, which he later sold to 888 Holdings for $42m in 2007. Following the successful sale of Globalcom, he went on to launch Wink Bingo, a B2C bingo operator, which was also sold to 888 in 2009 for £60m. |
COO: Darren Sims |
Darren has more than a decade of online bingo experience. He was instrumental in the sale of Globalcom to 888 and was integral to its post-acquisition assimilation as 888’s VP of Bingo. He rejoined Eitan Boyd at Spacebar Media just before the sale of Wink Bingo to 888 |
CFO: Ronen Kannor |
Ronen joined the Stride senior management team in October 2014. He has more than 12 years’ experience in financial management roles in the real estate and business intelligence sectors |
Non-executive chairman: Nigel Payne |
Nigel has more than 20 years’ experience as a director of both publicly listed and private companies. He previously held the CFO and CEO roles at Sportingbet. Sportingbet was one of the world’s largest online gambling companies and during his time there Nigel was involved in successfully executing a number of M&A transactions. |
Principal shareholders |
(%) |
Gal Holdings |
28.7 |
Poppy Investments |
11.8 |
Bedell Trustees (Blue Rock Trust) |
10.4 |
Bedell (Eagle Eye Trust) |
3.7 |
Credo Capital |
3.3 |
Swisspartners Wealth Management |
3.1 |
Directors |
5.4 |
|
Companies named in this report |
32Red (TTR), 888 Holdings (888), GVC Holdings (GVC); Intertain Group (IT), Rank Group (RNK). |
|
Edison, the investment intelligence firm, is the future of investor interaction with corporates. Our team of over 100 analysts and investment professionals work with leading companies, fund managers and investment banks worldwide to support their capital markets activity. We provide services to more than 400 retained corporate and investor clients from our offices in London, New York, Frankfurt, Sydney and Wellington. Edison is authorised and regulated by the Financial Conduct Authority. Edison Investment Research (NZ) Limited (Edison NZ) is the New Zealand subsidiary of Edison. Edison NZ is registered on the New Zealand Financial Service Providers Register (FSP number 247505) and is registered to provide wholesale and/or generic financial adviser services only. Edison Investment Research Inc (Edison US) is the US subsidiary of Edison and is regulated by the Securities and Exchange Commission. Edison Investment Research Limited (Edison Aus) [46085869] is the Australian subsidiary of Edison and is not regulated by the Australian Securities and Investment Commission. Edison Germany is a branch entity of Edison Investment Research Limited [4794244]. www.edisongroup.com DISCLAIMER
Copyright 2016 Edison Investment Research Limited. All rights reserved. This report has been commissioned by Stride Gaming (Draft) plc and prepared and issued by Edison for publication globally. All information used in the publication of this report has been compiled from publicly available sources that are believed to be reliable, however we do not guarantee the accuracy or completeness of this report. Opinions contained in this report represent those of the research department of Edison at the time of publication. The securities described in the Investment Research may not be eligible for sale in all jurisdictions or to certain categories of investors. This research is issued in Australia by Edison Aus and any access to it, is intended only for "wholesale clients" within the meaning of the Australian Corporations Act. The Investment Research is distributed in the United States by Edison US to major US institutional investors only. Edison US is registered as an investment adviser with the Securities and Exchange Commission. Edison US relies upon the "publishers' exclusion" from the definition of investment adviser under Section 202(a)(11) of the Investment Advisers Act of 1940 and corresponding state securities laws. As such, Edison does not offer or provide personalised advice. We publish information about companies in which we believe our readers may be interested and this information reflects our sincere opinions. The information that we provide or that is derived from our website is not intended to be, and should not be construed in any manner whatsoever as, personalised advice. Also, our website and the information provided by us should not be construed by any subscriber or prospective subscriber as Edison’s solicitation to effect, or attempt to effect, any transaction in a security. The research in this document is intended for New Zealand resident professional financial advisers or brokers (for use in their roles as financial advisers or brokers) and habitual investors who are “wholesale clients” for the purpose of the Financial Advisers Act 2008 (FAA) (as described in sections 5(c) (1)(a), (b) and (c) of the FAA). This is not a solicitation or inducement to buy, sell, subscribe, or underwrite any securities mentioned or in the topic of this document. This document is provided for information purposes only and should not be construed as an offer or solicitation for investment in any securities mentioned or in the topic of this document. A marketing communication under FCA Rules, this document has not been prepared in accordance with the legal requirements designed to promote the independence of investment research and is not subject to any prohibition on dealing ahead of the dissemination of investment research. Edison has a restrictive policy relating to personal dealing. Edison Group does not conduct any investment business and, accordingly, does not itself hold any positions in the securities mentioned in this report. However, the respective directors, officers, employees and contractors of Edison may have a position in any or related securities mentioned in this report. Edison or its affiliates may perform services or solicit business from any of the companies mentioned in this report. The value of securities mentioned in this report can fall as well as rise and are subject to large and sudden swings. In addition it may be difficult or not possible to buy, sell or obtain accurate information about the value of securities mentioned in this report. Past performance is not necessarily a guide to future performance. Forward-looking information or statements in this report contain information that is based on assumptions, forecasts of future results, estimates of amounts not yet determinable, and therefore involve known and unknown risks, uncertainties and other factors which may cause the actual results, performance or achievements of their subject matter to be materially different from current expectations. For the purpose of the FAA, the content of this report is of a general nature, is intended as a source of general information only and is not intended to constitute a recommendation or opinion in relation to acquiring or disposing (including refraining from acquiring or disposing) of securities. The distribution of this document is not a “personalised service” and, to the extent that it contains any financial advice, is intended only as a “class service” provided by Edison within the meaning of the FAA (ie without taking into account the particular financial situation or goals of any person). As such, it should not be relied upon in making an investment decision. To the maximum extent permitted by law, Edison, its affiliates and contractors, and their respective directors, officers and employees will not be liable for any loss or damage arising as a result of reliance being placed on any of the information contained in this report and do not guarantee the returns on investments in the products discussed in this publication. FTSE International Limited (“FTSE”) © FTSE 2016. “FTSE®” is a trade mark of the London Stock Exchange Group companies and is used by FTSE International Limited under license. All rights in the FTSE indices and/or FTSE ratings vest in FTSE and/or its licensors. Neither FTSE nor its licensors accept any liability for any errors or omissions in the FTSE indices and/or FTSE ratings or underlying data. No further distribution of FTSE Data is permitted without FTSE’s express written consent. |
Frankfurt +49 (0)69 78 8076 960 Schumannstrasse 34b 60325 Frankfurt Germany |
London +44 (0)20 3077 5700 280 High Holborn London, WC1V 7EE United Kingdom |
New York +1 646 653 7026 245 Park Avenue, 39th Floor 10167, New York US |
Sydney +61 (0)2 9258 1161 Level 25, Aurora Place 88 Phillip St, Sydney NSW 2000, Australia |
Wellington +64 (0)48 948 555 Level 15, 171 Featherston St Wellington 6011 New Zealand |
Frankfurt +49 (0)69 78 8076 960 Schumannstrasse 34b 60325 Frankfurt Germany |
London +44 (0)20 3077 5700 280 High Holborn London, WC1V 7EE United Kingdom |
New York +1 646 653 7026 245 Park Avenue, 39th Floor 10167, New York US |
Sydney +61 (0)2 9258 1161 Level 25, Aurora Place 88 Phillip St, Sydney NSW 2000, Australia |
Wellington +64 (0)48 948 555 Level 15, 171 Featherston St Wellington 6011 New Zealand |
|
Edison, the investment intelligence firm, is the future of investor interaction with corporates. Our team of over 100 analysts and investment professionals work with leading companies, fund managers and investment banks worldwide to support their capital markets activity. We provide services to more than 400 retained corporate and investor clients from our offices in London, New York, Frankfurt, Sydney and Wellington. Edison is authorised and regulated by the Financial Conduct Authority. Edison Investment Research (NZ) Limited (Edison NZ) is the New Zealand subsidiary of Edison. Edison NZ is registered on the New Zealand Financial Service Providers Register (FSP number 247505) and is registered to provide wholesale and/or generic financial adviser services only. Edison Investment Research Inc (Edison US) is the US subsidiary of Edison and is regulated by the Securities and Exchange Commission. Edison Investment Research Limited (Edison Aus) [46085869] is the Australian subsidiary of Edison and is not regulated by the Australian Securities and Investment Commission. Edison Germany is a branch entity of Edison Investment Research Limited [4794244]. www.edisongroup.com DISCLAIMER
Copyright 2016 Edison Investment Research Limited. All rights reserved. This report has been commissioned by Stride Gaming (Draft) plc and prepared and issued by Edison for publication globally. All information used in the publication of this report has been compiled from publicly available sources that are believed to be reliable, however we do not guarantee the accuracy or completeness of this report. Opinions contained in this report represent those of the research department of Edison at the time of publication. The securities described in the Investment Research may not be eligible for sale in all jurisdictions or to certain categories of investors. This research is issued in Australia by Edison Aus and any access to it, is intended only for "wholesale clients" within the meaning of the Australian Corporations Act. The Investment Research is distributed in the United States by Edison US to major US institutional investors only. Edison US is registered as an investment adviser with the Securities and Exchange Commission. Edison US relies upon the "publishers' exclusion" from the definition of investment adviser under Section 202(a)(11) of the Investment Advisers Act of 1940 and corresponding state securities laws. As such, Edison does not offer or provide personalised advice. We publish information about companies in which we believe our readers may be interested and this information reflects our sincere opinions. The information that we provide or that is derived from our website is not intended to be, and should not be construed in any manner whatsoever as, personalised advice. Also, our website and the information provided by us should not be construed by any subscriber or prospective subscriber as Edison’s solicitation to effect, or attempt to effect, any transaction in a security. The research in this document is intended for New Zealand resident professional financial advisers or brokers (for use in their roles as financial advisers or brokers) and habitual investors who are “wholesale clients” for the purpose of the Financial Advisers Act 2008 (FAA) (as described in sections 5(c) (1)(a), (b) and (c) of the FAA). This is not a solicitation or inducement to buy, sell, subscribe, or underwrite any securities mentioned or in the topic of this document. This document is provided for information purposes only and should not be construed as an offer or solicitation for investment in any securities mentioned or in the topic of this document. A marketing communication under FCA Rules, this document has not been prepared in accordance with the legal requirements designed to promote the independence of investment research and is not subject to any prohibition on dealing ahead of the dissemination of investment research. Edison has a restrictive policy relating to personal dealing. Edison Group does not conduct any investment business and, accordingly, does not itself hold any positions in the securities mentioned in this report. However, the respective directors, officers, employees and contractors of Edison may have a position in any or related securities mentioned in this report. Edison or its affiliates may perform services or solicit business from any of the companies mentioned in this report. The value of securities mentioned in this report can fall as well as rise and are subject to large and sudden swings. In addition it may be difficult or not possible to buy, sell or obtain accurate information about the value of securities mentioned in this report. Past performance is not necessarily a guide to future performance. Forward-looking information or statements in this report contain information that is based on assumptions, forecasts of future results, estimates of amounts not yet determinable, and therefore involve known and unknown risks, uncertainties and other factors which may cause the actual results, performance or achievements of their subject matter to be materially different from current expectations. For the purpose of the FAA, the content of this report is of a general nature, is intended as a source of general information only and is not intended to constitute a recommendation or opinion in relation to acquiring or disposing (including refraining from acquiring or disposing) of securities. The distribution of this document is not a “personalised service” and, to the extent that it contains any financial advice, is intended only as a “class service” provided by Edison within the meaning of the FAA (ie without taking into account the particular financial situation or goals of any person). As such, it should not be relied upon in making an investment decision. To the maximum extent permitted by law, Edison, its affiliates and contractors, and their respective directors, officers and employees will not be liable for any loss or damage arising as a result of reliance being placed on any of the information contained in this report and do not guarantee the returns on investments in the products discussed in this publication. FTSE International Limited (“FTSE”) © FTSE 2016. “FTSE®” is a trade mark of the London Stock Exchange Group companies and is used by FTSE International Limited under license. All rights in the FTSE indices and/or FTSE ratings vest in FTSE and/or its licensors. Neither FTSE nor its licensors accept any liability for any errors or omissions in the FTSE indices and/or FTSE ratings or underlying data. No further distribution of FTSE Data is permitted without FTSE’s express written consent. |
Frankfurt +49 (0)69 78 8076 960 Schumannstrasse 34b 60325 Frankfurt Germany |
London +44 (0)20 3077 5700 280 High Holborn London, WC1V 7EE United Kingdom |
New York +1 646 653 7026 245 Park Avenue, 39th Floor 10167, New York US |
Sydney +61 (0)2 9258 1161 Level 25, Aurora Place 88 Phillip St, Sydney NSW 2000, Australia |
Wellington +64 (0)48 948 555 Level 15, 171 Featherston St Wellington 6011 New Zealand |
Frankfurt +49 (0)69 78 8076 960 Schumannstrasse 34b 60325 Frankfurt Germany |
London +44 (0)20 3077 5700 280 High Holborn London, WC1V 7EE United Kingdom |
New York +1 646 653 7026 245 Park Avenue, 39th Floor 10167, New York US |
Sydney +61 (0)2 9258 1161 Level 25, Aurora Place 88 Phillip St, Sydney NSW 2000, Australia |
Wellington +64 (0)48 948 555 Level 15, 171 Featherston St Wellington 6011 New Zealand |
|