Shore Capital Group
Written by
Shore Capital Group |
Progressing in uncertain markets |
H116 results |
Financial services |
26 September 2016 |
Share price performance
Business description
Next events
Analysts
Shore Capital Group is a research client of Edison Investment Research Limited |
|||||||||||||||||||||||||||||||||||||||||||||||
Stripping out last year’s radio spectrum licence sale, the group continued to grow in the first half against a difficult market backdrop. The results illustrate the benefits of diversification, with asset management continuing to expand and underlying progress evident in Capital Markets with the signing of new retained clients: both areas reported increased revenues in the first half. Investment is being made in additional staff to strengthen the research franchise and support growth in asset management.
Year |
Revenue (£m) |
PBT* |
EPS* |
DPS |
P/E |
Yield |
12/13 |
35.8 |
5.4 |
13.9 |
8.0 |
17.7 |
3.3 |
12/14 |
40.6 |
8.3 |
20.8 |
10.0 |
11.8 |
4.1 |
12/15 |
42.0 |
11.7 |
26.1 |
0.0 |
9.4 |
N/A |
12/16e |
35.5 |
4.9 |
11.5 |
5.0 |
21.2 |
2.0 |
Note: *2015 figures include radio spectrum sale.
First half results
First half revenues, excluding the radio spectrum sale from H115 figures, were up 7.8%: a creditable performance given an uncertain market backdrop in the run-up to the EU referendum. Margins were held at levels close to the prior year period and at more than 20% for both the Capital Markets and Asset Management segments. Profits in Capital Markets nearly matched the H115 level and, underpinned by the rising level of assets under management, profits in Asset Management were up by more than 11%. Reported basic earnings per share were down nearly 70%, but increased slightly compared with H215 (from 6.3p to 6.5p).
Market background and outlook
In the first eight months of 2016, the value of London Stock Exchange total equity issuance has fallen by 37% for the Main market and 24% for AIM. Shore Capital appears to have navigated this slowdown relatively well (see page 3 for a list of 2016 transactions). The market outlook remains clouded but, as the manner of Brexit becomes clearer, impediments to transactions should diminish while Shore Capital has been successful in extending its franchise, potentially entering a virtuous circle as it moves up the market cap scale. Asset Management has continued to increase AUM and, as the newer products extend their track record, should be better placed to attract further investors. Reflecting macro uncertainties, we have maintained our full year estimates broadly unchanged.
Valuation: Trading below book
Given the potential swings in stock market-related earnings and the occasional but substantial contributions from principal investments, it is difficult to assign a sustainable return on equity in a ROE/COE valuation. The current return (4-5%) is dampened by the strong balance sheet and is below our cost of equity assumption, but on a longer view we would expect this to strengthen and assuming a 9% return gives a value of c 360p (unchanged) compared with the 270p book value.
Company description
Founded in 1985 by Howard Shore, Shore Capital is an independent investment group with three main areas of business. Over the last four years Capital Markets has accounted for 67% of revenues, while Asset Management and Principal Finance have contributed 21% and 12% respectively. Capital Markets has been the main profit contributor but the potential for Principal Finance to generate substantial profits was demonstrated last year when the sale of German radio frequency spectrum licences generated net revenue of £9.2m. Capital Markets comprises four elements: market making, research-led broking, corporate finance and, since the end of 2015, a fixed income team previously at Edmund de Rothschild.
The Asset Management segment has two parts: private client and institutional funds. The private client area is a specialist in tax efficient funds including limited-life venture capital trusts (VCTs), Enterprise Investment Schemes (EIS) and funds intended to provide shelter from inheritance tax through business property relief. The institutional side of the activity manages and advises Puma Brandenburg and Brandenburg Realty (both funds investing in German properties) and St Peter Port Capital (a fund now focused on realising liquidity or value from its remaining holdings).
The Principal Finance activity invests the group’s own capital on an opportunistic basis. Following last year’s sale of radio spectrum licences, the group’s share of the book value of remaining licences is c £1.3m after minorities.
First half results
In a period that was marked by uncertainty ahead of the EU referendum, Shore Capital achieved revenue progress in both its Capital Markets and Asset Management businesses while virtually maintaining profit in Capital Markets and increasing Asset Management profits by 11% (see Exhibit 1). Both areas held margins at over 20%: 23% for Capital Markets and 25% in Asset Management respectively. Group revenues increased by 7.8% when the radio spectrum sale is excluded from the H115 figure.
In the absence of a significant disposal gain, Principal Finance moved into loss, reflecting administrative costs and a small impairment that accounts for the negative revenue figure.
Exhibit 1: Half year results summary
H115 |
H215 |
H116 |
% change H116/H115 |
|||
Revenue (£m) |
||||||
Capital Markets |
12,449 |
10,901 |
13,059 |
4.9 |
||
Asset Management |
4,853 |
4,647 |
5,200 |
7.2 |
||
Principal Finance |
8,610 |
492 |
(271) |
N/A |
||
Group |
25,912 |
16,040 |
17,988 |
-30.6 |
||
Profit before tax (£m) |
||||||
Capital Markets |
3,076 |
1,617 |
3,004 |
-2.3 |
||
Asset Management |
1,169 |
1,484 |
1,300 |
11.2 |
||
Principal Finance |
5,785 |
(646) |
(1,173) |
From profit to loss |
||
Central/other |
(485) |
(303) |
(690) |
42.3 |
||
Group |
9,545 |
2,152 |
2,441 |
-74.4 |
||
Pre-tax profit margin (%) |
||||||
Capital Markets |
24.7 |
14.8 |
23.0 |
|||
Asset Management |
24.1 |
31.9 |
25.0 |
|||
Earnings per share (p) |
||||||
EPS basic |
20.8 |
6.3 |
6.5 |
|||
EPS diluted |
20.1 |
6.0 |
6.2 |
|||
Source: Shore Capital, Edison Investment Research
The earnings per share comparison again reflects the radio licence spectrum sale in H115 with basic earnings per share down from 20.8p to 6.5p, but modestly ahead of the second half of last year (6.3p).
Exhibit 2 lists selected transactions and brokership appointments during the first half, reflecting an active period despite a muted market background during which AIM issuance, for example, was down 30% (see next section for further discussion of recent market trends). In total, eight new retained clients were added, taking the total to 65. Among the additions Shore Capital highlights Dairy Crest, Chesnara, Stride Gaming and Earthport.
Figures for the market-making activity within Capital Markets are not broken out, but the company indicates that revenues and profits were maintained at last year’s level despite a difficult market background with Shore Capital trading volumes up 11%.
To help build the research/broking franchise additions have been made to the research team in the consumer, financials, digital technology, media, housebuilding and building materials sectors.
Exhibit 2: Corporate finance selected recent transactions and appointments
Company |
Transaction/event |
Value |
Role |
Date |
Victoria Oil & Gas |
Appointment |
Mkt cap £42m |
As joint broker |
Aug-16 |
Stride Gaming |
Placing |
£27m |
Joint bookrunner |
Jul-16 |
NextEnergy Solar Fund |
Placing |
£43m |
Joint bookrunner |
Jul-16 |
Aminex |
Placing/open offer |
£19.5m |
Sole bookrunner |
Jul-16 |
Daily Internet |
Placing/acquisition |
£5m |
Broker |
Jun-16 |
Motorpoint Group |
Main market IPO/placing |
Mkt cap £200m |
Co-bookrunner |
May-16 |
Canadian Overseas Petroleum |
Appointment |
Mkt cap £18.7m |
UK broker |
May-16 |
Vernalis |
Placing |
£40m |
Joint bookrunner |
Apr-16 |
Stride Gaming |
Appointment |
Mkt cap £120m |
As joint broker |
Apr-16 |
Amryt Pharmaceuticals |
AIM IPO by reverse takeover |
Mkt cap £40m |
Lead manager, Nomad, joint broker |
Apr-16 |
Eden Research |
Placing |
£2.6m |
Lead manager |
Mar-16 |
Yü Energy |
Placing and AIM IPO |
£10m |
Nomad and sole broker |
Mar-16 |
Cerillion |
Placing and AIM IPO |
£10m |
Nomad and sole bookrunner |
Mar-16 |
Daily Internet |
Appointment |
Mkt cap £9m |
Nomad and joint broker |
Feb-16 |
Earthport |
Appointment |
Mkt cap £125m |
As joint broker |
Feb-16 |
Dairy Crest |
Appointment |
Mkt cap £830m |
As joint broker |
Feb-16 |
Market Tech |
Move to Main Market |
Mkt cap £850m |
Jan-16 |
Source: Shore Capital Group
Total assets under management (AUM) have increased from approximately £770m at the year end to £850m. On the institutional side of the business, following its fund-raising last year (€150m), Brandenburg Realty has made its first two property portfolio acquisitions, advised by Shore Capital. Puma Brandenburg has also been active in managing its portfolio properties and has completed a refinancing in the first half.
In the private client area Puma VCT 12 (tax year 2015/16) closed having raised £31m, which accounted for more than half the total raised in the limited-life VCT market. Puma VCT 13, for the current tax, year has been launched. The Puma Heritage fund, which is designed to offer full relief from inheritance tax after two years, has now passed its third anniversary and its NAV has increased to £25m. The investment team continues to identify a good flow of opportunities to invest in real estate loans at conservative loan-to-value ratios, so there should be significant capacity to meet demand from investors without weakening selection criteria. The Puma EIS service now has AUM of £40m. The Puma AIM Inheritance Tax Service (c £25m AUM) has passed its two-year anniversary and reports a 21.9% return over the two years to end June (31.8% ahead of the FTSE AIM All-Share Index).
The headcount in Asset Management has been increased to provide support to investment advisers and to bolster the investment team.
In its initial six months with Shore Capital the new fixed income team has made a positive contribution despite a particularly difficult market background.
Market background and outlook
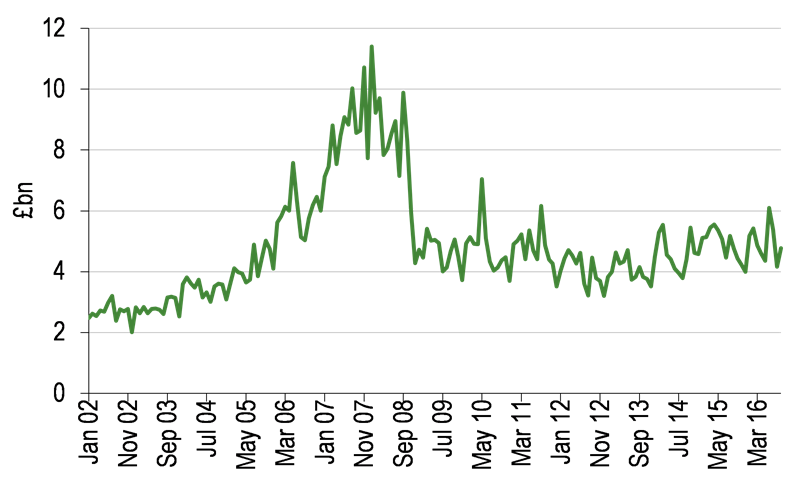
Uncertainty surrounding the EU referendum created a difficult environment for equity fund-raising and this is evident in the data for the value of new and further issuance from the London Stock Exchange shown in Exhibits 3 and 4. For the Main market, taking new and further issuance together, the first half saw a decline of 50% compared with the same period last year, while for AIM the equivalent figure was -30%. Taking figures through to end August gives declines of 37% (Main) and 24% (AIM).
|
Exhibit 3: LSE Main Market issuance |
Exhibit 4: LSE AIM issuance |
|
|
|
Source: LSE |
Source: LSE |
|
Exhibit 3: LSE Main Market issuance |
|
|
Source: LSE |
|
Exhibit 4: LSE AIM issuance |
|
|
Source: LSE |
The average value traded on the LSE order book has been quite resilient (Exhibit 5) – it was only 3.7% lower in the first half and 2.7% down in the period to end August. Market levels (Exhibit 6) have also proved resilient in the face of uncertainty and the Brexit vote, suggesting the market is currently adopting the sanguine view of the outcome. Shore Capital chairman, Howard Shore, is a proponent of the benefits to be derived from the increased flexibility the UK should have outside the EU and the potential to lighten regulatory burdens.
|
Exhibit 5: Average daily value traded LSE order book |
Exhibit 6: FTSE AIM, All-Share and Small Cap indices |
|
|
|
Source: LSE |
Source: Thomson Datastream |
|
Exhibit 5: Average daily value traded LSE order book |
|
|
Source: LSE |
|
Exhibit 6: FTSE AIM, All-Share and Small Cap indices |
|
|
Source: Thomson Datastream |
Arguably, the recent subdued level of issuance could be seen as an indicator of the potential for a bounceback in activity in a period of greater stability and confidence. However, significant uncertainties remain including the outcome of the US presidential election, the timing of prospective US rate rises and the likelihood of fluctuating views on the progress of Brexit negotiations. Turning to the outlook for Shore Capital, we are left with lack of clarity on the overall environment but encouragement from the progress made in terms of continuing to add new corporate clients in the Capital Markets area and expand AUM for Asset Management. As we indicate in the next section, our overall estimates for the full year are broadly unchanged.
Financials
We have updated our full year 2016 estimate to reflect the first half figures, but there are only limited changes:
■
Revenue £35.5m versus £35.6m previously.
■
Pre-tax profit £4.94m versus £4.93m.
■
EPS basic 12p, unchanged. EPS diluted 11.5p versus 11.2p.
On dividends there was no payment announced for the half year and no dividend was paid last year, but the group did return £10m to shareholders by way of a tender offer in December 2015. This was equivalent to155% of 2015 earnings and in the previous three years, on average, dividends equivalent to 55% of earnings were paid. While the board does not have a stated dividend policy, we would expect consideration to be given to alternative uses of cash in addition to the level of earnings when deciding on whether to pay a dividend and the level of payment. For the moment we have pencilled in a final dividend of 5p for the current year given the history of distributions in some form.
The balance sheet and liquidity remain strong with end-June cash of £16m, £8.8m of gilts and bonds and a £20m working capital debt facility that was undrawn at that point. Net cash was £5.5m compared with £12.5m at the year end, with the reduction reflecting a combination of a working capital outflow (-£5.8m, a number that can easily reverse in the short term) and dividends paid to minorities (-£2.1m).
Valuation
We have refreshed our peer valuation table in Exhibit 7; caution needs to be used when considering this comparison given the differences between the companies and the potentially volatile and lumpy nature of earnings in this sector. Since we published our initiation note in May this year, the average price-to-book ratio for the sector has been stable, but for Shore Capital has fallen from 1.2x to 0.9x; this is also below the 10-year average of 1.35x. Shore Capital trades on a below peer average price to book and the historical P/E ratio shown is at a discount to Numis. On a prospective basis, at 21.2x, Shore Capital would have the highest multiple of the profitable companies. The group’s return on equity is some way below those of Cenkos and Numis, but further realisations of radio frequency licences cannot be ruled out and last year’s disposal boosted the return to 9.2%. Shore Capital’s average return on equity between 2007 and 2015 was 6.3%, a period that included the financial crisis and a small negative return in 2011.
Exhibit 7: Quoted UK broker comparison
Price (p) |
Market cap (£m) |
Hist P/E (x) |
Price to book (x) |
Yield (%) |
ROE (%) |
|
Shore Capital |
245.0 |
53.3 |
9.0 |
0.9 |
0.0 |
4.2 |
Arden |
30.5 |
6.2 |
-2.8 |
0.9 |
0.0 |
-23.6 |
Cenkos |
97.5 |
55.3 |
3.6 |
2.2 |
9.7 |
43.0 |
Numis |
227.8 |
259.1 |
11.7 |
2.2 |
5.0 |
22.8 |
Panmure Gordon |
46.0 |
7.2 |
-0.4 |
0.4 |
0.0 |
-67.6 |
WH Ireland |
123.0 |
32.1 |
-43.8 |
2.5 |
1.6 |
-20.1 |
Average |
-3.8 |
1.5 |
2.7 |
-6.9 |
Source: Bloomberg, Edison Investment Research. Note: Prices as at 23 September 2016.
We have maintained the assumptions in our ROE/COE valuation model with the central value for sustainable return (9%) set above the 8% cost of equity and growth at 5%. The result is a central value of c 360p (unchanged). Given the difficulty of estimating earnings for a broking/investment banking business, selecting an appropriate sustainable return on equity is equally difficult. The sensitivity table below shows a range of indicated values based on different assumptions for cost of equity and return on equity.
Exhibit 8: ROE/COE valuation output variations (value per share, p)
Cost of equity |
||||||
7.0% |
7.5% |
8.0% |
8.5% |
10.0% |
||
Return on equity |
6.0% |
135 |
108 |
90 |
77 |
54 |
8.0% |
405 |
324 |
270 |
232 |
162 |
|
9.0% |
541 |
433 |
360 |
309 |
216 |
|
10.0% |
676 |
541 |
451 |
386 |
270 |
|
12.0% |
946 |
757 |
631 |
541 |
378 |
|
Source: Edison Investment Research
For reference we include a final table in this section summarising the recent performance of the peer group. This shows that, compared with the average, Shore Capital’s share price has been particularly weak over three months and year to date. This weakness, as with the below average price-to-book multiple noted above, could point to the potential for a strong bounce given a catalyst from positive stock-specific news or more general market sentiment.
Exhibit 9: Share price performance comparison (%)
One month |
Three months |
One year |
Ytd |
From 12m high |
|
Shore Capital |
4.3 |
-22.8 |
-39.9 |
-42.4 |
-42.4 |
Arden |
11.8 |
16.3 |
-35.2 |
-3.4 |
-35.2 |
Cenkos |
-6.6 |
-18.1 |
-27.9 |
-28.4 |
-37.0 |
Numis |
18.3 |
7.1 |
0.7 |
-6.1 |
-15.7 |
Panmure Gordon |
-6.8 |
-17.9 |
-63.8 |
-26.7 |
-63.8 |
WH Ireland |
-0.5 |
9.2 |
-6.9 |
12.2 |
-7.8 |
Average |
3.4 |
-4.4 |
-28.8 |
-15.8 |
-33.6 |
Source: Bloomberg. Note: Prices as at 13 September 2016.
Exhibit 10: Financial summary (£000s except where stated)
Year end 31 December |
2010 |
2011 |
2012 |
2013 |
2014 |
2015 |
2016e |
PROFIT & LOSS |
|||||||
Year to 31-Dec |
|||||||
Capital Markets |
26,268 |
22,545 |
22,653 |
25,796 |
30,129 |
23,350 |
25,309 |
Asset Management |
9,952 |
8,563 |
6,331 |
7,334 |
8,478 |
9,500 |
10,489 |
Principal Finance |
(737) |
(1,595) |
3,837 |
2,635 |
1,968 |
9,102 |
(271) |
Total revenue |
35,483 |
29,513 |
32,821 |
35,765 |
40,575 |
41,952 |
35,527 |
Cash costs |
(25,673) |
(29,163) |
(28,805) |
(29,262) |
(31,117) |
(29,086) |
(29,364) |
EBITDA |
9,810 |
350 |
4,016 |
6,503 |
9,458 |
12,866 |
6,163 |
Depreciation and amortisation |
(921) |
(868) |
(1,114) |
(1,102) |
(1,064) |
(1,039) |
(1,046) |
Share-based payments |
(161) |
(52) |
(54) |
0 |
(17) |
(4) |
(5) |
Operating profit |
8,728 |
(570) |
2,848 |
5,401 |
8,377 |
11,823 |
5,112 |
Net interest |
(359) |
(354) |
(321) |
8 |
(68) |
(126) |
(175) |
Other |
0 |
49 |
0 |
0 |
0 |
0 |
0 |
Profit before tax |
8,369 |
(875) |
2,527 |
5,409 |
8,309 |
11,697 |
4,937 |
Tax |
(1,977) |
(189) |
(494) |
(1,100) |
(1,804) |
(1,002) |
(1,177) |
Non-controlling interests |
(1,872) |
(24) |
(46) |
(911) |
(1,297) |
(4,250) |
(1,156) |
Profit after tax (FRS 3) |
4,520 |
(1,088) |
1,987 |
3,398 |
5,208 |
6,445 |
2,604 |
Average number of shares outstanding (m) |
24.7 |
24.3 |
24.2 |
24.2 |
24.2 |
23.8 |
21.8 |
Average, fully diluted no. of shares (m) |
25.5 |
24.8 |
24.3 |
24.5 |
25.1 |
24.7 |
22.6 |
EPS (p) |
18.3 |
(4.5) |
8.2 |
14.1 |
21.6 |
27.1 |
12.0 |
EPS (p) fully diluted |
17.7 |
(4.4) |
8.2 |
13.9 |
20.8 |
26.1 |
11.5 |
Dividend per share (p) |
8.8 |
5.0 |
5.0 |
8.0 |
10.0 |
0.0 |
5.0 |
EBITDA margin (%) |
27.6 |
1.2 |
12.2 |
18.2 |
23.3 |
30.7 |
17.3 |
Operating margin (%) |
24.6 |
-1.9 |
8.7 |
15.1 |
20.6 |
28.2 |
14.4 |
NAV per share (p) |
262.3 |
242.5 |
247.4 |
253.5 |
265.6 |
268.7 |
278.2 |
ROE (%) |
6.7 |
-1.8 |
3.4 |
5.6 |
8.3 |
9.2 |
4.4 |
BALANCE SHEET |
|||||||
Non-current assets |
24,598 |
21,653 |
20,210 |
19,901 |
19,100 |
19,555 |
20,962 |
Intangibles and goodwill |
381 |
4,632 |
4,436 |
4,406 |
4,002 |
2,222 |
2,436 |
Property, plant and equipment |
12,710 |
12,516 |
11,669 |
10,897 |
10,969 |
10,864 |
11,505 |
Investments and other |
11,507 |
4,505 |
4,105 |
4,598 |
4,129 |
6,469 |
7,020 |
Current assets |
113,210 |
98,113 |
100,435 |
111,185 |
95,406 |
103,250 |
110,192 |
Bull positions |
11,201 |
7,048 |
4,058 |
4,557 |
4,636 |
9,344 |
10,500 |
Cash |
44,249 |
47,305 |
30,443 |
41,395 |
30,658 |
22,113 |
19,075 |
Debtors and other |
57,760 |
43,760 |
65,934 |
65,233 |
60,112 |
71,793 |
80,617 |
Current liabilities |
(42,439) |
(26,758) |
(43,441) |
(52,883) |
(32,445) |
(45,972) |
(51,657) |
Bear positions |
(1,343) |
(786) |
(1,395) |
(1,033) |
(846) |
(946) |
(1,063) |
Short-term borrowings |
(339) |
(345) |
(327) |
(321) |
(341) |
(360) |
(401) |
Other current liabilities |
(40,757) |
(25,627) |
(41,719) |
(51,529) |
(31,258) |
(44,666) |
(50,193) |
Long-term liabilities |
(25,596) |
(27,579) |
(10,817) |
(9,241) |
(9,640) |
(9,791) |
(10,604) |
Long-term borrowings |
(25,424) |
(27,264) |
(10,549) |
(8,892) |
(9,105) |
(9,256) |
(10,110) |
Other long-term liabilities |
(172) |
(315) |
(268) |
(349) |
(535) |
(535) |
(494) |
Net assets |
69,773 |
65,429 |
66,387 |
68,962 |
72,421 |
67,042 |
68,892 |
CASH FLOW |
|||||||
Net cash from operations |
(2,750) |
4,225 |
846 |
15,123 |
(7,181) |
774 |
(368) |
Fixed asset investment |
(570) |
(525) |
(614) |
(340) |
(412) |
(363) |
(583) |
Acquisitions/disposals |
0 |
(914) |
0 |
(1,731) |
0 |
0 |
0 |
Other investing activities |
(4,916) |
459 |
93 |
297 |
211 |
7,121 |
(520) |
Share issuance |
484 |
166 |
0 |
0 |
0 |
0 |
0 |
Share purchases |
(3,419) |
(946) |
0 |
0 |
0 |
(10,047) |
0 |
Ordinary dividends |
(2,154) |
(2,132) |
(604) |
(2,175) |
(2,175) |
(1,208) |
0 |
Other financing |
(1,525) |
824 |
(514) |
230 |
(1,070) |
(4,914) |
(1,921) |
Other |
(337) |
(187) |
654 |
1,342 |
(574) |
(530) |
(1,095) |
Net cash flow |
(15,187) |
970 |
(139) |
12,746 |
(11,201) |
(9,167) |
(4,486) |
Opening net (debt)/cash |
33,637 |
18,486 |
19,696 |
19,567 |
32,182 |
21,212 |
12,497 |
FX |
36 |
240 |
10 |
(131) |
231 |
452 |
553 |
Closing net (debt)/cash |
18,486 |
19,696 |
19,567 |
32,182 |
21,212 |
12,497 |
8,564 |
Source: Edison Investment Research, Shore Capital Group accounts
|
|