Last close As at 05/08/2026
—
— 0.00 (0.00%)
Market capitalisation
—
Research: Financials
Secure Trust Bank
Written by
Secure Trust Bank |
Growing into its capital |
Full year results |
Banks |
26 April 2016 |
Share price performance
Business description
Next event
Analysts
Secure Trust Bank is a research client of Edison Investment Research Limited |
|||||||||||||||||||||||||||||||||||||||||||||||
Secure Trust Bank is an established ‘challenger’ with a record of organic profitable growth. The Everyday Loans Group sale provides substantial regulatory capital for organic and potentially inorganic growth. The move into mortgages will further diversify lending. Despite a record of rapid loan book expansion, an ROE/COE valuation model suggests the market is reluctant to make full allowance for profitable employment of the surplus.
Year end |
Operating |
PBT* |
EPS* |
DPS |
P/E |
Yield |
12/14 |
63.7 |
17.5 |
155.8 |
68.0 |
18.4 |
2.4 |
12/15 |
92.1 |
24.8 |
170.4 |
72.0** |
16.8 |
2.5 |
12/16e |
123.8 |
33.9 |
155.9 |
76.0 |
18.3 |
2.7 |
12/17e |
147.1 |
49.8 |
217.2 |
95.0 |
13.2 |
3.3 |
Note: *PBT and EPS are normalised, excluding amortisation of acquired intangibles, exceptional items and share-based payments. **2015 DPS ex 165p special dividend.
2015 results
Secure Trust Bank (STB) has continued the strong pace of growth in the loan book seen in recent years with continuing activities (excluding Everyday Loans Group, ELG) ahead 82% in 2015 and five-year compound growth of 64%. Revenue and profit before tax were up 39% and 40% respectively. Growth in the loan book meant that the common equity tier 1 ratio declined from 18.7% to 13.6%. Adjusting for the ELG sale and the proposed 165p special dividend, the ratio would have been 18.4%, providing scope for substantial further loan growth to replace ELG’s profit and more. The ordinary dividend was increased by 6% to 72p.
Outlook
Prospectively, the major theme remains the opportunity for STB to continue to grow its loan book rapidly and profitably at a time when the major incumbent banks remain focused on managing capital and core business. There appears to be good potential to expand in STB’s existing lines of business and the mortgage business, which is in the process of being launched, could in due course provide a third leg for the group alongside consumer and commercial lending. There are macro risks associated with reduced economic growth expectations and the outcome of the EU membership referendum, but in relative terms STB does not appear particularly sensitive to this and could conceivably use its capital opportunistically were there to be a period of market volatility.
Valuation: Reluctance to value growth potential
Comparing STB with a range of challenger banks and specialist lenders places it at the upper end of the range in terms of P/E and price to NAV ratios, but it also has a relatively high ROE (before the temporary depressive effect of the ELG sale). It looks fairly valued when plotting ROE versus P/NAV or within an ROE/COE model that only assumes an ROE of 16% but, factoring in a return of 19%, which is more consistent with deployment of surplus capital, points to a value of about 3,600p or 26% above the current share price.
Company description: Established challenger/specialist
Secure Trust Bank is a well-established specialist bank. It was incorporated in 1954 and since 1985 has been part of the Arbuthnot Banking Group, which currently holds 51.92% of STB shares. Secure Trust Bank was floated on AIM in 2011 and subsequently acquired the Everyday Loans Group (2012 – unsecured personal lending), V12 Finance Group (2013 – point of sale retail loans) and assets of Debt Managers Group (2013 – debt collection services). The bank’s core business has traditionally been the provision of banking services to UK customers who may not have been well-served by the larger banks. While it has offered current and budgeting accounts in the past, these are no longer available and following the disposal of Everyday Loans Group to Non-Standard Finance it does not have a branch network.
The remit has been progressively diversified in recent years from consumer unsecured lending to motor, retail point of sale and business finance; the latter includes real estate finance, invoice discounting and factoring and asset finance. This broadening of activity has contributed to strong expansion of the loan book since the financial crisis with compound growth of 64% between 2010 and 2015. The growth has primarily been in secured lending and the sale of ELG has reduced the unsecured part of the loan book contract further. The capital released allows STB to accelerate organic growth in motor, retail and SME lending books and to consider an acquisition should the right opportunity present itself. Looking ahead, the management team aims to have three broadly equal legs for the business: consumer, business and mortgage lending, with this third activity in the process of being prepared for launch.
The rapid expansion of the business and migration towards a more diverse portfolio suggest that it could be grouped with challenger banks, although, even in mortgages, it is not planning to take on large banks directly, instead focusing on specialist lending where returns can be more attractive. It also differentiates itself from some of the challengers in that, despite its growth, it has not driven for scale at the same pace and does not have a branch network. It is perhaps better described as a specialist challenger.
Full year 2015 results
■
Overall loan book growth of 73% to over £1bn (including Everyday Loans Group) and loan growth in continuing activities 82%.
■
Operating income increased 35% to £132.5m and profit before tax was £36.5m, up 40% (both including ELG).
■
Reported post-tax return on average equity of 21.8% versus 23.1% and an underlying 31% based on equity at a target common equity tier 1 ratio (CET1) of 12%.
■
Full year dividend of 72p (+6%).
■
Disposal of Everyday Loans Group now completed (13 April), with an expected post-tax profit of £115m; a special dividend of 165p or c £30m is to be paid.
■
CET1 ratio 13.6% at the year end and estimated at 24.1% adjusting for the ELG sale, while the leverage ratio was 10.4% rising to an estimated 18% allowing for the disposal.
Lending
Customer lending continued the rapid growth that has characterised recent years, with total loan growth of 72% in 2015 taking compound growth since 2010 to 64% (Exhibit 1). This reflects the group’s strategy of growing the loan book by addressing consumer and business markets with niche product offerings that command higher margins than standard/prime products.
The segmental analysis of the loan book for 2014 and 2015 is shown in Exhibit 2, highlighting the diversification of business areas, which has been broadening over the last three years. In absolute terms, the largest growth was seen in real estate finance, a business launched in 2013, and retail point of sale finance. The real estate finance book is split roughly 50/50 between funding for residential developments and residential investment finance (professional buy to let); the risk/reward balance of commercial development lending is seen as unattractive. Proportionately the newest parts of STB’s loan portfolio have seen the fastest growth, namely asset finance (hire purchase and finance leases) and commercial finance (invoice discounting and debt factoring). Prospectively, as noted above, the group is in the process of launching a mortgage business, looking to address the non-standard, near-prime part of the market.
|
Exhibit 1: STB customer loans since 2010 |
Exhibit 2: STB segmental customer loans (£m) |
|
|
|
Source: Secure Trust Bank |
|
Exhibit 1: STB customer loans since 2010 |
|
|
Source: Secure Trust Bank |
|
Exhibit 2: STB segmental customer loans (£m) |
|
|
Source: Secure Trust Bank |
Net interest income and impairments
STB’s net interest income increased by 49% (including ELG) in 2015, compared with growth in average loan balances of 68% with the differential evident in the reduced net interest margin (12.7% versus 14.0% shown in Exhibit 3), reflecting changes in loan mix and, potentially, distortions introduced by our simple average of loan balances over a period when growth was rapid.
Similarly, a 93% increase in the profit and loss impairment charge, to £16.8m, reflects a change from a low base, and the increase in impairments from 1.9% to 2.3% of average balances can be attributed to changes in mix and rapid growth. The group notes that the levels of impairment are running at below the rate assumed when the loans were made. An example of mix change is that retail point of sale finance has been extended into domestic appliances, where the level of impairment is higher but returns are correspondingly higher, and both interest margin and the impairment percentage have noticeably higher readings for 2015 than 2014 in our calculations.
Exhibit 3: Net interest income and impairments as % of average lending balances
(%) |
Net interest income |
Impairments |
||
2014 |
2015 |
2014 |
2015 |
|
Personal loans (including ELG) |
13.2 |
15.1 |
2.3 |
4.3 |
Motor loans |
21.5 |
21.9 |
3.1 |
4.8 |
Retail finance |
11.1 |
13.3 |
1.0 |
3.1 |
Real estate finance |
3.7 |
8.1 |
0.0 |
0.0 |
Asset finance |
0.0 |
6.4 |
0.0 |
0.0 |
Commercial finance |
0.0 |
2.3 |
0.0 |
0.0 |
Total |
14.0 |
12.7 |
1.9 |
2.3 |
Source: Edison Investment Research, Secure Trust Bank
Funding
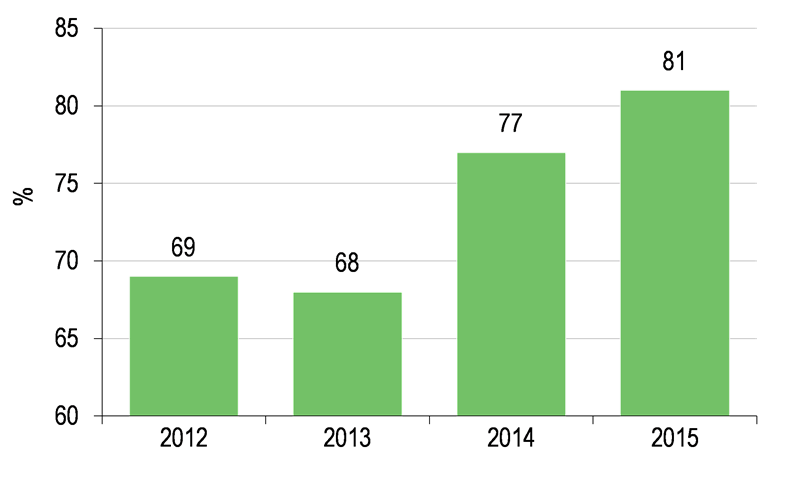
The group’s funding policy is unchanged with limited exposure to wholesale and interbank funding. Fixed-term, fixed-rate customer lending is broadly matched with customer deposits on a similar basis. Exhibit 4 shows the structure of deposits, with term deposits now accounting for 57% of the total and the increase in average tenor made to match the liability position. The growth in lending in 2015 was largely funded through customer deposits, with only modest use of the Funding for Lending scheme. As shown in Exhibit 5, the cost of funds has benefited from trends in market rates as maturing deposits have been replaced at lower rates. The year-end loan to deposit ratio was 104%, little changed from 2014 (102%).
|
Exhibit 4: Customer deposit growth and profile |
Exhibit 5: Interest cost as % of average deposits |
|
|
|
Source: Secure Trust Bank |
Source: Secure Trust Bank, Edison Investment Research |
|
Exhibit 4: Customer deposit growth and profile |
|
|
Source: Secure Trust Bank |
|
Exhibit 5: Interest cost as % of average deposits |
|
|
Source: Secure Trust Bank, Edison Investment Research |
Capital
The £50m of fresh equity capital raised in the second half of 2014 has been progressively deployed through growth in the loan book so that the CET1 ratio has fallen from 18.7% to 13.6% in 2015 and the leverage ratio has been reduced from 14.7% to 10.4% (compared with the 4% minimum stipulated by the Prudential Regulation Authority). Adjusted for the ELG disposal (see next section), the CET1 ratio would have been 24.1% and the leverage ratio18% at the year end.
Sale of Everyday Loans Group
Announced at the beginning of December 2015, the sale of ELG followed an unsolicited approach from Non Standard Finance. While STB was not looking to sell the business, the opportunity to reduce exposure to unsecured loans on favourable terms was attractive, with a competitive loosening of lending criteria evident in this area tending to support this decision. Under Non Standard Finance’s ownership there will be investment in ELG’s branches and a wider product offering addressing a broader customer base, providing opportunities for growth that would not have been pursued within STB. The terms of the transaction included:
■
A consideration of £127m, made up of £107m in cash and £20m in Non Standard Finance shares.
■
Repayment of £108m intercompany debt.
■
A loan of £30m from STB to Non Standard Finance.
■
A structure whereby the economic risk and reward relating to ELG from 30 November 2015 passed to Non Standard Finance on completion.
Completion was on 13 April 2016. The expected profit on disposal is more than £115m, and STB will pay a special dividend of 165p or c £30m to its shareholders.
STB will retain the remaining part of its personal unsecured loans business, Moneyway, which at the year-end had a lending balance of £74.3m (2014: £87.5m), with loans being closer to prime than at ELG and sourced through its established network of UK advisors.
Use of the proceeds
Even after the special dividend, there will still be significant capital headroom for organic expansion of other areas within the group, including the nascent mortgage business. Inorganic expansion is another option that will be seriously considered, but the group has a preference for building rather than buying. Simplistically applying a 12% CET1 and 35% risk weighting the group could write an additional £2bn of mortgage business or, alternatively, nearly £1bn of consumer and commercial business, assuming a 75% risk weighting. The assumptions in our estimates (see Financials section, page 7) mean that organic loan growth does absorb much of this surplus capital by 2018.
Modest add-on acquisition(s) could increase the pace at which the balance sheet becomes more efficient, but a larger transaction (STB was linked with Williams & Glyn in the press at one point) would in any case entail fresh equity and require a critical decision by parent Arbuthnot Banking on the level of its holding following such a transaction.
Financials
Earnings for 2015 were ahead of our expectation (Exhibit 11) and we have adjusted our estimates for the ELG disposal and subsequent deployment of capital through organic loan growth. There is an initial dilutive effect from the sale evident in the reduction of estimates for 2016, but thereafter estimates introduced for the first time for 2017 and 2018 show strong growth (39% and 28% respectively at the earnings per share level).
Exhibit 11: Estimate changes
Normalised EPS (p) |
Operating income (£m)* |
Dividend (p) |
|||||||
Old |
New |
% chg. |
Old |
New |
% chg. |
Old |
New |
% chg. |
|
2015a/e |
163.8 |
170.4 |
3.0 |
134.0 |
132.5 |
(1.1) |
75 |
72 |
(4.0) |
2016e |
180.3 |
155.9 |
(14.3) |
170.0 |
123.8 |
(27.2) |
85 |
76 |
(10.6) |
2017e |
N/A |
217.2 |
N/A |
147.1 |
N/A |
95 |
|||
2018e |
N/A |
277.6 |
N/A |
178.9 |
N/A |
107 |
|||
Source: Edison Investment Research. Note: *Total operating income including net interest income and net fees and 2015 includes ELG.
Loan book growth
Underlying our estimated earnings progression are our assumptions for loan growth, set out in Exhibit 12. Within the existing activities, management indicate that the emphasis will be on motor, retail and the commercial loan books. Personal unsecured lending is likely to see more moderate growth. The asset finance and commercial finance areas are relatively new and expected to see further substantial percentage growth as they increase their penetration. The mortgage business is assumed to grow rapidly from its launch this year, making a significant contribution to the total by 2018.
Exhibit 12: Loan book estimates
£m |
2014 |
2015 |
2016e |
2017e |
2018e |
Personal unsecured |
88 |
74 |
74 |
78 |
82 |
Motor vehicles |
138 |
166 |
199 |
239 |
286 |
Retail finance |
117 |
220 |
276 |
344 |
430 |
Mortgage |
0 |
0 |
20 |
200 |
400 |
Total retail lending |
342 |
460 |
569 |
861 |
1,199 |
Real estate finance |
134 |
368 |
644 |
837 |
1,005 |
Asset finance |
5 |
71 |
95 |
129 |
155 |
Commercial finance |
5 |
29 |
100 |
150 |
200 |
Total commercial lending |
143 |
468 |
839 |
1,116 |
1,359 |
Other |
43 |
32 |
28 |
24 |
20 |
Total lending |
528.6 |
961 |
1,436 |
2,001 |
2,578 |
Source: Edison Investment Research, Secure Trust Bank. Note: Historical numbers ex-ELG.
CET1 ratio and return on equity
The loan growth assumed, together with the payment of a special dividend of £30m this year and increasing ordinary dividends, means that our estimated CET1 ratio moves to 12.6% for 2018. This compares with the pro forma figure of 18% for end 2015, after adjusting for the ELG sale (see financial summary in Exhibit 16 for the expected evolution of risk assets and CET1).
The growth in mortgage lending results in a reduction in group net interest margin (net interest income as % of average loans) from 10.0% in 2015 to an estimated 7.4% by 2018. However, this should be seen in the light of the lower expected risk from this lending that is reflected in a fall in the group impairment charge as a percentage of average loan balances falling from 2.1% in 2015 to 1.6% in 2018e. It can be argued that this change in risk profile would warrant a lower target return on equity.
Group return on equity is set to fall significantly as the equity added through the ELG sale is deployed over several years. On our estimates the normalised ROE falls from 25.2% in 2015 to 14.1% in 2016 before rising towards 19% in 2018. This could prove a conservative figure depending on the extent to which operational leverage comes into play as the newer business areas operate at higher volumes while the overall net interest margin may prove too cautious depending on business mix.
Shareholders’ equity growth since IPO
The chart below (Exhibit 13) summarises how shareholders’ equity has grown since the IPO in 2011 to a pro forma figure of £226m following the ELG sale and the associated special dividend that is still to be paid. There is an increase of £207m between the starting and pro forma figures and, adding back dividends, this would be £274m, of which 30% came from new equity issuance, 28% from capital generated and 42% from profit on sale of ELG. Dividends paid and to be paid are equivalent to 25% of this figure.
|
Exhibit 13: Shareholders’ equity growth |
|
|
Source: Secure Trust Bank |
Valuation
We start by looking at a comparative table for challenger banks and a selection of specialist lenders. The group is varied, differentiated by size, business mix and strategy. Nevertheless, the group provides some context for assessing the valuation of STB. In terms of historical P/E ratio and its price to NAV, STB is at the upper end of the range, but also has an above-average return on equity and yield.
Exhibit 14: Challenger/specialist lenders comparative table
Price (p) |
Market cap (£m) |
Historic P/E (x) |
Yield (%) |
ROE (%) |
Price/NAV (x) |
|
Secure Trust Bank |
2,808.5 |
510.9 |
17.8 |
2.6 |
21.8 |
3.6 |
Arbuthnot Banking Group |
1,454.0 |
216.5 |
16.8 |
2.0 |
10.7 |
1.8 |
1PM |
69.0 |
36.2 |
18.6 |
0.5 |
10.8 |
1.4 |
Aldermore |
180.1 |
620.9 |
7.9 |
0.0 |
17.2 |
1.2 |
Close Brothers |
1,267.0 |
1,899.4 |
10.1 |
4.2 |
18.2 |
1.8 |
Metrobank |
2,032.0 |
1,631.3 |
0.0 |
-16.4 |
4.0 |
|
OneSavings Bank |
285.8 |
694.7 |
8.4 |
3.0 |
29.1 |
2.2 |
Paragon |
302.4 |
866.7 |
8.5 |
3.6 |
11.2 |
0.9 |
Private and Commercial Finance |
29.5 |
46.9 |
9.8 |
0.0 |
13.4 |
2.1 |
Provident Financial |
2,953.0 |
4,358.9 |
19.5 |
4.1 |
33.0 |
6.1 |
Shawbrook |
270.0 |
676.4 |
11.2 |
0.0 |
20.0 |
1.8 |
S&U |
2,177.5 |
260.0 |
3.7 |
3.5 |
15.2 |
2.0 |
Simple average |
12.0 |
2.0 |
15.5 |
2.4 |
Source: Bloomberg, Edison Investment Research. Note: Prices as at 22 April 2016.
Exhibit 15 gives an indication of whether the price to book premium is justified by comparing STB’s position with the peer group, plotting price to net asset value versus return on equity. This uses historical figures; as noted earlier STB’s ROE is set to fall following the ELG disposal before progressively rising as the resulting capital increase is employed. We have added an arrow to indicate management’s target 20% ROE for Metrobank; this would place the stock broadly in line with the peer group. Although STB’s return on equity will head in the opposite direction this year, it should migrate towards 20% in subsequent years and growth in loan book and earnings are expected to be strong. On this basis, we would argue that its ‘in line’ positioning versus peers is at least supportive with the potential for significant upside depending on its relative prospective growth.
|
Exhibit 15: Challenger banks/specialist lenders P/NAV versus ROE |
|
|
Source: Bloomberg, Edison Investment Research. Note: ALD (Aldermore), ARBB (Arbuthnot Banking Grp), CBG (Close Brothers), MTRO (Metrobank), OPM (1PM), OSB (OneSavings Bank), PAG (Paragon), PFC (Private and Commercial Finance), PFG (Provident Financial), SHAW (Shawbrook), SUS (S&U). |
As a further step, we have refreshed our ROE/COE valuation, basing this on the end 2015 NAV adjusted for the ELG profit and special dividend (1,243p). We add the prospective special dividend back to the resulting value to compare with the current (cum div) share price. Using a 10% cost of equity, nominal growth of 5% together with a return on equity of 19% (similar to our estimate for 2018) the value indicated is c 3,600p, 26% above the current share price. On the same assumptions, the current share price suggests the market is only discounting an ROE of c 16% (below our 2017 estimate of 16.3%) and is not yet ready to acknowledge fully the potential for growth or the returns that may be earned as the current excess capital is utilised through organic or inorganic growth.
Sensitivities
There is a range of macroeconomic, regulatory and internal management factors that have the potential to influence the business and its valuation positively or negatively. We highlight a number of these.
■
Interest rate sensitivity is contained through an asset/liability management policy, with STB indicating that the residual mismatch would result in a pre-tax impact of below £1m when parallel movements of 50bps and 200bps are applied across the maturity bandings of the book.
■
Credit risk appears subdued in a historical context, so a worse than expected macroeconomic scenario could generate negative surprises. A measure of reassurance is provided by the experience of the management team and Secure Trust’s longevity, although the pace of loan book expansion potentially introduces greater uncertainty.
■
Regulation is seen by STB as imposing a disproportionate burden, so any move to ease this, possibly by allowing a more nuanced standardised risk approach, would be a positive development.
■
As with any industry, competitive behaviour could be an important factor for STB. For the moment the scale of the overall market in relation to the challenger banks/specialist credit providers is such that this should not be a major concern. Nevertheless, there is potential for adverse developments in pricing or loan criteria that might have an impact on specific parts of STB’s loan portfolio.
Exhibit 16: Financial summary (£m except where stated)
Year end December |
2014 |
2015 |
2016e |
2017e |
2018e |
Net interest income |
49.2 |
78.9 |
110.9 |
135.5 |
168.8 |
Net commission income |
14.5 |
13.2 |
12.9 |
11.6 |
10.1 |
Total operating income |
63.7 |
92.1 |
123.8 |
147.1 |
178.9 |
Total G&A expenses (exc non-recurring items) below |
(37.5) |
(50.5) |
(64.8) |
(66.9) |
(78.7) |
Operating profit pre impairments & exceptionals |
26.2 |
41.6 |
59.0 |
80.2 |
100.2 |
Impairment charges on loans |
(8.7) |
(16.8) |
(25.1) |
(30.4) |
(36.7) |
Other income |
0.0 |
0.0 |
0.0 |
0.0 |
0.0 |
Operating profit post impairments |
17.5 |
24.8 |
33.9 |
49.8 |
63.5 |
Non-recurring items* |
0.0 |
0.0 |
115.0 |
0.0 |
0.0 |
Pre-tax profit |
17.5 |
24.8 |
148.9 |
49.8 |
63.5 |
Corporation tax |
(3.6) |
(5.5) |
(6.9) |
(9.7) |
(11.2) |
Tax rate |
0.2 |
22.2% |
4.6% |
19.5% |
17.7% |
Bank tax surcharge |
0.0 |
0.0 |
(0.7) |
(2.0) |
(3.1) |
Profit after tax – continuing basis |
13.9 |
19.3 |
141.3 |
38.1 |
49.2 |
Discontinued business |
6.6 |
9.4 |
0.0 |
0.0 |
0.0 |
(Loss)/profit for year |
20.5 |
28.7 |
141.3 |
38.1 |
49.2 |
Minority interests |
0.0 |
0.0 |
0.0 |
0.0 |
0.0 |
Net income attributable to equity shareholders |
20.5 |
28.7 |
141.3 |
38.1 |
49.2 |
Company reported pre-tax earnings adjustments |
7.2 |
2.8 |
(112.4) |
1.8 |
1.6 |
Company reported underlying earnings after tax and minorities |
26.1 |
31.0 |
28.4 |
39.5 |
50.5 |
Average basic number of shares in issue (m) |
16.7 |
18.2 |
18.2 |
18.2 |
18.2 |
Average diluted number of shares in issue (m) |
17.1 |
18.5 |
18.5 |
18.5 |
18.5 |
Reported diluted EPS (p) |
81.5 |
104.1 |
761.7 |
205.2 |
265.1 |
Underlying diluted EPS (p) |
155.8 |
170.4 |
155.9 |
217.2 |
277.6 |
Ordinary DPS (p) |
68.0 |
72.0 |
76.0 |
95.0 |
107.0 |
Special DPS (p) |
0.0 |
165.0 |
0.0 |
0.0 |
0.0 |
Net interest/average loans |
9.71% |
9.97% |
9.26% |
7.88% |
7.37% |
Impairments/average loans |
1.72% |
2.12% |
2.10% |
1.77% |
1.60% |
Cost income ratio |
58.9% |
54.8% |
52.4% |
45.5% |
44.0% |
Net customer loans |
622.5 |
960.6 |
1,436.1 |
2,001.0 |
2,578.0 |
Other assets |
159.8 |
286.8 |
294.1 |
353.1 |
385.2 |
Total assets |
782.3 |
1,247.4 |
1,730.2 |
2,354.2 |
2,963.2 |
Total customer deposits |
608.4 |
1,033.1 |
1,421.9 |
1,961.8 |
2,527.4 |
Other liabilities |
49.0 |
73.1 |
69.1 |
129.3 |
141.1 |
Total liabilities |
657.4 |
1,106.2 |
1,491.0 |
2,091.1 |
2,668.6 |
Net assets |
124.9 |
141.2 |
239.2 |
263.1 |
294.6 |
Minorities |
0.0 |
0.0 |
0.0 |
0.0 |
0.0 |
Shareholders' equity |
124.9 |
141.2 |
239.2 |
263.1 |
294.6 |
Opening shareholders' equity |
61.6 |
124.9 |
141.2 |
239.2 |
263.1 |
Profit in period |
20.5 |
28.7 |
141.3 |
38.1 |
49.2 |
Other comprehensive income |
0.4 |
0.0 |
0.0 |
0.0 |
0.0 |
Ordinary dividends |
(10.2) |
(12.6) |
(13.3) |
(14.2) |
(17.6) |
Special dividend |
0.0 |
0.0 |
(30.0) |
0.0 |
0.0 |
Share-based payments |
0.5 |
0.2 |
0.0 |
0.0 |
0.0 |
Issue of shares |
53.3 |
0.0 |
0.0 |
0.0 |
0.0 |
Share issuance costs |
(1.2) |
0.0 |
0.0 |
0.0 |
0.0 |
Closing shareholders' equity |
124.9 |
141.2 |
239.2 |
263.1 |
294.6 |
Period end shares in issue (m) |
18.2 |
18.2 |
18.2 |
18.2 |
18.2 |
NAV per share (p) |
687 |
776 |
1,315 |
1,446 |
1,620 |
Tangible NAV per share (tNAV) (p) |
641 |
738 |
1,276 |
1,408 |
1,581 |
Return on average tNAV |
29.0% |
25.2% |
14.1% |
16.3% |
18.8% |
Average loans |
477.3 |
821.9 |
1,191.5 |
1,717.5 |
2,289.7 |
Average deposits |
499.7 |
827.9 |
1,206.0 |
1,687.3 |
2,244.8 |
Loans/deposits |
102.3% |
93.0% |
101.0% |
102.0% |
102.0% |
Risk exposure |
649.8 |
998.5 |
1,427.1 |
1,858.9 |
2,291.6 |
Common equity tier 1 ratio |
18.7% |
13.6% |
16.4% |
13.8% |
12.6% |
Source: Company accounts, Edison Investment Research. Note: *£115m in 2015 relates to the disposal of Everyday Loans Group.
|
|||||||||||||||||||||||||||||||||||||||||||||
|