Rolls-Royce Holdings
Written by
Rolls-Royce Holdings |
Restoring power and cash flow growth |
Operational review update |
Aerospace & defence |
11 December 2015 |
Share price performance
Business description
Next event
Analysts
Rolls-Royce Holdings is a research client of Edison Investment Research Limited |
|||||||||||||||||||||||||||||||||||||||||||||||
Management's update on 24 November provided a roadmap to restoring credibility in Rolls-Royce's investment case in the medium term, and as such focused on cash flow growth. This should be driven by the rising installed base of Trent aircraft engines. That element is unaltered no matter which accounting wrapper is applied to returns, and despite the near-term collapse in cash generation arising from weak marine returns, legacy programme reductions and high investment levels.
Year end |
Revenue* (£m) |
PBT** |
EPS** |
DPS |
P/E |
Yield |
12/13 |
14,634 |
1,759 |
65.6 |
22.0 |
8.6 |
3.9 |
12/14 |
13,875 |
1,617 |
65.3 |
23.1 |
8.7 |
4.1 |
12/15e |
13,640 |
1,350 |
56.0 |
15.0 |
10.1 |
2.6 |
12/16e |
13,382 |
738 |
30.8 |
18.5 |
18.4 |
3.3 |
Note: *Underlying revenue; **PBT and EPS are normalised, excluding exceptional items.
Core investment thesis remains
As we stated in our previous note, the long-term nature of the civil engine model is at odds with the short-term, returns-driven appetite of the market. A meaningful investment takes a long time to generate first positive cash flows, and proving a business case can take more than a decade. As such, surrounding the core Civil business with other activities with differing cash dynamics has proven to largely be a positive for Rolls-Royce over the past 10 years. Unfortunately, a severe downturn in Marine cash flows has coincided with a flat period for Civil cash generation. The latter is the result of high ongoing investment in new engine programmes (Trent 1000, Trent XWB and Trent 7000), which should ultimately prove to drive cash growth from 2018 onwards. It coincides with the end of extended lives of high-margin, cash-generative legacy engines as more modern fuel efficient aircraft now enter airline fleets in increasing numbers, often after years of delay.
Adverse cash impacts to reverse from FY17
While the resultant declines in earnings and cash expectations for the next few years has been clearly reflected in the market reaction to the series of profit warnings, in our view the potential recovery from this trough is currently ignored. Launch engine discounts, significant legacy fleet declines, severe offshore Marine market falls and relative investment level peaks should all be behind the company by 2018. As the fastest ever Trent aftermarket growth accelerates due to doubling of deliveries with the associated cash benefits, the current gloom should dissipate.
Valuation: A value play
The market is likely to remain concerned about the potential for additional near-term hiccups, including the threat to income. However, long-term cash expectations indicate significant potential for the shares. Once near-term challenges expire, our heavily risk-adjusted fair value, which remains c £10, should rise sharply. We expect value and GARP investors to increasingly recognise the attractions.
Civil cash curves remain consistent
Very little management presented during the group update should have been a major surprise to the market. The cash curves of engine programmes are in the main well understood and the aggregation of programmes' cash flows down to the micro level of the associated installed bases is broadly unaltered.
Simply put, full development of a new engine programme consumes cash for around five years from the programme launch, and continues to do so at lower levels as positive cash inflows from deliveries and aftermarket revenues begin. In the early delivery phase, cash flow is further adversely affected by the discount given to launch customers, meaning a new programme can consume cash for around eight years. As can be seen in the Trent 700 programme, returns can be impaired by the price incentives offered to customers later in aircraft sales campaigns.
Spiral development of engines for re-engining programmes can be significantly lower, for example the Trent 7000 for the A330neo programme, and potentially any future engine for an A380neo programme should it be launched.
In this respect, we have always regarded engine investments for Rolls-Royce as being the equivalent of acquisitions for the Civil division. Indeed, when the whole new category of high thrust engines came into being in the mid-1990s, we were very sceptical as to whether Rolls would outgun its US peers, GE and Pratt & Whitney (subsidiary of United Technologies). History now suggests that the quality of the resultant Trent family offerings, while not all successful, has been proven. A clear duopoly with GE in widebody aeroengine markets has been established, and the segment represents around half the value of the total future large commercial aircraft propulsion market.
Rolls-Royce is a successful company
In addition, and as indicated by the CEO, the company has been and remains successful. Consider the following:
■
civil aerospace has achieved a 50% share of the widebody market via positions on the A330neo, A350XWB, A380, and B787;
■
orders of more than 1,500 for the Trent-XWB for delivery over the next seven years or so matches the number of Trent 700 engines delivered over its 20-year lifespan to date;
■
extended campaign lives for RB211 engine programmes on the B767 and B747 now ending as newer, fuel-efficient aircraft types are finally delivered to fleets in increasing numbers;
■
survival of the Trent 700 on the A330 as a production engine for far longer than expected, with exclusive investment in the Trent 7000 for the A330neo to extend the cash potential for longer;
■
successful disposal programme of weaker market positions:
•
IAE shareholding sold to P&W – 8% narrowbody share sold for in excess of £3bn;
•
low profitability RTM322 stake sold to Safran for 4x sales; and
•
aero-derived industrial gas turbine business to Siemens in 2014 for £985m – not expected by Siemens to create value until 2020.
■
robust Defence Aerospace position supported by a strong aftermarket contribution;
■
stability in Power Systems despite the challenging global macro;
■
strong naval business and market challenged, yet significant presence in commercial marine markets that should ultimately recover; and
■
a long-term naval nuclear presence for UK submarines, supported by the recently published Strategic Defence and Security Review (SDSR) in the UK, complementing a nascent civil nuclear exposure.
Certainly, risks of further disappointments remain, but given the severity of recent issues we suspect these would prove to have a less marked impact. Self-help programmes remain in place for both Aerospace and Marine and are being further extended by investment in greater efficiencies identified by the operational review.
Surprises on the day
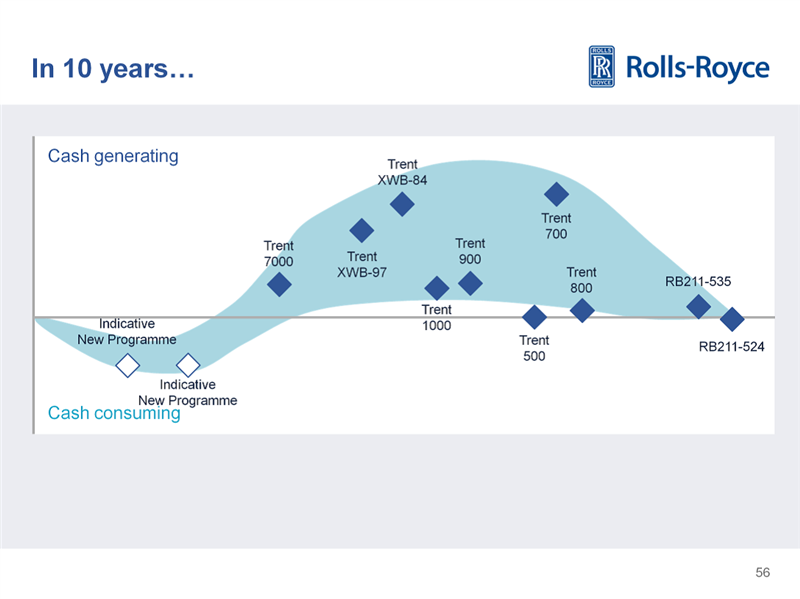
The only major surprise to us on the day was the optically low positions of the Trent 700 and Trent 1000 on the current cash generation curves presented by the CEO (Exhibit 1). As the two current main programmes, this goes some way to explaining in part the group's current cash shortfalls, over and above the clear decline in Marine division cash generation. However, assuming the five- and 10-year forward curves hold some veracity, Civil should become very cash-generative by the end of the decade and continue to grow its cash contribution thereafter.
As a 20-year-old and largely successful programme with a significant and still growing installed base, we might have expected a greater rate of cash generation for the Trent 700. However, when one considers that for several years following the initial launch of the B787 Airbus sought to protect the programme via discounted pricing, which would have incorporated engine manufacturer contributions, the normal curve progression may have been compromised. Certainly, management expect the programme’s relative position on the cash curve to rise rapidly over the next five and 10 years (Exhibits 2 and Exhibit 3, respectively) to almost the upper bounds of expectations as the aftermarket grows to maturity.
It is also unclear whether the 2015 positioning incorporates some of the near-term challenges for the programme, highlighted by the July profit warning (lower spare engine sales, run-off pricing).
It should also be mentioned that optically low does not mean severely challenged. It would appear to be twice as cash-generative as the entire RB211-535 fleet, which we estimate makes positive cash contributions of some £200m.
Conversely, the Trent 1000 engine programme for the Boeing B787, which is now well into its delivery phase, having initially been certified on 7 August 2007, continues to consume significant amounts of cash. The reason for the ongoing outflows appears to be continuing investment to improve performance with the new Trent 1000TEN, and according to RR's website is already 3% more fuel-efficient than the competition, driving increased market share (60% over the past five years). The main current investment item is the spiral development of the Trent 1000TEN (Thrust, Efficiency and New technology) due for certification in 2016, the highest development cost period for any engine normally being the year before type certification of the engine.
Both the TEN and the XWB development programmes provide key technologies for development of the Trent 7000, helping to further limit development cost. This again aligns with Rolls-Royce's development philosophy to invent once and use many times.
Management also indicated that there was no imperative to re-establish a position in the narrowbody engine market now dominated by GE and P&W. This would tend to suggest limited investment in the next 10 years, with the A320neo family, B787MAX and COMAC C919 from China only now moving to entry into service. Clearly, if opportunities arise through new platforms or step-change technologies, RR may investigate them. However, the leading position in the widebody market seems set to reward investors for decades to come.
In turn this leads to our belief that absolute Civil R&D costs are going to plateau, and start to fall as a percentage of Civil sales as the OE ramp increases alongside growth in the more cash-generative aftermarket. Given the limited number of new platform opportunities, we do not expect this to change even if the A380neo is launched with RR engines (again likely to be a lower cost spiral technology injection development), and Boeing launches a replacement for the B757.
|
Exhibit 1: RR engine programme annual cash generation curve – current |
|
|
Source: Rolls-Royce briefing November 2015 |
|
Exhibit 2: RR engine programme annual cash generation curve – in five years |
|
|
Source: Rolls-Royce briefing November 2015 |
|
Exhibit 3: RR engine programme annual cash generation curve – in 10 years |
|
|
Source: Rolls-Royce briefing November 2015 |
Delivered and installed thrust to grow rapidly
Trent engine deliveries
The rapid rise in Trent programme deliveries will be driven by the Trent XWB programmes for the A350 models, although Trent 1000 output will also increase and the Trent 7000 is expected to compensate for the drop-off in Trent 700 deliveries. We currently expect Trent deliveries to plateau at around 660 per year from 2021 – exactly double the 330 Trent deliveries we expect in 2015.
|
Exhibit 4: Trent engine deliveries and forecast |
|
|
Source: Rolls-Royce data, Edison Investment Research estimates |
Modelling the power the engines deliver (thrust) allows us to see the likely impact on aftermarket growth. Thrust can be used as a proxy for aftermarket sales development since the higher the thrust the higher the value of the engine, and thus of the revenues achieved from aftermarket contracts, whether time and materials-based or long-term service agreements such as TotalCare. The issue of linked and unlinked contract clearly has no bearing on delivered thrust or ultimate cash delivery, merely the accounting and timing of payments on the contracts.
Effectively, this is a volume measure for market expansion. With inflationary elements built into aftermarket contracts, sales growth is actually expected to normally exceed thrust.
The increased rate of delivery over the next five years sees total Trent installed thrust rise at double-digit rates over the remainder of the decade, as can be seen in our thrust forecast charted below. We have been more severe on the long-term retirement profile of RB211 regional and corporate jet engines than charts provided by RR imply. However, given current utilisation and retirement trends, largely arising from both regional and widebody legacy aircraft being side-lined as new aircraft enter service, we believe such treatment is prudent.
|
Exhibit 5: RR annual thrust deliveries (lbs m) |
Exhibit 6: RR installed thrust (lbs m) |
|
|
|
Source: Rolls-Royce data, Edison estimates |
|
Exhibit 5: RR annual thrust deliveries (lbs m) |
|
|
Source: Rolls-Royce data, Edison estimates |
|
Exhibit 6: RR installed thrust (lbs m) |
|
|
Source: Rolls-Royce data, Edison estimates |
This acts as a drag on overall installed thrust growth, but we still expect overall installed thrust for the RR engine fleet to rise by 4-6% per year through 2020 and beyond. However, it should be remembered that these smaller engines tend to realise higher margins and stronger cash conversion than the less mature engine fleets.
However, the relative size of both the RB211 fleet and the corporate and regional installed thrust continues to diminish as Trent deliveries gather pace. The Trent fleet accounted for 51% of the installed thrust base at the end of 2014, with the RB211 fleet accounting for just 21% with the balance of 28% attributable to the lower thrust, corporate and regional engines. By 2020 these proportions will be 71%, 8% and 21% in our model. The fact that Rolls-Royce expects the non-Trent fleet installed thrust to be maintained for longer has a positive ramification for cash flow compared to our model.
In our view, the development of the installed thrust base combined with the cash curves presented in the recent briefing, remain the primary explanation of management’s confidence in future cash conversion and absolute profitability and generation metrics.
Marine should recover…eventually
While management is clearly pointing to a more depressed market for offshore marine for longer than originally envisaged, actions being undertaken should allow profitability to improve rapidly once conditions have stabilised. Further operational leverage will be achieved as markets recover, which we expect to begin by 2018, more than eliminating the losses expected in FY16. The improvement should allow divisional margins to recover towards historic double-digit levels, with naval activity remaining profitable and even commercial marine less encumbered by the slowdown.
We continue to expect relative stability in Defence Aerospace, Nuclear and Power Systems.
Shareholder payments
The board will not have decided on the shareholder payment and future policy until the usual consideration at the preliminary results in February. Unfortunately, the market has pre-empted any judgement by interpreting the November comments of a review as tantamount to a cut. We have now adjusted our expectation to reflect the reduced expectation, lowering our dividend forecast for the current year to 15.0p and to 18.5p for FY16e.
The financial impact of this in FY16 is limited to a modest positive impact on net interest receivable as gross cash balances are reduced by £215m less than in our previous forecast, although generating only a modest positive interest rate.
Our PTP increases by £1.2m to £738m and our EPS figure increases 0.2% to 30.8p.
Exhibit 7: Financial summary
£m |
2013 |
2014 |
2015e |
2016e |
|
Year end 31 December |
IFRS |
IFRS |
IFRS |
IFRS |
|
PROFIT & LOSS |
|||||
Revenue |
|
14,634.0 |
13,875.0 |
13,639.7 |
13,382.3 |
Cost of Sales |
(11,482.0) |
(10,533.0) |
(10,354.4) |
(10,159.0) |
|
Gross Profit |
3,152.0 |
3,342.0 |
3,285.3 |
3,223.3 |
|
EBITDA |
|
2,607.0 |
2,418.0 |
2,183.5 |
1,604.7 |
Operating Profit (before amort. and except.) |
|
2,235.0 |
2,044.0 |
1,819.5 |
1,254.7 |
Intangible Amortisation |
(404.0) |
(366.0) |
(404.5) |
(443.1) |
|
Exceptionals |
(59.0) |
(1,550.0) |
(20.0) |
0.0 |
|
Other |
0.0 |
0.0 |
0.0 |
0.0 |
|
Operating Profit |
1,772.0 |
128.0 |
1,395.1 |
811.6 |
|
Net Interest |
(72.0) |
(61.0) |
(65.6) |
(73.6) |
|
Profit Before Tax (norm) |
|
1,759.0 |
1,617.0 |
1,349.5 |
738.0 |
Profit Before Tax (FRS 3) |
|
1,700.0 |
67.0 |
1,329.5 |
738.0 |
Tax |
(377.0) |
(151.0) |
(305.8) |
(169.7) |
|
Profit After Tax (norm) |
1,236.0 |
1,213.0 |
1,039.7 |
568.2 |
|
Profit After Tax (FRS 3) |
1,323.0 |
(84.0) |
1,023.7 |
568.2 |
|
Average Number of Shares Outstanding (m) |
1,866.0 |
1,874.0 |
1,838.8 |
1,828.0 |
|
EPS - normalised (p) |
|
65.6 |
65.3 |
56.0 |
30.8 |
EPS - normalised and fully diluted (p) |
|
65.6 |
65.3 |
56.0 |
30.8 |
EPS - (IFRS) (p) |
|
70.3 |
(3.9) |
55.2 |
30.8 |
Dividend per share (p) |
22.0 |
23.1 |
15.0 |
18.5 |
|
Gross Margin (%) |
21.5 |
24.1 |
24.1 |
24.1 |
|
EBITDA Margin (%) |
17.8 |
17.4 |
16.0 |
12.0 |
|
Operating Margin (before GW and except.) (%) |
15.3 |
14.7 |
13.3 |
9.4 |
|
BALANCE SHEET |
|||||
Fixed Assets |
|
9,997.0 |
9,296.0 |
9,647.6 |
10,067.0 |
Intangible Assets |
4,987.0 |
4,804.0 |
4,883.5 |
5,019.4 |
|
Tangible Assets |
3,392.0 |
3,446.0 |
3,692.6 |
3,949.0 |
|
Investments |
1,618.0 |
1,046.0 |
1,071.5 |
1,098.6 |
|
Current Assets |
|
11,224.0 |
9,897.0 |
9,579.1 |
9,689.4 |
Stocks |
1,725.0 |
1,477.0 |
1,656.0 |
1,644.9 |
|
Debtors |
3,840.0 |
4,215.0 |
4,228.3 |
4,148.5 |
|
Cash |
4,311.0 |
2,869.0 |
2,439.0 |
2,664.0 |
|
Other |
1,348.0 |
1,336.0 |
1,255.7 |
1,232.0 |
|
Current Liabilities |
|
(7,838.0) |
(5,961.0) |
(5,918.7) |
(5,780.3) |
Creditors |
(7,630.0) |
(5,951.0) |
(5,918.7) |
(5,780.3) |
|
Short term borrowings |
(208.0) |
(10.0) |
0.0 |
0.0 |
|
Long Term Liabilities |
|
(7,080.0) |
(6,845.0) |
(6,729.0) |
(7,042.8) |
Long term borrowings |
(2,164.0) |
(2,193.0) |
(2,519.5) |
(2,883.8) |
|
Other long term liabilities |
(4,916.0) |
(4,652.0) |
(4,209.5) |
(4,159.0) |
|
Net Assets |
|
6,303.0 |
6,387.0 |
6,579.0 |
6,933.3 |
CASH FLOW |
|||||
Operating Cash Flow |
|
2,278.0 |
1,577.0 |
1,555.5 |
1,483.6 |
Net Interest |
(43.0) |
(45.0) |
(50.6) |
(58.6) |
|
Tax |
(238.0) |
(276.0) |
(305.8) |
(169.7) |
|
Capex |
(1,172.0) |
(1,125.0) |
(1,114.6) |
(1,185.3) |
|
Acquisitions/disposals |
404.0 |
(906.0) |
0.0 |
0.0 |
|
Financing |
(190.0) |
(16.0) |
(402.0) |
0.0 |
|
Dividends |
(417.0) |
(482.0) |
(429.0) |
(209.2) |
|
Net Cash Flow |
622.0 |
(1,273.0) |
(746.5) |
(139.3) |
|
Opening net debt/(cash) |
|
(1,317.0) |
(1,939.0) |
(666.0) |
80.5 |
HP finance leases initiated |
0.0 |
0.0 |
0.0 |
0.0 |
|
Other |
0.0 |
0.0 |
0.0 |
0.0 |
|
Closing net debt/(cash) |
|
(1,939.0) |
(666.0) |
80.5 |
219.8 |
Source: Company accounts, Edison Investment Research
|
