Last close As at 05/08/2026
—
— 0.00 (0.00%)
Market capitalisation
—
Research: Investment Companies
Princess Private Equity Holding (PEY) recorded a solid 10.0% NAV total return over the 12-month period ending on 30 October 2020, despite a 14.1% decline in March reflecting the initial impact of COVID-19. Its well-diversified portfolio, focused on relatively resilient sectors, required minor additional financing to mitigate liquidity risks. The rate of new investment picked up in Q320 and reached €63.5m ytd, close to the FY19 total of €69.3m. As there is currently no material portfolio funding requirement according to the investment manager, PEY reinstated its dividend policy and decided to pay a second interim dividend on par with the H219 distribution.
Princess Private Equity Holding |
Resilient portfolio continues to expand |
Investment trusts |
10 December 2020 |
Share price/discount performance
Three-year performance vs index
Gearing
Analyst
|
||||||||||||||||||||||||||||||||||||||||||||||||||||||||||||||||||||||||||||||||
Princess Private Equity Holding (PEY) recorded a solid 10.0% NAV total return over the 12-month period ending on 30 October 2020, despite a 14.1% decline in March reflecting the initial impact of COVID-19. Its well-diversified portfolio, focused on relatively resilient sectors, required minor additional financing to mitigate liquidity risks. The rate of new investment picked up in Q320 and reached €63.5m ytd, close to the FY19 total of €69.3m. As there is currently no material portfolio funding requirement according to the investment manager, PEY reinstated its dividend policy and decided to pay a second interim dividend on par with the H219 distribution.
|
Revaluations of the top 10 portfolio companies in Q320 |
|
|
Source: Company data |
The market opportunity
PEY focuses on value creation in companies where revenue is less dependent on the macro environment due to exposure to transformative trends. This is executed by its global investment team and an in-house industry value creation (IVC) team. Its close co-operation with the management of portfolio companies helped weather the impact of the short-term, pandemic-driven slowdown and benefit from the subsequent broad market rebound. Global PE transaction volumes picked up in Q320, with the valuations of resilient sectors rebounding to pre-COVID levels.
Why consider investing in Princess Private Equity?
■
Strong emphasis on portfolio defensiveness and resilience of cash flows.
■
Investment manager’s extensive experience (more than 20 years).
■
Well-resourced team and global platform.
■
Portfolio diversified across industries and vintages.
■
Attractive dividend policy with targeted payout of 5% of opening NAV.
Valuation: Trading at a single-digit discount to NAV
As PEY’s share price increased by c 20% from €9.86 at end-October 2020 to €10.98 at close on 9 December, the discount to NAV narrowed to 14.6% compared to the one-year average of 18.9%. We note that over the last 12 months, the discount ranged from 2.7% to 45.0%, which we attribute to strong pre-pandemic performance and significant market uncertainty following COVID-19 outbreak.
Exhibit 1: Company at a glance
Investment objective and fund background |
Recent developments |
||||||||||||||||||||||||||||||||||||||||||||||||||||||||||||||||||||||
Princess Private Equity Holding is an investment holding company domiciled in Guernsey that invests in private equity and also has a minor private debt position. Its portfolio consists mostly of direct investments but may also include primary and secondary fund investments. Princess aims to provide shareholders with long-term capital growth as well as an attractive dividend yield. |
■ 26 November 2020: October monthly report. NAV TR -0.8%. ■ 19 November 2020: Declaration of second interim dividend amounting to €0.29 per share, and future dividend guidance. ■ 16 November 2020: Q320 quarterly results presentation. ■ 27 October 2020: September monthly report. NAV TR 3.8%. |
||||||||||||||||||||||||||||||||||||||||||||||||||||||||||||||||||||||
Forthcoming |
Capital structure |
Fund details |
|||||||||||||||||||||||||||||||||||||||||||||||||||||||||||||||||||||
AGM |
May/June 2021 |
Ongoing charges |
1.87%* |
Group |
Partners Group |
||||||||||||||||||||||||||||||||||||||||||||||||||||||||||||||||||
Full year results |
May/June 2021 |
Net gearing |
0.0% |
Manager |
Team-managed |
||||||||||||||||||||||||||||||||||||||||||||||||||||||||||||||||||
Year end |
31 December |
Annual mgmt fee |
1.5% |
Address |
Tudor House, PO Box 477, |
||||||||||||||||||||||||||||||||||||||||||||||||||||||||||||||||||
Dividend paid |
June, December |
Performance fee |
See previous note (page 14) |
||||||||||||||||||||||||||||||||||||||||||||||||||||||||||||||||||||
Launch date |
1999 (listed since 2006) |
Company life |
Indefinite |
Phone |
+44 (0) 1481 730 946 |
||||||||||||||||||||||||||||||||||||||||||||||||||||||||||||||||||
Continuation vote |
None |
Loan facilities |
€80m |
Website |
|||||||||||||||||||||||||||||||||||||||||||||||||||||||||||||||||||
Dividend policy and history (financial years) |
Share buyback policy and history (financial years) |
||||||||||||||||||||||||||||||||||||||||||||||||||||||||||||||||||||||
PEY intends to pay a total annual dividend equivalent to c 5% of opening NAV per share, in two instalments. The policy was reinstated in November 2020 following the pandemic-driven revision earlier this year. |
Under an authority granted in 2010, PEY’s directors may buy back up to 14.99% of shares or allot shares up to c 10% of the share capital, each year. However, no shares have been issued or repurchased since FY14. |
||||||||||||||||||||||||||||||||||||||||||||||||||||||||||||||||||||||
|
|
||||||||||||||||||||||||||||||||||||||||||||||||||||||||||||||||||||||
Shareholder base (as at 9 December 2020) |
Portfolio exposure by asset type (as at 31 October 2020) |
||||||||||||||||||||||||||||||||||||||||||||||||||||||||||||||||||||||
|
|
||||||||||||||||||||||||||||||||||||||||||||||||||||||||||||||||||||||
Top 10 holdings (as at 31 October 2020) |
|||||||||||||||||||||||||||||||||||||||||||||||||||||||||||||||||||||||
|
|||||||||||||||||||||||||||||||||||||||||||||||||||||||||||||||||||||||
Source: Princess Private Equity Holding, Edison Investment Research, Refinitiv. Note: *Including management fee and excluding incentive fee. **N/A where not in end-October 2019 top 10.
Fund profile: Direct private equity investor
Princess Private Equity Holding (PEY) is an investment company registered in Guernsey, with an objective of providing both long-term capital appreciation and income, as it targets a recurring dividend yield of 5% of NAV based on semi-annual payments. PEY changed its focus from third-party funds in 2011 and now invests primarily via its investment manager’s (Partners Group) direct private equity investment programmes (funds). It also makes co-investments with other managers and has some exposure to private debt investments to support efficient balance sheet management.
Legacy third-party funds (5% of PEY’s portfolio at end-October 2020) along with investments in relatively liquid senior loans (as a higher-yielding alternative to money market instruments, 2% of portfolio) serve as liquidity management. The company currently has an undrawn borrowing facility of €80m used to provide flexibility in the timing of investments. Unlike many of its peers, PEY tends not to follow an overcommitment strategy. The portfolio is effectively fully invested with an investment level of c 99% as at end-September 2020.
The fund manager: Partners Group
Princess Private Equity is managed by Partners Group, a global private markets specialist with more than US$96bn in assets under management at end-September 2020. The investment manager has over 1,500 employees across 20 offices, with more than 650 private markets professionals. Its PE leadership team consists of 20 professionals with average experience of more than 20 years (including more than 10 years at Partners Group).
The manager’s view: Opportunities rather than threats
Due to COVID-19 and the resulting significant widening bid/ask spreads in the market, the PE transaction volume declined globally in Q220. However, the investment manager expects the valuations of companies with resilient cash flow to remain largely unchanged and these companies should lead the market in terms of deal activity in the next few quarters. These include for instance the software segment, with 2020 ytd EV/EBITDA deal multiples ranging from 20x to 22x, healthcare (15–20x) and education (15–20x). It is worth noting that these three sectors have the largest share in PEY’s portfolio at c 53% of NAV.
As the pandemic divided markets into clear winners and losers, recovery will be uneven, with those focused on long-term, sustainable and transformative trends outperforming the others. With elevated public market volatility, the environment for PE investments improved further, but monetising it requires the relevant knowledge. PEY continues to focus on value creation in companies with sustainable growth potential. It creates resilience and stability through value-add and platform building strategies, while assessing downside risks through asset testing scenarios. Its healthy investment pipeline allows careful and selective deployment in the current environment, as well as the acceleration of bolt-on acquisitions, which would enable the investment manager to further expand value for shareholders.
Market outlook: PE markets picking up after Q220
Activity in the global private equity market has rebounded from the temporary slowdown in Q220 triggered by COVID-19, when most PE players were focused on an in-depth analysis of the potential impact on their investment portfolios (including the preparation of stress testing scenarios), as well as supporting portfolio companies operationally and financially (providing additional liquidity if required). The buyout market started to recover around late-July/early August, with the Q320 global investment volume at US$96bn (up from US$60bn in Q220 and slightly behind last year’s US$99bn), according to Preqin data.
The swift rebound in public markets assisted PE transaction multiples and, after the first nine months of 2020, the average European buyout EV/EBITDA multiple stood at 12.5x (up from 11.0x in 2019), with the average US multiple at 11.0x (vs 11.5x in 2019), according to S&P data. Having said that, we understand that the change in valuations and the pick-up in deal volumes have not been consistent across different industries, with the sectors more resilient to the pandemic (eg healthcare or tech), especially companies with a strong and recurring cash flow profile, experiencing greater investor interest and higher valuations, while companies in the sectors more affected by COVID-19, especially those with structural issues, have been subject to downward revaluations. There has been some evidence that public market multiples for some of the less resilient sectors (eg some industrials) could be difficult to achieve in a buyout deal.
While the effects of the second COVID-19 wave and associated lockdown phase has already started to materialise, we believe PE transaction volumes may not be subject to a similar decline to the one in Q220. This is because private equity companies completed portfolio stress testing and an analysis of their liquidity requirements earlier this year, and with the experience gathered during the first wave they may be more willing to pursue new investments, as well as offensive add-on acquisitions to existing portfolio holdings. Nevertheless, we acknowledge that transaction activity may still be below that in Q320 (when many deals postponed due to the first COVID wave were finalised).
|
Exhibit 2: Global private equity buyout investments |
|
|
Source: Preqin Quarterly Update: Private Equity & Venture Capital, Q320 |
Asset allocation
Investment strategy and process
PEY focuses on direct private equity transactions, both through Partners Group’s flagship limited partnership funds and as a co-investor alongside other Partners Group-managed funds or other private equity managers. It invests mainly in mid-cap buyouts with an enterprise value of c €500m to €2bn targeting a relatively diversified portfolio of c 50–80 holdings. While this sits well below the number of holdings common for a private equity fund of funds (which is normally exposed to hundreds of underlying companies), it is enough to reduce cash flow volatility (which might occur with a more concentrated strategy), which is particularly important given PEY’s aim of sustaining a regular high dividend payout.
Partners Group is a relative value investor that seeks to make direct investments in highly cash-generative companies that offer meaningful top-line growth potential and fit into one or more of the following categories:
■
Well-managed platform companies that can be expanded via bolt-on acquisitions.
■
Category winners with a strong competitive position in a growing market segment.
■
Cash-generative and defensive leaders in sectors with high barriers to entry.
An essential part of the Partners Group private equity investment approach is its industry value creation team (see November 2019 review for details), which it uses to help drive through initiatives to enable companies to strengthen their financial and competitive positions and achieve their full potential. Additionally, the investment manager closely monitors investee companies through its board representation, quarterly performance assessments, active engagement with stakeholders and the progress of value-creation initiatives.
Partners Group has a highly selective approach to investments, with less than 1% of around 1,000 potential deals screened on a high-level basis each year making it into the group’s portfolios. After looking at industry developments, market attractiveness, headline company financials, return potential, exit scenarios and how Partners Group could add value to the business, c 10–20% of screened entities proceed to initial due diligence, which assesses a range of quantitative and qualitative factors. The most promising ideas are moved to advanced due diligence stage, including in-depth financial modelling, scrutiny of legal terms and an assessment of environmental, social and governance (ESG) factors, which results in a detailed investment thesis (including an operational assessment by the IVC team) and a 100-day plan for execution of the deal and implementation of value creation initiatives. The final step of the process is a positive or negative investment recommendation. New private equity positions typically represent 0.5–3.0% of NAV (ideally around 2.0%), but this is dependent on the size of the investee company and PEY’s liquidity position. The standard holding period is three to five years, with exits executed through trade sales, IPO or sale to another private equity buyer.
The company makes commitments to Partners Group’s flagship direct private equity funds, although it may take several years to draw the commitments made at launch to make new investments. Therefore, to smooth the pace of investment and avoid cash drag (which may occur when cash is returned to the portfolio but is not drawn down by the direct funds), PEY may also conduct direct co-investments with other managers, which also brings additional diversification.
PEY also holds private debt investments (albeit making up a small part of PEY’s portfolio), overseen by Partners Group, which serve two purposes: uninvested cash may be used to purchase first-lien senior loans, which are relatively liquid but offer higher returns than other near-cash investments, while second-lien or mezzanine investments are longer term and may be used to gain exposure to favoured private companies that are not (yet) seeking additional equity financing.
Investments and realisations
Over the first three quarters of 2020, PEY completed five new investments with a total volume of almost €50m which, together with add-on investments, brings its total activity to end-September to €55.4m. Below we present a summary of PEY’s key investments in the first nine months of 2020 (9M20).
Exhibit 3: PEY’s investments in 2020 ytd
Investment date |
Amount |
Investment type |
Company |
Description |
January 2020 |
€11.2m |
New |
eResearch Technology |
Provider of integrated online software application services for pharmaceutical, biotechnology and medical device industries |
January 2020 |
€9.9m |
New |
Allied Universal |
US-based provider of facility and security services |
January 2020 |
€6.8m |
New |
Ammega |
Global leader in mission-critical belting solutions |
February 2020 |
€13.8m |
New |
EyeCare Partners |
Leading vertically integrated medical vision services provider in the US |
May 2020 |
€2.5m |
Top-up |
Fermaca |
Leading operator of gas infrastructure in Mexico |
June 2020 |
€2.9m |
Top-up |
KinderCare Education |
Provider of early childhood education in the US |
August 2020 |
€0.5m |
Add-on |
SPi Global |
Business process outsourcing services company |
September 2020 |
€4.5m |
New |
Rovensa |
Speciality crop nutrition, protection and biocontrol products provider |
Source: Company data
It is worth noting that a significant part of the aforementioned business was completed in Q120 (€41.9m). Due to pandemic-driven market stagnation, PEY’s Q220 investment activity was limited to providing additional liquidity to support companies during government-imposed lockdowns. In May, PEY topped up its investment in the leading operator of gas infrastructure in Mexico, Fermaca, with €2.5m, which was used to repay a bridge loan obtained in Q419. Moreover, in June, PEY provided additional capital of €2.9m to KinderCare Education, to assist the already implemented cost and liquidity management measures and cover the financing requirement for the remainder of 2020. The underlying company suffered from the closure of the majority of its 1,500 centres across the US, and withdrawals by stay-at-home parents from the ones that stayed open. The long-term business outlook remains positive, as c 1,400 centres had already reopened by end-June 2020. However, the impact of the second wave of the pandemic remains uncertain.
Improving market conditions in Q320 enabled further portfolio expansion, with another €0.5m provided to SPi Global, which operates in the business process outsourcing services sector. SPi acquired a majority stake in a business-to-business e-learning solutions provider, LearningMate. Furthermore, in September, PEY completed its €4.5m investment in speciality crop nutrition, protection and biocontrol products provider Rovensa, which demonstrated strong resilience during the pandemic, as food production continued almost uninterrupted. Partners Group will now assist Rovensa in developing its biological solutions portfolio as well as a variety of strategic initiatives, from sales efficiency to product improvement. Finally, PEY announced an investment in Telepass, an Italian group providing an integrated system in the field of urban and extra-urban mobility, enabling simplified payment of motorway tolls, and for car park facilities and access to city centre areas. The transaction is expected to close in Q121.
In October 2020, PEY made a new €50m commitment to Partners Group Direct Equity 2019, with an already funded initial capital call of €8.1m. The programme provides additional exposure to its seed portfolio of five companies: Blue River PetCare, Confluent Health, EyeCare Partners, Rovensa and Schleich, which supplements PEY’s existing exposure to these entities through earlier co-investments made alongside the programme. This brings the total investment volume over the first 10 months of 2020 to €63.5m, nearing the FY19 total of €69.3m.
|
Exhibit 4: 2020 ytd Investments and realisations |
|
|
Source: PEY, Edison Investment Research. Note: Excludes €90m from the Action exit agreed in November 2019 and completed in June 2020. |
Over the first 10 months of 2020, PEY received a healthy €150.5m from portfolio realisations, with the majority attributable to the dividend payment (€7.8m) and subsequent full exit (€90.0m) from Action, signed in November 2019 and completed in June 2020. The investment generated a return of more than 35x invested capital for PEY and enabled full repayment of its revolving credit facility. By the end of Q320, the company also sold its remaining shares in Ceridian HCM (listed on NYSE since April 2018), realising €3.8m over H120 and a further €1.9m in September, which brought the investment multiple for the initial payment of €4.5m made in 2007 to 3.7x. Also in September, PEY received a €6.5m dividend from GlobalLogic, a global provider of software product engineering services which, according to the investment manager, remains conservatively capitalised with sufficient cash to support the company’s M&A programme. The remaining €40.5m income is largely attributable to the mature legacy fund portfolio and other direct investments. The company has also already signed a partial realisation of investment in PCI Pharma Services, expected to close in Q420, bringing proceeds of c €25m, which represents a multiple on capital invested of over 4x.
Current portfolio positioning
PEY holds a well-diversified portfolio, mostly focused on sectors relatively resilient to COVID-19. The latter is illustrated by the fact that according to PEY, the majority of portfolio holdings outperformed post-COVID-19 revenue and earnings targets and were trading at pre-COVID levels at end-September 2020. PEY’s portfolio companies also benefit from transformative trends (such as the expansion of remote learning and process digitalisation). Although the initial hit of the coronavirus resulted in a €26.8m net negative revaluation of portfolio holdings (primarily due to the decline in public market multiples) over H120, NAV at end-October reached €888.9m vs €868.7m at the beginning of the year, on the back of improving multiples.
PEY’s largest sector exposures include healthcare and education (18% of NAV each), followed by IT (17%), consumer discretionary (10%) and financials (10%). On the other hand, the more cyclical industries, such as energy and materials, constitute c 4% of the company’s NAV each. It is also worth noting that due to its global relative value investment approach, PEY’s portfolio is well spread geographically, with c 50% in Europe, 36% in North America and the remaining 14% spread across other regions.
|
Exhibit 5: Investments by industries |
Exhibit 6: Investments by region |
|
|
|
Source: Princess Private Equity Holding, last available data as at 30 September 2020 |
Source: Princess Private Equity Holding, last available data as at 31 October 2020 |
|
Exhibit 5: Investments by industries |
|
|
Source: Princess Private Equity Holding, last available data as at 30 September 2020 |
|
Exhibit 6: Investments by region |
|
|
Source: Princess Private Equity Holding, last available data as at 31 October 2020 |
The top 10 holdings as at end-September 2020 constituted c 50.1% of overall NAV (vs 53.3% at end- 2019) following the full exit from Action, PEY’s second-largest holding at year-end (11.1% NAV) and strong upward revaluation of the remaining largest investments. We note that PEY’s top10 holdings accounted for 99% of the upward revaluation in Q320 of €67.4m.
Favourable public market developments have fuelled an improvement across PEY’s valuation metrics, with the overall EV/EBITDA multiple for PEY’s portfolio reaching 15.4x at 30 September 2020 vs 14.0x at the start of the year. The same figure calculated for the top 10 investments is only 17.0x compared to 15.1x at end-December 2019. We note the slight decline in the pace of revenue and EBITDA growth, which amounted to 7.1% and 10.3% respectively for the 12-month period ended 30 September 2020, vs 9.6% and 12.4% in FY19. It is, however, mainly attributable to the H120 decline, with a subsequent rebound in Q320.
Exhibit 7: PEY’s Portfolio valuation and performance metrics
End-September 2020 |
End-June 2020 |
End-December 2019 |
End-September 2019 |
|
Valuation metrics |
||||
EV/EBITDA |
15.4x |
14.1x |
14.0x |
14.2x |
Net debt/EBITDA |
5.3x |
5.1x |
5.1x |
5.1x |
Weighted average leverage |
37.7% |
41.5% |
38.6% |
38.3% |
Weighted average EV |
€2.7bn |
€2.7bn |
€2.5bn |
€3.1bn |
Performance metrics (12m) |
||||
Weighted average revenue growth |
7.1% |
4.8% |
9.6% |
11.7% |
Weighted average EBITDA growth |
10.3% |
9.0% |
12.4% |
14.1% |
Source: Princess Private Equity Holding
Financial resources and commitments
As at end-September 2020, PEY held unfunded commitments amounting to €68.1m and equalling c 13.1% of NAV. However, this includes €24.3m committed to third-party funds and €21.5m to Partners Group direct programmes, which have already completed their investment period, and therefore only €22.3m is considered by the company as commitments likely to be drawn. With a new €50m commitment to Partners Group Direct Equity 2019 in October, which has already been partially funded, total commitments at the end of the month reached €109.1m. As an €80m revolving credit facility remains fully undrawn (following repayment with proceeds from the Action exit) and PEY held net current assets amounting to €5.8m at end-October 2020, its coverage ratio sits at a comfortable 78.6%. The remaining commitments to the 2019 programme are expected to be called over the next three to four years.
|
Exhibit 8: Investments by origination date |
Exhibit 9: Unfunded commitments by vintage |
|
|
|
Source: Princess Private Equity Holding, last available data as at 30 September 2020 |
|
Exhibit 8: Investments by origination date |
|
|
Source: Princess Private Equity Holding, last available data as at 30 September 2020 |
|
Exhibit 9: Unfunded commitments by vintage |
|
|
Source: Princess Private Equity Holding, last available data as at 30 September 2020 |
Performance: Positive ytd NAV total return of 3.5%
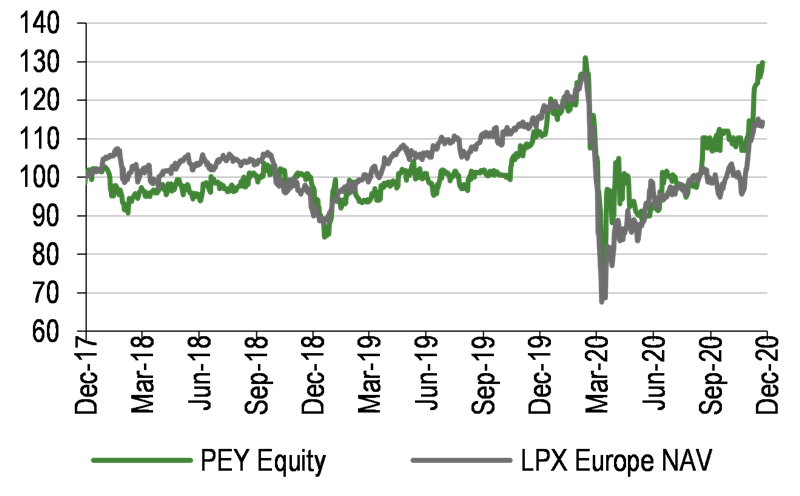
Following a strong performance in FY19 when PEY delivered a 21.1% NAV total return, it looked to carry forward the strong momentum. However, in March 2020, PEY reported the initial impact of the pandemic outbreak, posting a 14.1% NAV write-down, mainly due to movement in the valuation multiples of comparable companies used to value its holdings. Having said that, we note that NAV performance has subsequently picked up, bringing the ytd NAV TR to end-October 2020 to 3.5% (after accounting for the interim dividend of €0.145 per share paid in August). Meanwhile, the broad PE market illustrated by the LPX Europe NAV Index posted a 9.3% loss ytd, while the MSCI World Index posted a 4.6% negative return.
|
Exhibit 10: Price, NAV and index total return performance, three-year rebased |
Exhibit 11: Price, NAV and index total return performance (%) |
|
|
|
Source: Refinitiv, Edison Investment Research |
Source: Refinitiv, Edison Investment Research. Note: Three-, five- and 10-year performance figures annualised. |
|
Exhibit 10: Price, NAV and index total return performance, three-year rebased |
|
|
Source: Refinitiv, Edison Investment Research |
|
Exhibit 11: Price, NAV and index total return performance (%) |
|
|
Source: Refinitiv, Edison Investment Research. Note: Three-, five- and 10-year performance figures annualised. |
The largest contributions to NAV growth in Q320 in euro terms were recorded by Foncia, a financial services company offering residential management and real estate solutions (€14.9m), and GlobalLogic, a global provider of outsourced product engineering and software development services (€10.9m, see exhibit on the front page).
PEY’s NAV TR in Q320 reached a robust 9.4%, assisted by a positive 11.5% effect from portfolio valuations on the back of both the rebound in the broad equity markets (as portfolio valuations are mostly based on market multiples) and positive EBITDA development. We note, that in Q320 PEY’s NAV outperformed both listed equity (LPX Europe, MSCI World) and private equity (LPX Europe NAV) indices. Extending the analysed period to one year ended 31 October 2020, in which PEY posted 10.0% NAV TR, reveals strong outperformance against the LPX Europe, which has not yet fully rebounded from the market collapse in March 2020. The same applies over a three- and five-year time horizon.
Exhibit 12: PEY's relative performance to broad market indices (geometric calculation)
|
One month |
Three months |
Six months |
One year |
Three years |
Five years |
Price relative to LPX Europe |
(1.6) |
13.2 |
0.8 |
16.5 |
17.7 |
42.3 |
NAV relative to LPX Europe |
1.4 |
6.1 |
8.1 |
24.4 |
40.9 |
49.5 |
Price relative to LPX Europe NAV |
(4.8) |
12.3 |
10.2 |
4.8 |
(10.3) |
24.4 |
NAV relative to LPX Europe NAV |
(1.8) |
5.3 |
17.5 |
12.8 |
12.9 |
31.5 |
Price relative to MSCI World |
(1.4) |
11.6 |
1.6 |
1.5 |
(9.5) |
22.0 |
NAV relative to MSCI World |
1.5 |
4.6 |
8.9 |
9.4 |
13.6 |
29.2 |
Source: Refinitiv, Edison Investment Research, Data as at 31 October 2020
Discount
After a strong performance since mid-November, PEY’s shares currently trade at c 14.6% discount to NAV, which is narrower than its 10-year average of 18.9%. This year the discount moved within a wide range of just 2.7% in mid-February to c 45% in March, a record-high (previously 27.6% in mid-2016, following the UK’s vote to leave the EU).
|
Exhibit 13: Share price discount to NAV over one year (%) |
|
|
Source: Refinitiv, Edison Investment Research |
Capital structure and fees
PEY capital consists of one-class of 69.2m ordinary shares listed on the Main Market of the London Stock Exchange. The board has the authority (renewed annually) to repurchase up to 14.99% of shares or allot shares up to the equivalent of 10% of issued share capital, in order to manage a discount or a premium. However, no shares have been issued or repurchased since 2014.
The company pays a quarterly management fee to Partners Group at 1.5% of NAV pa or the value of PEY’s assets less any temporary investments plus unfunded commitments (whichever is higher). There is also an incentive (performance) fee paid to the investment manager at 15% of realised profits in the case of direct investments and 10% for secondary investments (subject to a hurdle rate/preferred return of 8.0% pa and a catch-up clause). PEY’s ongoing charges ratio (excluding the incentive fee) over the last 12 months (ended June 2020) amounts to 1.87% versus 1.68% in the previous year. Including incentive fees brings LTM ongoing charges total to €29.7m, translating into 3.58% of NAV at 30 June 2020 vs 3.08% (€24.8m) for the 12-month period ending 30 June 2019. However, we note that the increase is largely attributable to significant incentive fee payments in H219, amounting to c €12.5m according to our calculations, reflecting positive performance of the portfolio during this period. In H120, the performance fee reached only €1.7m, against €6.9m paid over first six months of 2019.
PEY has an €80m senior revolving multi-currency credit facility arranged by Lloyds Bank (undrawn as at end-October 2020) maturing on 13 December 2024, which may be used on a short-term basis to fund commitments. The key covenants of the facility include the requirement of a minimum NAV of €350m and an LTV cap of 25%.
Dividend policy and record
In the long term, PEY targets an annual dividend payout of c 5% of NAV with semi-annual payments, usually made in June and December. Although the target value is set as a percentage of NAV, which theoretically could result in high dividend volatility, PEY had maintained or increased the dividend in every year since the policy was introduced in 2011. Investors may elect to have their dividends paid in sterling instead of euros, as well as choosing to invest them in the dividend reinvestment plan. The last full-year dividend paid amounted to €0.58 per share in FY19, which implied a 5.3% yield based on the end-2019 share price.
However, in response to COVID-19, the company provided revised dividend guidance, assuming an annual payment in FY20 of no less than €0.29 per share. Having said that, we note that the decision was made to preserve sufficient liquidity to provide support for the portfolio companies, which may be negatively affected by the crisis, rather than PEY itself. On 23 June, the Board of Directors declared a first interim dividend of €0.145 per share, which was paid to shareholders on 7 August.
As the investment manager worked closely with the portfolio companies’ boards to assess and mitigate the potential operational and financial impact of the pandemic, the majority of portfolio companies have proved resilient. With a positive outlook for the portfolio, the potential capital requirement to support PEY’s holdings has declined significantly, enabling a return to the normal level of dividend payments from FY21. Furthermore, the second dividend payment for FY20 has been announced, which will be equal to the H219 payment of €0.29 per share. The total dividend distribution for the year will reach €0.435 per share, which implies a 4.0% yield based on share price as at 9 December 2020.
Peer group comparison
We compare PEY with a peer group consisting of selected funds from the AIC Specialist: Private Equity sector, which we have expanded from our previous note by adding NB Private Equity Partners. The peers vary in terms of regional exposure and investment strategies, including funds-of-funds, co-investments and direct PE investments.
Exhibit 14: Listed private equity investment companies peer group, as at 9 December 2020* in sterling terms
% unless stated |
Country focus |
Market cap (£m) |
NAV TR 1 year |
NAV TR 3 years |
NAV TR 5 years |
Latest discount) |
Ongoing Charge |
Perform. Fee |
Net Gearing |
Dividend yield (%) |
|
Princess Private Equity |
Global |
684.5 |
14.8 |
38.2 |
118.3 |
(14.6) |
1.87 |
Yes |
99 |
4.0 |
|
Apax Global Alpha |
Global |
867.3 |
19.4 |
53.3 |
104.0 |
(15.1) |
0.70 |
Yes |
97 |
5.4 |
|
BMO Private Equity Trust |
Global |
229.2 |
3.5 |
24.7 |
59.5 |
(19.4) |
1.22 |
Yes |
115 |
4.9 |
|
Deutsche Beteiligungs |
Europe |
508.5 |
0.3 |
17.0 |
99.6 |
20.2 |
0.06** |
No |
99 |
4.5 |
|
HarbourVest Global Priv Equity |
Global |
1,415.2 |
7.9 |
45.1 |
97.9 |
(19.8) |
0.55 |
No |
96 |
0.0 |
|
HgCapital Trust |
UK |
1,228.0 |
25.6 |
76.7 |
171.6 |
(1.0) |
1.56 |
Yes |
100 |
1.6 |
|
ICG Enterprise Trust |
UK |
625.8 |
0.9 |
29.0 |
79.3 |
(18.9) |
1.37 |
Yes |
98 |
2.5 |
|
JPEL Private Equity |
Global |
117.6 |
(7.7) |
(3.4) |
45.0 |
(24.7) |
1.29 |
Yes |
93 |
0.0 |
|
NB Private Equity Partners |
Global |
493.3 |
(0.0) |
24.7 |
73.9 |
(25.4) |
2.18 |
Yes |
119 |
4.5 |
|
Oakley Capital Investments |
Europe |
497.6 |
14.9 |
60.3 |
109.8 |
(22.1) |
1.10 |
Yes |
93 |
1.6 |
|
Pantheon International |
Global |
1,257.6 |
7.6 |
34.1 |
85.9 |
(22.8) |
1.23 |
Yes |
93 |
0.0 |
|
Standard Life Private Equity Trust |
Europe |
536.6 |
7.3 |
30.4 |
98.0 |
(24.1) |
1.12 |
No |
91 |
3.8 |
|
Symphony International |
APAC |
141.0 |
(36.2) |
(35.7) |
(15.7) |
(43.6) |
2.44 |
No |
98 |
6.8 |
|
Peer group average |
654.6 |
3.6 |
29.7 |
84.0 |
(18.1) |
1.34*** |
99 |
3.0 |
|||
PEY rank in group (13 funds) |
5 |
4 |
5 |
2 |
3 |
3 |
4 |
6 |
|||
Source: Morningstar, Refinitiv, Edison Investment Research. Note: *Performance data to 31 October 2020 (Latest available NAV as at end-June for Oakley Capital Investments, end-July for ICG Enterprise Trust and end-August for JPEL Private Equity). **Calculated as opex less fee income divided by total AuM. ***Excluding DBAG. TR = total return. All returns expressed in sterling terms.
The 14.8% NAV TR (in sterling terms) recorded by PEY for the 12-month period ended 31 October 2020, ranks it fourth among the peers, which reported a wide range of returns from a 36.2% loss (Symphony International) to a 25.6% return (HgCapital). PEY’s reported return sits well above the peer group average of 3.6% and median of 7.3%. PEY has also fared better than average in the three-year (38.2% vs the 30.4% median) and five-year periods. PEY’s share price discount to NAV sits at 14.6% as at 9 December 2020, which is narrower than the peer average of c 18.1%. Based on the revised policy, its dividend yield amounts to 4.0% and exceeds the peer group average of 3.0%.
The board
PEY has six non-executive directors, five of whom are considered independent of the manager. Richard Battey, who joined the board in 2009, became chairman in September 2018 following Brian Human’s retirement from the role. Henning von der Forst became a director in 2012. Felix Haldner (a partner at Partners Group, and as such deemed non-independent) and Steve Le Page (chairman of the audit committee) were appointed in 2017, with Fionnuala Carvill and Merise Wheatley joining the board in September 2018. The directors have professional backgrounds in investment management, accountancy and risk management.
|
|
Research: TMT
With an improving outlook for advertising spend, The MISSION should see a good bounce in revenues in FY21. Initiatives such as MISSION Made, launched in October, should help drive efficiency, with increasing use of shared central resources and a careful eye on costs also set to lead a rebound in margin. The financial outcome will partially be determined by revenue mix, with the group exposed to high-performing segments, such as tech and pharma, as well as areas with greater COVID-19 related issues, such as property and events. There are no changes to our forecasts at this stage. The group’s valuation remains well below that of peers.