Last close As at 05/08/2026
GBP0.45
▲ 0.20 (0.45%)
Market capitalisation
GBP89m
Research: Financials
Record
Written by
Record |
Good performance in uncertain times |
Q3 trading update |
Financial services |
25 January 2017 |
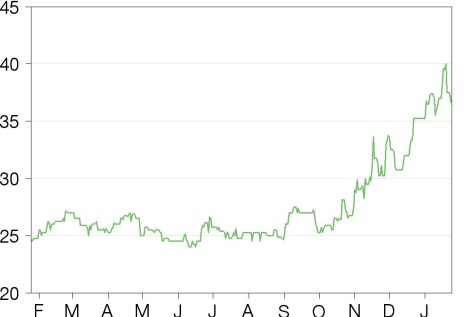
Share price performance
Business description
Next events
Analysts
Record is a research client of Edison Investment Research Limited |
|||||||||||||||||||||||||||||||||||||||||||||||||||
Record’s Q317 trading update continued a series of positive updates through the financial year. It showed an increase in assets under management equivalent (AUME), positive currency for return performance and reported continuing interest in the company’s products in a climate of political and economic uncertainty. We have slightly raised our estimates to account for the higher AUME and recent dollar strength. Against this background, the rating of 13.7x FY17e earnings, supported by a yield of 4.6%, appears undemanding.
Year end |
Revenue (£m) |
PBT* |
EPS* |
DPS |
P/E |
Yield |
03/15 |
20.9 |
7.5 |
2.65 |
1.65 |
13.7 |
4.6 |
03/16 |
21.2 |
7.0 |
2.54 |
1.65 |
14.3 |
4.6 |
03/17e |
21.9 |
7.4 |
2.64 |
1.65 |
13.7 |
4.6 |
03/18e |
23.5 |
8.4 |
2.97 |
1.65 |
12.2 |
4.6 |
Note: *PBT and EPS exclude non-controlling interests relating to seed investments. Prospective DPS excludes any special dividends.
Q317 update
The update marked a continuation of positive performance by most of the currency for return strategies, supported by divergent interest rate policies among major central banks. AUME grew by 2.9% from $55bn to $56.6bn, with net client inflows of $2.2bn in the quarter set against negative net market and exchange rate movements of $0.6bn. In sterling terms, this overall growth was magnified to 8% by the dollar’s recent strength. Even allowing for the announced AUME outflows of $1bn from end January, Record will have seen net inflows since September 2016. Fee rates are largely unchanged for all products.
Estimates raised
The AUME movements have a positive effect on our estimates, which do not have any net flows or market movement assumptions built into them. We have allowed for the reported reduction in AUME of $1bn since the end of the quarter. Our FY17 and FY18 revenue estimates have increased by 1% and 2%, respectively, which feeds through to increases in PBT and earnings. We have not changed our dividend forecast of 1.65p in FY17 and FY18, but as in previous notes we point out a change to the dividend policy adopted this financial year: the board will consider returning earnings in excess of the dividend to shareholders if it is satisfied that the company has a sufficient capital buffer to justify doing so. We estimate that a total dividend in FY17 of 2.55p may be possible.
Valuation: Currency volatility
At a calendar FY16e P/E ratio of c 14x our estimated earnings, Record is ranked in line with the average for UK asset managers and has the lowest EV/EBITDA ratio of the broad peer group (see Exhibit 4 on page 4). Exposure to the US dollar and related uncertainty over the impact of President Trump may explain that to some extent, but those factors could drive AUME inflows too. A continuation of positive currency for return performance, further AUME growth and any special distribution could be catalysts for a re-rating.
Q317 update
The quarterly update covering the three months to 31 December 2016 showed a further increase in AUME, driven largely by $2.2bn of client flows, and positive market movements of $1.8bn, partly offset by an exchange rate impact of negative $2.4bn for a net increase of $1.6bn. Dollar strength was the dominant theme of the quarter after President Trump’s surprise victory in the US election in November. The period was also marked by continued divergence of central bank policy: the Federal Reserve increased its base rate by 0.25% in December, in contrast with the Bank of England’s most recent move to cut rates following the EU referendum and the European Central Bank decision to extend its quantitative easing programme in December. Highlights from the update were:
■
AUME stood at $56.6bn at 31 December, up 2.9% from 30 September ($55bn) and client numbers were up by three to 64.
■
Positive client flows in Dynamic Hedging ($0.5bn) and Passive Hedging ($1.3bn) were partially offset by post-period end terminations of one Dynamic Hedging mandate to manage $0.3bn of AUME and six Passive Hedging mandates covering $0.7bn. The latter are all related but count as separate accounts, so while the client count is now 57, the change in terms of business relationships has been smaller.
■
The multi-product segment saw inflows of $0.4bn in the quarter.
■
Performance in the quarter was positive for US Dynamic Hedging clients as the dollar strengthened, with the highest gains from hedging the yen. For UK-based Dynamic Hedging clients the programme controlled hedging losses as sterling weakened against the weighted basket of currencies, with negative returns mainly from hedging the US dollar. The multi-strategy segment comprising FTSE Currency FRB10, Emerging Market, Momentum and Value products saw positive performance as gains in FRB10 and Emerging Markets strategies outweighed losses in the other two. The longest-running mandate now has annualised ungeared performance of 1.76% since inception on 31 July 2012.
■
Fees remain stable and we assume 13bp for Dynamic Hedging, 17bp for Currency for return, 20bp for Multi-strategy and 4bp for passive mandates. No performance fees were earned in the quarter.
Exhibit 1: AUME changes
$bn |
30 September 2016 |
31 December 2016 |
30 September 2016 |
31 December 2016 |
Net flows |
Net flows |
AUME |
AUME |
|
Dynamic Hedging |
0 |
0.5 |
5.7 |
6.1 |
Passive Hedging |
1.3 |
1.3 |
45.6 |
46.3 |
Currency for return |
0.2 |
0 |
0.9 |
1.0 |
Multi-product |
0 |
0.4 |
2.6 |
3.0 |
Cash and futures |
0 |
0 |
0.2 |
0.2 |
Totals |
1.5 |
2.2 |
55.0 |
56.6 |
Markets |
1.8 |
|||
FX effects |
(2.4) |
|||
Total change |
1.6 |
Source: Record company data
As in past notes, we summarise AUME changes in Exhibit 1, although due to the change in classification explained in our last note, direct comparison with earlier periods is not possible. In terms of client numbers, Q3 saw a net gain of three, continuing the recent trend. Although a general indicator, client numbers are a relatively crude one: the gain of three includes the loss of one client because two mandates from funds controlled by the same organisation have merged. Similarly, the six passive mandates terminated in Q4 are with separate legal entities that share a parent, so the loss is effectively only one business relationship. We note that if the outflows reported in Q417 are included, net client flows since September 2016 remain positive or flat for each segment.
In Exhibit 2 we summarise the performance of the main currency for return products given in the trading update. As at the last update, the FTSE Currency FRB10 Index fund continues to track the index closely with 1.8x gearing. The performance of the FRB10 and Emerging Markets strategies outweighed losses in the Momentum and Value components, meaning that the multi-strategy product was also positive in the quarter.
Exhibit 2: Currency for return products – performance data
Q3 |
Q2 |
Q1 |
Annualised since inception |
Inception |
|
FTSE FRB10 Currency Index |
+1.96 |
+1.37 |
+0.78 |
||
Emerging market product (ungeared) |
+4.02 |
+2.51 |
+0.63 |
+1.89 |
30/11/2009 |
Multi-strategy product (ungeared) |
+1.11 |
+1.35 |
+1.48 |
+1.76* |
31/07/2012 |
Source: Record company data. Note: *Annualised performance since inception for the longest standing multi-strategy mandate.
In their comments on the market outlook, management reiterated the observation that market volatility, driven by a variety of political and economic surprises, is still providing Record with opportunities to discuss its return-seeking and risk-reducing products with existing and potential clients. Elections will take place in France, the Netherlands, Italy and Germany in the next 18 months, adding to uncertainty. Combined with several positive quarters of performance to date and a divergent interest rate environment supportive of carry trades such as those used in forward rate bias strategies, Record appears well-placed to attract more business and continue to perform well.
Estimate changes
Our forecasts do not assume any change in AUME nor any market performance, therefore the positive AUME and market movement reported in the Q3 update lead us to increase our estimates slightly, as outlined in Exhibit 3. We have not changed our dividend forecast, but would highlight the change to the board’s dividend policy now that it considers Record’s capital buffer to be sufficient for the company’s foreseeable needs and the confidence of its existing and potential clients.
Exhibit 3: Earnings revisions
|
Revenue* (£m) |
% chg.
|
PBT* (£m) |
% chg.
|
EPS* (p) |
% chg.
|
DPS (p) |
% chg.
|
||||
|
Old |
New |
Old |
New |
Old |
New |
Old |
New |
||||
03/17e |
21.7 |
21.9 |
1% |
7.2 |
7.4 |
2% |
2.62 |
2.64 |
1% |
1.65 |
1.65 |
0% |
03/18e |
23.1 |
23.5 |
2% |
8.1 |
8.4 |
4% |
2.91 |
2.97 |
2% |
1.65 |
1.65 |
0% |
Source: Record accounts, Edison Investment Research. Note: *Normalised.
Valuation
As in previous notes we compare Record with a peer group of UK asset managers; although it is differentiated by its focus on foreign currency and hedging strategies and its level of AUME is driven by different factors, Record does share some features of its business model with this group. As shown in Exhibit 4, Record is near the average in terms of prospective P/E (shown for the 2016 calendar year) and has the lowest EV/EBITDA multiple. While the share price has risen 45% over the last six months, the dividend yield remains attractive at 4.6%. The company’s capital position is strong: it had marketable securities, cash and cash equivalents of £28.8m at the half-year as well as shareholders’ funds of £35m. The board may decide that this is sufficient to give clients confidence in Record’s financial stability and may therefore return excess earnings to shareholders. Our estimates indicate that a special dividend of 0.9p might be possible, increasing the dividend yield to c 7% on the current share price of 36.25p.
Exhibit 4: Earnings and EBITDA multiples for UK fund managers
Price |
Market capitalisation (£m) |
P/E ratio* |
EV/EBITDA |
|
Aberdeen Asset Management |
266.4 |
3,494 |
12.5 |
8.3 |
Ashmore |
293.2 |
2,202 |
15.9 |
9.7 |
City of London Inv Group |
355.0 |
95 |
10.1 |
7.8 |
Henderson |
228.5 |
2,550 |
15.4 |
10.9 |
Impax Asset Management |
70.0 |
89 |
14.8 |
N/A |
Jupiter |
393.4 |
1,797 |
13.0 |
8.8 |
Liontrust |
386.9 |
176 |
11.6 |
7.8 |
Man Group |
126.4 |
2,179 |
12.9 |
7.7 |
Polar Capital |
376.3 |
357 |
16.6 |
12.6 |
Schroders |
2,989.0 |
8,051 |
17.0 |
12.8 |
Average |
14.0 |
9.6 |
||
Record |
36.3 |
80 |
14.3 |
7.0 |
Source: Bloomberg, Edison Investment Research. Note: *Using calendar 2016e earnings. Priced as at 24 January 2017.
Exhibit 5: Financial summary
£000s |
|
2015 |
2016 |
2017e |
2018e |
|
Year to March |
|
|
IFRS |
IFRS |
IFRS |
IFRS |
PROFIT & LOSS |
|
|
|
|
|
|
Revenue |
|
|
21,057 |
21,134 |
21,862 |
23,495 |
Operating expenses |
|
|
(13,521) |
(14,344) |
(14,629) |
(15,273) |
Operating Profit (before amort. and except.) |
|
7,536 |
6,790 |
7,233 |
8,222 |
|
Finance income |
|
|
146 |
143 |
142 |
146 |
Profit Before Tax |
|
|
7,682 |
6,933 |
7,375 |
8,368 |
Taxation |
(1,708) |
(1,523) |
(1,549) |
(1,757) |
||
Minority interests |
|
|
(192) |
131 |
0 |
0 |
Attributable profit |
|
|
5,782 |
5,541 |
5,826 |
6,611 |
|
|
|
|
|
|
|
Normalised revenue (underlying) |
|
|
20,865 |
21,246 |
21,862 |
23,495 |
Operating expenses (excl. dep'n and amortisation) |
|
|
(13,206) |
(14,023) |
(14,308) |
(14,952) |
EBITDA |
|
|
7,659 |
7,223 |
7,554 |
8,543 |
Depreciation and amortisation |
|
|
(315) |
(321) |
(321) |
(321) |
Normalised Operating profits |
|
|
7,344 |
6,902 |
7,233 |
8,222 |
Finance income |
|
|
146 |
143 |
142 |
146 |
Profit Before Tax (norm) |
|
|
7,490 |
7,045 |
7,375 |
8,368 |
|
|
|
|
|
|
|
Normalised revenue/AuME (excl. perf fees) bps |
|
|
6.0 |
4.7 |
0.0 |
5.2 |
Normalised Operating Margin norm. (%) |
|
|
35.2 |
32.5 |
33.1 |
35.0 |
|
|
|
|
|
|
|
Average Diluted Shares Outstanding (m) |
|
|
218.4 |
217.9 |
220.4 |
222.4 |
Basic EPS (p) |
|
|
2.66 |
2.55 |
2.66 |
2.99 |
EPS - normalised fully diluted (p) |
|
|
2.65 |
2.54 |
2.64 |
2.97 |
Dividend per share - proposed (p) |
|
|
1.65 |
1.65 |
1.65 |
1.65 |
|
|
|
|
|
|
|
BALANCE SHEET |
|
|
|
|
|
|
Fixed Assets |
|
|
3,273 |
423 |
332 |
241 |
Intangible Assets |
|
|
504 |
299 |
155 |
11 |
Tangible Assets |
|
|
129 |
81 |
134 |
187 |
Investments |
|
|
2,567 |
0 |
0 |
0 |
Deferred tax assets |
|
|
73 |
43 |
43 |
43 |
Current Assets |
|
|
37,053 |
40,541 |
42,960 |
46,190 |
Debtors |
|
|
6,324 |
5,695 |
5,860 |
6,298 |
Cash |
|
|
12,010 |
21,720 |
23,973 |
26,767 |
Money market instruments |
|
|
18,100 |
13,020 |
13,020 |
13,020 |
Other |
|
|
619 |
106 |
106 |
106 |
Current Liabilities |
|
|
(4,522) |
(3,256) |
(3,341) |
(3,523) |
Creditors |
|
|
(2,949) |
(2,372) |
(2,441) |
(2,623) |
Other |
|
|
(1,573) |
(884) |
(900) |
(900) |
Net Assets |
|
|
35,804 |
37,708 |
39,951 |
42,908 |
Minority interests |
3,876 |
4,019 |
4,019 |
4,019 |
||
Net assets attributable to ordinary shareholders |
31,928 |
33,689 |
35,932 |
38,889 |
||
No of shares at year end |
217.5 |
217.2 |
221.4 |
221.4 |
||
NAV per share p |
14.7 |
15.5 |
16.2 |
17.6 |
||
CASH FLOW |
|
|
|
|
|
|
Operating Cash Flow |
|
|
6,472 |
5,791 |
5,925 |
6,530 |
Capex |
|
|
(128) |
(29) |
(130) |
(130) |
Cash flow from investing activities |
|
|
0 |
(39) |
(100) |
(100) |
Dividends |
|
|
(3,266) |
(3,750) |
(3,583) |
(3,653) |
Other financing activities |
|
|
(2,571) |
7,737 |
142 |
146 |
Other |
|
|
0 |
0 |
0 |
0 |
Net Cash Flow |
|
|
507 |
9,710 |
2,253 |
2,793 |
Opening cash/(net debt) |
|
|
11,503 |
12,010 |
21,720 |
23,973 |
Other |
|
|
0 |
0 |
0 |
0 |
Closing net (debt)/cash |
|
|
12,010 |
21,720 |
23,973 |
26,767 |
Closing net debt/(cash) including money market instruments |
30,110 |
34,740 |
36,993 |
39,787 |
||
|
|
|
|
|
|
|
Closing AUME ($bn) |
|
|
55.4* |
52.9 |
55.6 |
55.6 |
Source: Record accounts, Edison Investment Research. Note: *2015 AUME on previous disclosure basis.
|
|