Last close As at 05/08/2026
—
— 0.00 (0.00%)
Market capitalisation
—
Research: Financials
Secure Trust Bank (STB) reported results that were close to expectations for 2016, a year that saw major changes as the group generated substantial profit from the Everyday Loans Group sale, gained independence and moved to the Main Market. At the same time there was substantial growth in the loan book contributing to underlying EPS growth of 20%. Looking ahead, there is scope for further organic growth but STB will also consider acquisitions on a disciplined basis. Both have the potential to contribute to a strengthening in the return on equity from the 2016 level of 11.9%, towards the return on required equity of nearly 20%.
Written by
Secure Trust Bank |
Ready for the next stage |
FY16 results |
Financial services |
31 March 2017 |
Share price performance
Business description
Next events
Analysts
Secure Trust Bank is a research client of Edison Investment Research Limited |
|||||||||||||||||||||||||||||||||||||||||||||||||
Secure Trust Bank (STB) reported results that were close to expectations for 2016, a year that saw major changes as the group generated substantial profit from the Everyday Loans Group sale, gained independence and moved to the Main Market. At the same time there was substantial growth in the loan book contributing to underlying EPS growth of 20%. Looking ahead, there is scope for further organic growth but STB will also consider acquisitions on a disciplined basis. Both have the potential to contribute to a strengthening in the return on equity from the 2016 level of 11.9%, towards the return on required equity of nearly 20%.
Year end |
Operating income (£m) |
PBT* |
EPS* |
DPS** |
P/E |
Yield |
12/15 |
92.1 |
26.7 |
114.3 |
72.0 |
18.6 |
3.4 |
12/16 |
118.2 |
32.9 |
137.7 |
75.0 |
15.5 |
3.5 |
12/17e |
141.0 |
33.0 |
140.8 |
78.0 |
15.1 |
3.7 |
12/18e |
168.3 |
50.2 |
213.1 |
82.0 |
10.0 |
3.8 |
Note: *PBT and EPS on an underlying basis, excluding amortisation of acquired intangibles, exceptional items and share-based payments. **2016 DPS ex 165p special dividend.
FY16 results meet expectations
STB’s full year results were close to our expectations in terms of loan growth (+38%), operating income (+28%), loan impairments (+65%) and underlying net income (+21%). During the year the sale of Everyday Loans Group (ELG) was completed realising a net profit of £116.8m, which made a significant contribution to the increase in NAV per share from 776p to 1,179p, after payment of the special dividend of 165p following the transaction. Investment has been made in the development of the new mortgage product launched in March this year, further broadening the product range, and in the savings platform that will allow a wider offering on the liability side of the balance sheet, including an ISA later this year.
Outlook: a range of options to pursue
STB is taking a cautious approach in several areas having withdrawn from new unsecured personal lending and tempered its appetite for lending in real estate and asset finance where the returns on offer are unappealing compared with the risks. Fortunately, the diversity of the loan book still provides a number of avenues for organic growth including residential mortgages which STB sees as becoming a third leg for the group alongside consumer and business lending over the long term. Acquisitions could accelerate growth and improvement in returns, while pricing/risk discipline may point the group to smaller partial purchases rather than a more headline grabbing ‘whole bank’ transaction with all the risks that could bring. Our EPS for FY17e are trimmed by c 8% but increased by 4% for FY18e (page 9).
Market exercises caution in its valuation
We have maintained our assumed ROE at 15.5% in our ROE/COE valuation (page 11) giving a value of 2,480p (2,700p previously). The current price suggests an ROE assumption of 13.3% which appears cautious given STB’s record and positioning.
Company description
Incorporated in 1954, Secure Trust Bank has a long trading record as a specialist lender. It was a subsidiary of Arbuthnot Banking Group (ARBB) from 1985 and became independent in June 2016 following a sale of shares to institutional shareholders that took ARBB’s stake from over 50% to below 20% (18.64% as at 20 March). Floated on AIM in 2011, STB shares were admitted to the premium segment of the Official List in October 2016. Lord Forsyth, who joined the board of STB in 2014, succeeded Sir Henry Angest, also the chief executive of ARBB, as non-executive chairman, also in October last year.
As shown in Exhibit 1, loan growth has been rapid since the financial crisis (57% annual compound 2010-16), with greater diversification as the scope of the business has been expanded organically and through acquisition.
The current lending products include motor, retail point of sale, a newly launched mortgage product and business finance (which includes real estate finance, invoice discounting, factoring and asset finance). A greater focus on secured lending was accelerated by the sale of the personal loans business, Everyday Loans Group, completed in April 2016 which generated a substantial, £116.8m, post-tax profit, increasing the capital headroom available to support development of the group. STB announced in January this year that it had decided to stop originating unsecured personal loans given the unattractive balance of risk and reward it saw in this area.
The segmental analysis of year-end customer loans is shown in Exhibit 2; management has indicated that on a long-term view it aims to achieve three broadly equal legs to the business: consumer, business and mortgage lending, focusing on those areas that provide attractive returns and avoiding cross-subsidy of loss-making products. The funding policy is to broadly match customer loans and deposits in quantity and duration.
Management has also made clear that it will review opportunities for inorganic growth and in its commentary with the FY16 results mentioned interest in accelerating growth in mortgages, invoice and asset finance through acquisition should appropriate investments become available. CEO Paul Lynam has said that an acquisition of the Co-op Bank as a whole would be too high risk, but purchase of a part of this or another bank’s portfolio might provide accretive opportunities. In this event, the existing surplus capital could be helpful while the changes to STB’s ownership structure and its move to the Main Market should facilitate any future equity issuance and increase the range of strategic options.
|
Exhibit 1: STB customer loan book evolution |
Exhibit 2: Segmental customer loans (end 2016) |
|
|
|
Source: Secure Trust Bank. Note: ex-ELG. |
Source: Secure Trust Bank |
|
Exhibit 1: STB customer loan book evolution |
|
|
Source: Secure Trust Bank. Note: ex-ELG. |
|
Exhibit 2: Segmental customer loans (end 2016) |
|
|
Source: Secure Trust Bank |
FY16 results
STB’s full year results were close to our expectations both in terms of loan book growth and profits. The year was one of substantial change for the group as it became independent from Arbuthnot Banking Group, completed the sale of Everyday Loans Group (ELG) and moved to the main market. Key figures are highlighted below and in Exhibit 3.
■
Overall loan book growth was 38% (excluding ELG) to over £1.3bn.
■
Operating income increased 28% to £118.2m.
■
Reported profit before tax was up 1% to £25m, while underlying PBT increased 23%. Among other adjustments, underlying PBT for 2016 adds back £3.5m of bonus payments relating to the ELG sale, £3.4m of transformation costs (primarily investment to launch the mortgage product, spending to develop a new savings platform and the cost of closing the current account offering).
■
Reported post-tax return on average equity was 11.9% versus 15.8% and an underlying 19.8% based on equity at a target common equity tier 1 ratio (CET1) of 12%.
■
The full year dividend for 2016 was 75p (+4%). The special dividend of 165p following the ELG sale was paid in July 2016.
■
The CET1 ratio increased from 13.6% (end 2015) to 17.4%. This benefited from the ELG sale profit but the increased risk weighting (from 100% to 150%) required by the PRA for residential development lending trimmed 1.6 percentage points from the ratio. The leverage ratio was 14.1% compared with 10.4%.
■
Reflecting the surplus equity the loan to deposit ratio has been allowed to increase temporarily from 104% to 115%.
Exhibit 3: Selected figures from FY16 results
£m except where shown |
2015 |
2016 |
Change (%) |
P&L |
|||
Gross interest income |
100.5 |
130.0 |
29% |
Interest expense |
(21.6) |
(26.3) |
22% |
Net interest income |
78.9 |
103.7 |
31% |
Impairment losses |
(16.8) |
(27.7) |
65% |
Reported pre-tax profit |
24.8 |
25.0 |
1% |
Underlying profit |
26.7 |
32.9 |
23% |
Basic EPS (p) |
106.1 |
102.6 |
(3%) |
Underlying diluted EPS (p) |
114.3 |
137.7 |
20% |
Other |
|||
Loan book (ex-ELG) |
960.6 |
1321.0 |
38% |
Deposits |
923.3 |
1151.8 |
25% |
Loan to deposit ratio (%) |
104% |
115% |
|
Customers (number) |
532,278 |
754,968 |
42% |
Total risk exposure |
861.3 |
1266.9 |
47% |
CET1 ratio (%) |
13.6% |
17.4% |
Source: Secure Trust Bank. Note: 2015 figures are for continuing operations.
Lending
Within the overall loan growth of 38% the fastest growth was recorded in the commercial finance area (+114%) which provides invoice financing and is still early in its development after two full years of trading. Management notes that the business has a strong team and modern IT platform enabling it to win complex, profitable transactions in competition with larger players. Both asset and real estate finance saw substantial growth despite adopting a more cautious approach following the Brexit vote. Asset finance (a partnership with Haydock Finance providing SME loans for commercial assets such as vehicles and building equipment), increased its loan book by 66% also reflecting its relative youth as a business. The pace of growth nevertheless slackened during the year as loan to value criteria were tightened while other players continued to bid aggressively for new business. The larger real estate segment increased loans by 23%. Here, loans are primarily for residential investment (63% of the book at the year-end) and development. The loan to gross development value is capped at 50%. Development loans are generally being repaid faster than expected, speeding the process of repricing the book to allow for the increased capital requirement noted earlier.
Within the consumer lending part of the book the remaining personal lending activity has continued to contract and, after the year end, STB announced that it would not be making fresh loans in this area for the moment as competitive behaviour has meant that returns are unattractive relative to risks. Retail point of sale lending (prime lending for in-store and on-line purchases from retail partners of cycle, music, furniture and other products) increased by nearly 48%. Motor finance (Moneyway) also saw growth of over 40% in its non-prime loan book (+42%). This was despite a competitive environment in which some players priced aggressively and offered high commissions. Moneyway chose not to get involved in this skirmish and the withdrawal of a new entrant meant conditions improved in the second half; Moneyway also widened its credit criteria in the second half in order to drive profitable growth.
|
Exhibit 4: STB segmental customer loans (excludes ELG) |
|
|
Source: Secure Trust Bank |
Interest income and impairments
In 2016 STB’s interest income increased by 29% and interest expense by 22% allowing net interest income to increase by 31%. Looking at margins there was some overall reduction, in part reflecting mix changes arising from the growth differentials outlined above. The overall interest income margin on average loan balances was 11.4% versus 12.7% in 2015 while the net interest margin was 9.2% compared with 10.6% for 2016 and 2015, respectively. Segmental analysis of the interest income margin is included in Exhibit 5 showing that most areas saw some reduction in margin which acted as a modest counter to the continued strong growth in loan balances.
Exhibit 5: Interest income and impairments as % of average lending balances
(%) |
Interest income |
Impairments |
||
2015 |
2016 |
2015 |
2016 |
|
Personal loans (continuing) |
21.3 |
16.7 |
5.9 |
6.5 |
Motor loans |
21.8 |
19.5 |
4.8 |
7.2 |
Retail finance |
13.6 |
12.6 |
3.1 |
3.5 |
Real estate finance |
8.1 |
7.3 |
0.0 |
0.0 |
Asset finance |
6.4 |
7.6 |
0.0 |
0.6 |
Commercial finance |
2.3 |
3.0 |
0.0 |
0.4 |
DMS/other |
12.2 |
13.9 |
(2.1) |
(3.6) |
Total |
12.7 |
11.4 |
2.3 |
2.4 |
Source: Edison Investment Research, Secure Trust Bank. Note: 2015/16 DMS/other impairment write backs.
The level of impairments as a percentage of average loan balances increased slightly from 2.3% to 2.4%. Within this there are two areas to mention where there were specific drivers of change: debt managers services (DMS)/other and motor loans. Within the DMS/other heading there was an increase in the level of impairment write back and STB reports that DMS moved into profit for the year (£0.2m). The significant increase in the rate of impairment shown for motor loans reflects two factors. First, the group has adopted a more cautious level of provisioning to reflect a more conservative view on risks in the wake of the Brexit vote. This involved assuming a longer period to emergence of bad debt resulting in an increase in the level of provisioning. While the group has not given a figure for the impact of this change we assume it is below the £1.5m specified for the second factor, which is the cost of voluntary early termination of loan contracts. This arises from a borrower’s legal right to terminate their hire purchase contract once they have made half their payments. Termination is more likely if the borrower has negative equity in the vehicle at the mid-point and STB has taken steps to adjust the amortisation profile of loans to reduce the likelihood of this occurring. The ‘loss’ reflected here is primarily related to the accrual of profit rather than losses on vehicle disposal. STB indicates that it may reallocate this item from the impairment line in future periods to clarify impairment presentation.
Stripping £2m from the impairment provision for 2016 as an illustrative adjustment for the precautionary change in assumption and to remove the early termination item would give an impairment rate of 6.2%. This is still noticeably higher than the prior year but a full 1 percentage point lower than the reported level implies.
Funding
The evolution of the group’s customer deposits and interest cost are shown in Exhibits 6 and 7. The proportion of term accounts has increased over time as the group has continued to match the tenor of assets and liabilities. The level of sight deposits has fallen, in part reflecting the closure of the current account product (completed end September 2016). Funding costs fell in line with market trends and, as noted earlier, the increase in level of customer deposits (11.5%) did not match loan book growth as STB chose to employ its excess capital and allow its loan to deposit ratio to increase temporarily.
|
Exhibit 6: Customer deposits growth and profile |
Exhibit 7: Interest cost as % of average deposits |
|
|
|
Source: Secure Trust Bank, Edison Investment Research |
|
Exhibit 6: Customer deposits growth and profile |
|
|
Source: Secure Trust Bank, Edison Investment Research |
|
Exhibit 7: Interest cost as % of average deposits |
|
|
Source: Secure Trust Bank, Edison Investment Research |
Capital
Despite overall loan growth of 38% and the jump in risk weighting for real estate development loans, STB’s CET1 ratio increased from 13.6% to 17.4% benefiting from the increase in equity arising from the ELG sale. STB and other challenger banks have reiterated their views on the unfair disparity between the capital weightings that apply to large incumbent banks using internal ratings based (IRB) approaches and the standardised approach employed by smaller banks. STB cites the sharp contrast for residential mortgages where the IRB may apply a weighting of 3.3% compared to the standardised level of 35% for an identical loan. There have been indications of some recognition of this by the Bank of England during 2016 and STB sees potential for some softening of the differential, possibly through discretionary application of pillar 2 capital requirements initially.
Mortgage product launch
STB announced the launch of its mortgage product in March; the business is led by Esther Morley who joined from specialist mortgage lender, Kensington, and has 20 years of banking experience including previous roles at Start Mortgages, Investec and HSBC. The mortgages will only be available through intermediaries (initially Mortgage Advice Bureau). The emphasis is on clarity of terms and criteria with lending decisions taken by experienced underwriters assisted by an operating platform described as state-of-the-art. STB is addressing the segment of the market it believes is underserved by high street lenders including the self-employed, contract workers (including zero hours), older borrowers or those with a recently restored credit history.
Among the terms are a maximum loan of £1m up to 75% loan to value (or £750,000 up to 80% LTV), a product fee of £999 and, for a 70% LTV two-year fixed loan, rates that range between 3.24% and 4.44% according to credit history. For illustrative purposes if we compare this with two other providers in the non-prime segment, Pepper and The Mortgage Lender, the offering appears to be broadly mid-range consistent with STB’s indication that it would be targeting near-prime rather than higher risk categories. Both these have a wider range of pricing and criteria with The Mortgage Lender, for example, having a product priced at 6.11% for applicants with a weaker credit history.
Background and outlook
The economic background in the UK has been more robust than expected following the Brexit vote and the Treasury’s survey of independent forecasts for 2017 GDP growth have been on an upward trend since September, increasing from 0.7% to 1.6% while the consensus for 2018 is 1.4%. Expectations for unemployment claimant numbers increased following the referendum but have subsequently been stable. This resilience may not be maintained through the process of Brexit negotiations, but avoidance of a sharp worsening in the economy thus far is certainly positive for lenders such as STB.
Turning to trends in lending in the UK the growth in (non-credit card) consumer lending has only relatively recently started to stabilise and soften slightly following a period of post-crisis acceleration (Exhibit 8). Similarly, the growth in car finance (both new and used), as measured by finance provided through dealerships, has remained strong in recent years.
|
Exhibit 8: Consumer credit ex-credit cards |
Exhibit 9: Car finance through dealerships |
|
|
|
Source: Bank of England |
Source: Finance & Leasing Association press releases |
|
Exhibit 8: Consumer credit ex-credit cards |
|
|
Source: Bank of England |
|
Exhibit 9: Car finance through dealerships |
|
|
Source: Finance & Leasing Association press releases |
Looking at lending to small and medium-sized corporates, growth has remained in positive territory (Exhibit 10) while rates have moved down mirroring the reduction in the bank rate and three-month Libor (Exhibit 11). The Bank of England’s network of Agents has reported that the availability of loans to SMEs is modestly above normal levels although there has been tightening in some sectors such as real estate reflecting what we would see as healthy caution among lenders that should help players such as STB continue to grow its loan book selectively on attractive terms.
|
Exhibit 10: SME stock of lending % change |
Exhibit 11: Effective rates on corporate loans |
|
|
|
Source: Bank of England (BoE) |
Source: BoE. Note: PNFC= private non-financial corporation. |
|
Exhibit 10: SME stock of lending % change |
|
|
Source: Bank of England (BoE) |
|
Exhibit 11: Effective rates on corporate loans |
|
|
Source: BoE. Note: PNFC= private non-financial corporation. |
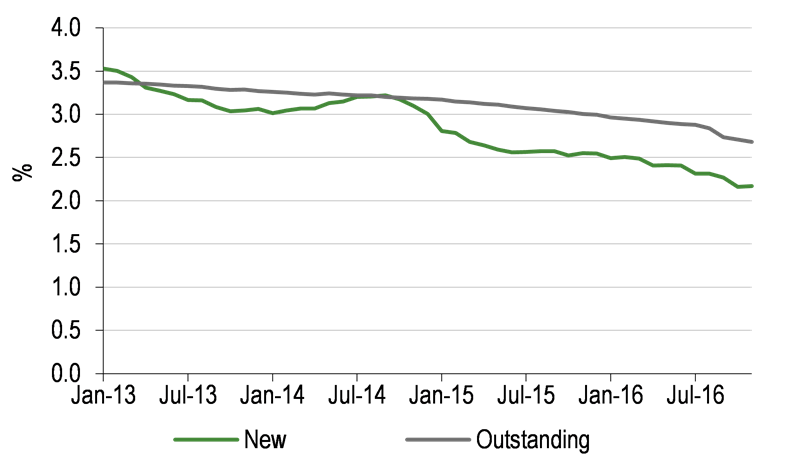
As discussed earlier, STB’s mortgage business is at a very early stage and is addressing a relatively specialised area within the market but it is worth touching on the market background briefly here. As shown in Exhibit 12, loan approvals for purchases have been broadly flat over the last two years although remortgaging loans have been trending up with attractive fixed rate offers acting as an incentive for borrowers to move. Reflecting lower policy rates and to some extent increased competition, rates have moved down over the same period (Exhibit 13). New lending rates remain below the back book indicating a likely continuation of the downward trend in the rate on the outstanding book. While deposit rates have also fallen and respondents to the Bank of England’s credit conditions survey expected a fall in spreads in the first quarter of 2017, STB’s business is operating in a niche area which may be less subject to the broader trends in the mainstream market.
|
Exhibit 12: Approvals of loans secured on dwellings |
Exhibit 13: Effective mortgage rates |
|
|
|
Source: Bank of England |
|
Exhibit 12: Approvals of loans secured on dwellings |
|
|
Source: Bank of England |
|
Exhibit 13: Effective mortgage rates |
|
|
Source: Bank of England |
Prospectively, the focus of the major incumbent banks on core areas of activity and husbanding capital remains a positive feature for STB and other specialist lenders and challenger banks. In the case of STB its strong capital position means it is well placed to addressing unmet needs. The rapid growth of the loan book in recent years could be seen as a risk were the economy to take a turn for the worse, but the prudence shown in withdrawing from fresh unsecured consumer lending is a positive signal of the bank’s prudent approach to growth. Along with other challengers STB has argued strongly for a levelling of the regulatory playing field to enable them to compete on more equal terms with larger banks which have the advantage of internal ratings-based calculations of RWAs. If there is movement on this front this could reduce capital requirements and broaden the market the bank can address.
Financials
We start by showing our revised assumptions for growth in loan book (Exhibit 14) with changes reflecting the 2016 outcome and updates from STB on its appetite for growth in each area. Running down the areas as listed in the table, we have made a somewhat more cautious assumption for STB’s mortgage lending in 2018 although note that, in the market context, the book would be very small on either assumption and the change has limited impact on our earnings estimate.
Reflecting a more cautious approach signalled for real estate and asset finance lending we have assumed numbers which, taken together are £200m and £250m lower than before for 2017e and 2018e, respectively.
We continue to look for good growth in the motor finance book and the group has indicated an interest in expanding its lending from non-prime to subprime, possibly employing a different brand to distinguish the offering. We expect that this will make a modest contribution to growth over the forecast period but could become significant subsequently if it were to gain traction. Changes in other areas are modest and for the total loan book our estimates are c £200m and c £270m lower for the two prospective years.
Exhibit 14: Loan book development estimates
£m |
2014 |
2015 |
2016 |
2017e |
2018e |
Personal unsecured |
88 |
74 |
66 |
33 |
0 |
Motor vehicles |
138 |
166 |
236 |
290 |
360 |
Retail finance |
117 |
220 |
326 |
410 |
520 |
Total retail lending |
342 |
460 |
628 |
733 |
880 |
Mortgage lending |
0 |
0 |
0 |
75 |
250 |
Real estate finance |
134 |
368 |
451 |
500 |
610 |
Asset finance |
5 |
71 |
117 |
103 |
195 |
Commercial finance |
5 |
29 |
63 |
150 |
200 |
Total commercial lending |
143 |
468 |
631 |
753 |
1,005 |
Other |
43 |
32 |
62 |
63 |
65 |
Discontinued |
94 |
114 |
0 |
0 |
0 |
Total lending |
623 |
1,075 |
1,321 |
1,624 |
2,200 |
Source: Edison Investment Research, Secure Trust Bank data
The lower loan book assumptions flow through to a lower interest income forecast for both years. STB expects competition to push up the market cost of funding marginally but expects to benefit from the launch of new savings products facilitated by the investment in a new IT platform, including a cash ISA; the bank will also make balanced use of the Term Funding Scheme. We have therefore assumed a slightly higher overall cost of funding over the forecast period.
Our operating cost estimates are lower than before for both years (an unchanged cost/income ratio for 2017 and a lower level for 2018 as some investment/launch costs are assumed to fall away).
Exhibit 15 summarises changes in our estimates for operating income, underlying PBT, EPS and dividends.
Exhibit 15: Estimate changes
Operating income (£m) |
Underlying PBT (£m) |
Underlying EPS (p) |
Dividend (p) |
|||||||||
Old |
New |
% chg. |
Old |
New |
% chg. |
Old |
New |
% chg. |
Old |
New |
% chg. |
|
2016 |
121.2 |
118.2 |
(2.5) |
31.9 |
32.9 |
3.1 |
141.0 |
137.7 |
(2.4) |
74.0 |
75.0 |
1.4 |
2017e |
142.3 |
141.0 |
(0.9) |
36.0 |
33.0 |
(8.3) |
155.1 |
140.8 |
(9.2) |
77.5 |
78.0 |
0.6 |
2018e |
173.6 |
168.3 |
(3.0) |
48.2 |
50.2 |
4.1 |
208.7 |
213.1 |
2.1 |
82.0 |
82.0 |
0.0 |
Source: Edison Investment Research. Note FY16 new figures are actual reported.
IFRS 9 will apply for FY18
It is important to remember that IFRS 9 will be implemented for reporting periods starting on or after 1 January 2018. This introduces significant changes to disclosure and recognition of credit losses. The standard divides financial instruments into three stages of credit quality. In the first, performing, category a 12-month expected credit loss will be recognised while for the second and third stages, comprising exposures where there has been a significant increase in credit risk or those where there is objective evidence of deterioration, an estimate of expected lifetime credit losses will be made. This is expected and intended to bring forward the recognition of credit losses.
Implementation is complex and is likely to require amendments to systems that not only change the accounting for credit exposures but also have a bearing on the systems used to support the underwriting process and therefore, potentially, the behaviour of some lenders.
We have no indication yet of the potential impact of the change on reported impairment (or other changes) for STB or its more immediate peers but assume that there will be a material increase in provisioning on adoption. In its impact assessment of IFRS 9 the European Banking Authority (EBA) carried out a survey of banks which indicated an average estimated increase in provisions of 18% and up to 30% for 86% of respondents.
It might be thought that earlier recognition of losses would allow a smoothing of credit losses, subject to implementation, although for the segment of loans where lifetime losses are assessed, assumption changes could still give rise to lumpy movements in impairments around turning points in the economic cycle. Indeed, in the EBA survey 75% of banks expect IFRS 9 impairment requirements to increase volatility in the profit and loss, mainly because of a cliff effect when there are moves from 12-month to lifetime expected credit loss estimates.
Turning to capital ratios, the EBA assessment indicated an estimated decrease in CET1 ratio of up to 75bp for 85% of respondents and 50bp in the total capital ratio for 75% of respondents.
Our estimates for FY18 are based on the current accounting standard but if we simply apply an 18% increase to the level of impairments for illustrative purposes, then this would result in a 13% reduction in FY18e profit. This would also reduce equity, return on equity and the CET1 ratio, subject to any taper approach adopted by regulators (again, note that our estimates are for the moment on the current basis). We stress that the impact for STB may differ substantially from the estimate derived from the EBA survey and also note that over time the impact on profits through the cycle would be expected to be less marked or neutral.
Valuation
We have updated our comparative table for challenger banks and specialist lenders. This shows STB standing on an above average historical P/E and yield while it has a below average ROE reflecting its current level of excess capital capacity; the price to book is also below average.
Exhibit 16: Challenger/specialist lender comparative table
Price (p) |
Market cap (£m) |
Historic P/E (x) |
Yield (%) |
ROE (%) |
Price to NAV (x) |
|
Secure Trust Bank |
2,050.0 |
378.7 |
13.0 |
3.5 |
11.9 |
1.6 |
Arbuthnot Banking Group |
1,456.0 |
216.8 |
16.9 |
2.0 |
0.9 |
0.8 |
1PM |
61.0 |
33.5 |
10.4 |
0.8 |
12.9 |
1.2 |
Aldermore |
219.8 |
758.1 |
9.7 |
0.0 |
18.0 |
1.4 |
Close Brothers |
1,537.0 |
2,308.0 |
12.2 |
3.7 |
18.0 |
2.0 |
CYBG |
264.3 |
2,331.5 |
Loss |
0.0 |
5.2 |
0.7 |
Metrobank |
3,304.0 |
2,655.3 |
Loss |
0.0 |
0.6 |
3.3 |
OneSavings Bank |
422.8 |
1,027.8 |
12.4 |
2.1 |
29.1 |
3.2 |
Paragon |
408.4 |
1,122.3 |
10.1 |
3.3 |
12.0 |
1.2 |
Private and Commercial Finance |
25.5 |
43.4 |
8.5 |
0.0 |
13.4 |
1.8 |
Provident Financial |
2,934.0 |
4,335.8 |
19.3 |
4.1 |
38.6 |
5.9 |
Shawbrook |
315.3 |
789.8 |
13.1 |
0.0 |
20.0 |
2.1 |
S&U |
2,035.0 |
243.4 |
3.5 |
3.7 |
15.2 |
1.9 |
Average |
|
|
11.7 |
1.8 |
15.1 |
2.1 |
Source: Bloomberg, Edison Investment Research, company data. Note: Priced at 27 March 2017.
The returns on equity and price to book multiples are set in context in Exhibit 17. Here, STB appears reasonably central in the group with the main outlier (as previously) being Metro Bank where the market arguably appears happy to factor in the target ROE of 20% and a continuation of the strong growth it has recorded. For Secure Trust Bank the case could be made that the market is reluctant at this stage to allow for a potential uplift in return on equity as the bank deploys its capital capacity both organically and, possibly, through acquisition. While there is clearly risk in the delivery of higher returns, the experience of the management team and track record of the business are encouraging indicators.
|
Exhibit 17: Challenger banks/specialist lenders P/NAV vs ROE |
|
|
Source: Bloomberg, Edison Investment Research. Note: Last reported ROEs except Metro based on Q416. |
Finally, we have updated our ROE/COE calculation for STB and if we factor in the same assumptions as in our last note in January (15.5% sustainable ROE, 10% cost of equity and 5% nominal growth) this gives a value of c 2,480p compared with 2,700p previously. The assumed return is above the prospective ROEs arising from our 2017 and 2018 estimates (14.8% and 12.9%) but well below the return on required equity reported for 2016 of 19.8%.
Sensitivities
There are a range of macroeconomic, regulatory and internal factors that will influence the prospects for STB and we briefly highlight a number here.
Interest rate sensitivity is mitigated through asset/liability management with STB reporting the residual mismatch would result in a pre-tax impact of £0.7m or less when parallel movements of 100bp and 200bp are applied across the maturity bandings of the book.
Credit risk in the UK currently appears subdued in an historical context so there is potential for a significant increase should there be unfavourable economic developments. Here the management’s experience of past cycles is evident in the caution shown towards personal unsecured lending and reduced appetite for risk in asset finance and real estate finance. Even so, the recent history of rapid loan growth potentially increases uncertainty in the event of economic weakness.
Regulatory developments could increase the administrative burden for the group further but as noted in the discussion of capital requirements there is now some hope that regulatory changes may improve the relative position of specialist lenders and challenger banks in comparison to the large incumbents.
Competitive behaviour could intensify potentially narrowing interest margins and loan growth but the diversification of STB’s loan portfolio is a positive factor here and, as noted above, management is prepared to step back rather than risk capital for inadequate returns.
Exhibit 18: Financial summary
Year end 31 December |
2014 |
2015 |
2016 |
2017e |
2018e |
£m except where stated |
|||||
Profit and loss |
|||||
Net interest income |
49.2 |
78.9 |
103.7 |
125.3 |
152.2 |
Net commission income |
14.5 |
13.2 |
14.5 |
15.7 |
16.1 |
Total operating income |
63.7 |
92.1 |
118.2 |
141.0 |
168.3 |
Total G&A expenses (exc non-recurring items below0 |
(37.5) |
(50.5) |
(65.5) |
(74.7) |
(80.3) |
Operating profit pre impairments & exceptionals |
26.2 |
41.6 |
52.7 |
66.3 |
88.0 |
Impairment charges on loans |
(8.7) |
(16.8) |
(27.7) |
(34.3) |
(38.8) |
Other income |
0.0 |
0.0 |
0.0 |
0.0 |
0.0 |
Operating profit post impairments |
17.5 |
24.8 |
25.0 |
32.0 |
49.2 |
Non-recurring items |
0.0 |
0.0 |
0.0 |
0.0 |
0.0 |
Pre-tax profit |
17.5 |
24.8 |
25.0 |
32.0 |
49.2 |
Corporation Tax |
(3.6) |
(5.5) |
(6.3) |
(6.2) |
(8.7) |
Tax rate |
20.6% |
22.2% |
25.2% |
19.5% |
17.7% |
Bank tax surcharge |
0.0 |
0.0 |
(0.0) |
(0.6) |
(1.9) |
Profit after tax - continuing basis |
13.9 |
19.3 |
18.7 |
25.2 |
38.6 |
Discontinued business |
6.6 |
9.4 |
118.8 |
0.0 |
0.0 |
(Loss)/profit for year |
20.5 |
28.7 |
137.5 |
25.2 |
38.6 |
Minority interests |
0.0 |
0.0 |
0.0 |
0.0 |
0.0 |
Net income attributable to equity shareholders |
20.5 |
28.7 |
137.5 |
25.2 |
38.6 |
Company reported pre-tax earnings adjustments |
7.2 |
(9.8) |
7.9 |
1.0 |
1.0 |
Reported underlying pre-tax earnings (ex discontinued 2015/16) |
33.3 |
26.7 |
32.9 |
33.0 |
50.2 |
Reported underlying earnings after tax and minorities |
26.1 |
20.8 |
25.1 |
26.0 |
39.4 |
Average basic number of shares in issue (m) |
16.7 |
18.2 |
18.5 |
18.5 |
18.5 |
Average diluted number of shares in issue (m) |
17.1 |
18.5 |
18.6 |
18.6 |
18.6 |
Reported diluted EPS (p) |
81.5 |
104.1 |
101.8 |
135.5 |
207.2 |
Underlying diluted EPS (p) |
155.8 |
114.3 |
137.7 |
140.8 |
213.1 |
Ordinary DPS (p) |
68.0 |
72.0 |
75.0 |
78.0 |
82.0 |
Special DPS (p) |
0.0 |
0.0 |
165.0 |
0.0 |
0.0 |
Net interest/average loans |
9.71% |
9.97% |
9.09% |
8.51% |
7.96% |
Impairments/average loans |
1.72% |
2.12% |
2.43% |
2.33% |
2.03% |
Cost income ratio |
58.9% |
54.8% |
55.4% |
53.0% |
47.7% |
Balance sheet |
|||||
Net customer loans |
622.5 |
960.6 |
1,321.0 |
1,623.8 |
2,200.0 |
Other assets |
159.8 |
286.8 |
189.0 |
286.5 |
328.7 |
Total assets |
782.3 |
1,247.4 |
1,510.0 |
1,910.3 |
2,528.7 |
Total customer deposits |
608.4 |
1,033.1 |
1,151.8 |
1,546.4 |
2,156.9 |
Other liabilities |
49.0 |
73.1 |
122.2 |
116.5 |
100.6 |
Total liabilities |
657.4 |
1,106.2 |
1,274.0 |
1,662.9 |
2,257.4 |
Net assets |
124.9 |
141.2 |
236.0 |
247.3 |
271.3 |
Minorities |
0.0 |
0.0 |
0.0 |
0.0 |
0.0 |
Shareholders' equity |
124.9 |
141.2 |
236.0 |
247.3 |
271.3 |
Reconciliation of movement in equity |
|||||
Opening shareholders' equity |
61.6 |
124.9 |
141.2 |
236.0 |
247.3 |
Profit in period |
20.5 |
28.7 |
137.5 |
25.2 |
38.6 |
Other comprehensive income |
0.4 |
0.0 |
(1.8) |
0.0 |
0.0 |
Ordinary dividends |
(10.2) |
(12.6) |
(13.1) |
(13.9) |
(14.6) |
Special dividend |
0.0 |
0.0 |
(30.0) |
0.0 |
0.0 |
Share based payments |
0.5 |
0.2 |
0.2 |
0.0 |
0.0 |
Issue of shares |
53.3 |
0.0 |
2.0 |
0.0 |
0.0 |
Share issuance costs |
(1.2) |
0.0 |
0.0 |
0.0 |
0.0 |
Closing shareholders' equity |
124.9 |
141.2 |
236.0 |
247.3 |
271.3 |
Other selected data and ratios |
|||||
Period end shares in issue (m) |
18.2 |
18.2 |
18.5 |
18.5 |
18.5 |
NAV per share (p) |
687 |
776 |
1,277 |
1,339 |
1,468 |
Tangible NAV per share (p) |
641 |
738 |
1,229 |
1,290 |
1,420 |
Return on average equity |
22.4% |
21.6% |
72.9% |
10.4% |
14.9% |
Normalised return on average equity |
27.9% |
15.9% |
12.1% |
10.9% |
15.3% |
Average loans |
477.3 |
821.9 |
1,134.6 |
1,459.8 |
1,890.9 |
Average deposits |
499.7 |
827.9 |
1,067.5 |
1,332.3 |
1,824.9 |
Loans/deposits |
102.3% |
93.0% |
114.7% |
105.0% |
102.0% |
Risk exposure |
649.8 |
998.5 |
1,270.1 |
1,566.3 |
1,990.5 |
Common equity tier 1 ratio |
18.7% |
13.6% |
17.4% |
14.8% |
12.9% |
Source: Edison Investment Research, Secure Trust Bank data. Note: Profit on sale of ELG in April 2016 of £116.8m is included with the discontinued business line for FY16.
|
|||||||||||||||||||||||||||||||||||||||||||||||
|
|
While GFT reported FY16 revenues and EBITDA slightly ahead of our forecasts, the shares fell in response to unexpectedly weak FY17 guidance and higher than expected debt. The guidance reflected the challenging investment banking backdrop, which has been holding back profits in the UK and North America. Nevertheless, GFT’s retail banking activities remain buoyant, benefiting from digital banking projects in continental Europe, and management expects group growth to return to trend levels from FY18 on digitisation strength and recovering investment banking markets. Hence, we believe the shares look attractive on c 14x our FY18 earnings.