Last close As at 05/08/2026
—
— 0.00 (0.00%)
Market capitalisation
—
Research: Investment Companies
HBM Healthcare Investments (HBMN) reported profits of CHF72m for the third quarter of its financial year, buoyed by the takeover of long-term holding Advanced Accelerator Applications (AAA). The Switzerland-based fund invests globally in public and private healthcare companies and private equity funds, and is working to build its private company exposure back up towards long-term average levels following a strong period of IPOs and trade sales. The managers take a risk-aware approach to what can be a volatile sector, and have been taking profits on the back of clinical successes, as well as hedging c 20% of the listed equity exposure through a short position in an ETF tracking the NASDAQ Biotechnology index. The discount to NAV has narrowed in line with the general trend for investment companies, but remains wider than those of peers whose sole or main focus is listed equity markets. HBMN’s shares currently yield 4.3%.
Written by
HBM Healthcare Investments |
Positive developments for private/public fund |
Investment companies |
14 February 2018 |
Share price/discount performance
Three-year performance vs index
Gearing
Analysts
|
|||||||||||||||||||||||||||||||||||||||||||||||||||||||||||||||||||||||||||||||||
HBM Healthcare Investments (HBMN) reported profits of CHF72m for the third quarter of its financial year, buoyed by the takeover of long-term holding Advanced Accelerator Applications (AAA). The Switzerland-based fund invests globally in public and private healthcare companies and private equity funds, and is working to build its private company exposure back up towards long-term average levels following a strong period of IPOs and trade sales. The managers take a risk-aware approach to what can be a volatile sector, and have been taking profits on the back of clinical successes, as well as hedging c 20% of the listed equity exposure through a short position in an ETF tracking the NASDAQ Biotechnology index. The discount to NAV has narrowed in line with the general trend for investment companies, but remains wider than those of peers whose sole or main focus is listed equity markets. HBMN’s shares currently yield 4.3%.
12 months ending |
Share price |
NAV |
MSCI World Health Care (%) |
NASDAQ Biotech (%) |
FTSE All-Share |
31/01/14 |
58.6 |
81.8 |
28.0 |
68.5 |
13.5 |
31/01/15 |
34.5 |
25.8 |
22.6 |
33.4 |
(0.6) |
31/01/16 |
8.1 |
13.6 |
7.4 |
(7.2) |
0.3 |
31/01/17 |
11.5 |
3.1 |
0.1 |
0.6 |
2.5 |
31/01/18 |
42.7 |
16.1 |
17.3 |
16.8 |
18.5 |
Source: Thomson Datastream. Note: All % on a total return basis in Swiss francs.
Investment strategy: Long-term, risk-aware approach
HBM Partners’ investment professionals, most of whom have scientific backgrounds, are organised into two teams covering private and public healthcare companies globally. The managers use their extensive networks to source investments in early- and later-stage companies and private equity funds, diversified by clinical focus and geography. Many of the holdings in the public portfolio began as investments in private companies. Short positions may be used as a means of mitigating volatility in the listed portfolio.
Market outlook: Strong foundations but volatility likely
The fundamental outlook for the healthcare sector is underpinned by positive demographics, scientific innovation and an accommodative regulatory environment, yet as an equity market it can be volatile, with generalist investors in particular being apt to exit the sector in numbers during periods of risk aversion. However, while the near-term picture is uncertain, healthcare and biotech stocks have historically rewarded investors well over the long term.
Valuation: Discount tighter, but still wider than peers’
At 12 February 2018, HBMN’s shares traded at a 14.5% discount to the 31 January net asset value. This is significantly narrower than both short- and longer-term averages (a range of 21.0% to 29.2% over one, three, five and 10 years) and is only modestly wider than an all-time low of 9.6% reached at the end of January 2018, but still represents an appreciable discount to peers. HBMN has adopted a high distribution policy and the shares currently yield 4.3%.
HBM Healthcare Investments is a research client of Edison Investment Research Limited
Exhibit 1: Company at a glance
Investment objective and fund background |
Recent developments |
||||||||||||||||||||||||||||||||||||||||||||||||||||||||||||||||||||||
HBM Healthcare Investments (formerly HBM BioVentures, renamed in 2012) is a Swiss investment company that aims to generate long-term capital gains by investment in private and public companies in the human medicine, biotech, medtech and diagnostic sectors, and related areas. It invests worldwide, predominantly in later-stage private companies, either directly or through funds, and publicly listed holdings, many of which began as private equity investments. |
■ 29 January 2018: Successful IPO of portfolio company ARMO BioSciences, in which HBMN retains a holding of c 5.3%. Shares rose 75% on the first day of trading. The IPO made a +1.7% contribution to HBMN’s NAV per share. ■ 25 January 2018: Results for the third quarter of FY18 (to 31 December). NAV per share +8.2% and share price +24.9%. Half of the CHF72.0m quarterly profit came from the takeover bid for largest holding AAA by Novartis. ■ 5 December 2017: Listed Australian biotech firm CSL announces strategic partnership with private HBMN holding Vitaeris, with option to acquire. |
||||||||||||||||||||||||||||||||||||||||||||||||||||||||||||||||||||||
Forthcoming |
Capital structure |
Fund details |
|||||||||||||||||||||||||||||||||||||||||||||||||||||||||||||||||||||
AGM |
June 2018 |
Ongoing charges |
1.5% |
Group |
HBM Partners |
||||||||||||||||||||||||||||||||||||||||||||||||||||||||||||||||||
Annual results |
1 June 2018 |
Net gearing |
1.3% |
Manager |
Team managed |
||||||||||||||||||||||||||||||||||||||||||||||||||||||||||||||||||
Year end |
31 March |
Annual mgmt fee |
0.75% NAV + 0.75% market cap |
Address |
Bundesplatz 1, |
||||||||||||||||||||||||||||||||||||||||||||||||||||||||||||||||||
Dividend paid |
June |
Performance fee |
Yes (see page 7) |
||||||||||||||||||||||||||||||||||||||||||||||||||||||||||||||||||||
Launch date |
July 2001 (listed Feb 2008) |
Fund life |
Indefinite |
Phone |
+41 41 710 75 77 |
||||||||||||||||||||||||||||||||||||||||||||||||||||||||||||||||||
Continuation vote |
No |
Loan facilities |
CHF100m bond issue |
Website |
|||||||||||||||||||||||||||||||||||||||||||||||||||||||||||||||||||
Dividend policy and history (financial years) |
Share buyback policy and history (financial years) |
||||||||||||||||||||||||||||||||||||||||||||||||||||||||||||||||||||||
From FY13 HBMN has followed a policy focused on shareholder value, whereby c 3-5% is returned to shareholders annually as a capital distribution (5-8% total return of capital including buybacks), subject to portfolio performance and liquidity. |
HBMN buys back shares in the market to help manage its discount. Its current buyback programme began in October 2016. The FY15 figure includes an issue of put options, which saw an additional 564,897 shares repurchased. |
||||||||||||||||||||||||||||||||||||||||||||||||||||||||||||||||||||||
|
|
||||||||||||||||||||||||||||||||||||||||||||||||||||||||||||||||||||||
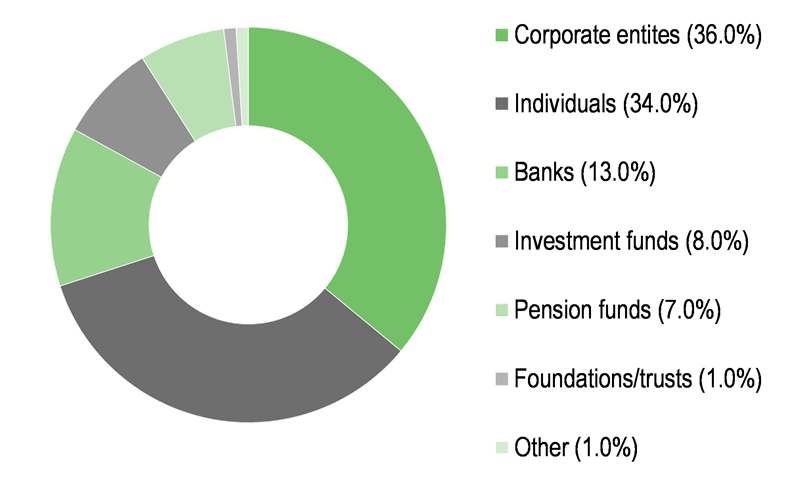
Shareholder base (as at 31 December 2017) |
Portfolio exposure by investment type (as at 31 December 2017) |
||||||||||||||||||||||||||||||||||||||||||||||||||||||||||||||||||||||
|
|
||||||||||||||||||||||||||||||||||||||||||||||||||||||||||||||||||||||
Top 10 holdings (as at 31 December 2017) |
|||||||||||||||||||||||||||||||||||||||||||||||||||||||||||||||||||||||
|
|||||||||||||||||||||||||||||||||||||||||||||||||||||||||||||||||||||||
Source: HBM Healthcare Investments, Edison Investment Research, Bloomberg, Morningstar. Note: *N/A where not in December 2016 top 10. **Originally held in private portfolio. ***Private company.
Market outlook: Be more selective amid volatility
There are many structural drivers underpinning the growth of the global healthcare sector. Ageing populations worldwide are leading to rising demand for healthcare services, while greater understanding of disease processes is increasing the pace of scientific innovation, and a more accommodative regulatory regime is helping to get new treatments to market. However, developing innovative drugs is a risky business with a high likelihood of clinical failure, and even those treatments that can prove their efficacy may struggle for success in an environment where healthcare systems are keenly focused on cost. With investors having done very well out of the sector in recent years (in Swiss franc terms the MSCI World Health Care index has returned c 100% over five years, while the NASDAQ Biotechnology index total return is 145% over the same period), there is a risk that those with a less specialist focus may exit the sector in the current period of volatility, leading to widespread share price falls. However, positive clinical data should continue to be well received by those who know how to interpret it, and investors who seek to access the sector may prefer to do so via a specialist fund whose managers have the scientific and financial expertise to identify the likely winners.
Fund profile: Diversified private/public portfolio
HBM Healthcare Investments (HBMN) was set up in 2001 as HBM BioVentures, and has been listed on the SIX Swiss Exchange since February 2008. Managed by HBM Partners in Zug, Switzerland, it was initially a biopharmaceutical-focused private equity fund, but has evolved into a portfolio of private and public companies and private equity funds, diversified by geography and across healthcare sectors. Many of the listed companies in the portfolio began as private holdings.
The fund uses the MSCI World Health Care index as a reference benchmark, although the index is not directly comparable, as the HBMN portfolio includes a significant proportion of unlisted investments. Short positions may be used as a hedge against risk (currently a short position in an ETF tracking the NASDAQ Biotechnology index is equivalent to c 20% of the listed portfolio). While investing principally for capital growth, HBMN has a high distribution policy as a means of rewarding shareholders and limiting the discount to NAV, and currently yields 4.3%.
The fund manager: HBM Partners
The manager’s view: Optimistic but remaining risk-aware
HBMN’s CEO, Andreas Wicki, and CFO, Erwin Troxler, note that after a strong period of IPOs and merger and acquisition (M&A) activity, the portfolio management team’s primary focus is on reinvigorating the private portfolio. In 2017, the team made 12 new private investments totalling c CHF100m, and expect a similar level of new investment in 2018. As time goes by, there will also be follow-on financing rounds for these investments, giving a clear path to increase the private equity allocation. The investment approach is relatively cautious, as illustrated by AnaptysBio, now just outside the top 10 holdings. When HBMN first invested in 2015, paying c CHF7m for 940,000 shares, AnaptysBio was still at a relatively early stage in developing its technology platform for antibodies in the inflammatory disease and immuno-oncology fields. At its IPO in January 2017, the stake was valued at c CHF17m, and ended FY17 (31 March) with a valuation of CHF26m. As positive newsflow continued throughout the year, HBMN de-risked the investment by reducing its stake, and at 31 December 2017 it held 229,000 shares valued at CHF22.5m. We calculate that in addition to this remaining stake of more than three times the initial investment, HBMN has taken profits of c CHF22m.
Further expected catalysts for the portfolio in the year ahead include Phase III data readouts for major public holdings Neurocrine Biosciences (Elagolix for uterine fibroids) and Esperion Therapeutics (multiple trials in lowering cholesterol), and Phase IIb data for ObsEva (endometriosis), which the managers argue is significantly undervalued, as well as possible IPOs for Cathay Industrial Biotech and Harmony Biosciences. ARMO BioSciences went public in late January 2018, and based on the ARMO share price at 9 February 2018, HBMN’s total investment of $22.2m (1.57m shares) was valued at $65.2m. Troxler and Wicki also argue that the US tax reforms could accelerate the pace of M&A activity in the healthcare sector, where takeover targets could include Neurocrine and Tesaro, as well as potential trade sales from the private portfolio.
In terms of the market backdrop, the managers see more challenging times ahead than in 2017, but argue that the combination of increased private holdings (where values are unaffected by equity market movements), and the market hedge on the public portfolio, mean the fund could perform relatively better than peers in a prolonged period of market volatility.
Asset allocation
Investment process: Blending clinical and financial analysis
HBM Partners’ investment professionals – most of whom have academic or professional backgrounds in life sciences – are organised into two teams, covering private and public companies. HBMN invests across both areas in companies across the spectrum of healthcare, from innovative biopharmaceuticals to generic drugs and medical devices. The teams meet weekly to share information on clinical and market developments.
The managers can draw on their own global industry networks, as well as external sources such as analysts and industry conferences, to generate investment ideas. The importance of private companies to the overall approach is clear: as well as making up 28% of the total portfolio (across direct investments and funds) at 31 December 2017, a further 18% of the listed portfolio (12% of the total portfolio) was in stocks that had been private companies at the point of investment. (This excludes Advanced Accelerator Applications, which was 14.8% of the total portfolio at 30 September, before it was bid for by Novartis.) Most private investments are valued at cost, giving significant upside potential in the event of a takeover or IPO, although valuations may be adjusted as a result of funding rounds or clinical data releases. Listed investment valuations are based on share prices and therefore may be more volatile than those in the private portfolio, although private companies, which are often at an earlier stage of development, may be higher-risk.
The managers take a long-term view, and turnover tends to be relatively low, although it will be higher for FY18 because of the takeover of AAA. Recent investment activity has mainly been focused on building up the private portfolio, which had decreased as a percentage of the total following a number of IPOs in recent years. The portfolio is diversified by geography, clinical focus and development stage, as well as by investment type. Funds may be used to gain exposure to areas such as Asia, where it may be harder for the managers to assess individual companies.
Given the high proportion of the portfolio currently in listed investments, HBMN has taken a short position in an ETF tracking the NASDAQ Biotechnology index, in order to hedge out some of the market risk. This was equivalent to 19.3% of the public portfolio at 31 December 2017, and, while it has been a relative detractor in performance terms while equity markets have been strong, it should provide some downside protection if the current market volatility continues.
Current portfolio positioning
At 31 December 2017, HBMN’s portfolio was 60% invested in public companies (of which c 20% was hedged), 18% in private companies and 10% in funds, with 12% in cash and other assets. Private companies have made up on average 15% of the total over the past five years, compared with 40% for the previous 11 years since the strategy began, and HBMN’s managers are working to build the proportion back up, after several years of a buoyant IPO market in which many holdings have gone from private to public. In the past year, 12 new private investments have been made, totalling CHF100m, in a mixture of venture and later-stage, riskier and de-risked companies.
Exhibit 2: Portfolio sector positions (% unless stated)
Portfolio end-December 2017 |
Portfolio end-December 2016 |
Change (pp) |
|
Oncology |
22.0 |
29.0 |
(7.0) |
CNS disorders |
14.0 |
7.0 |
7.0 |
Metabolic diseases |
12.0 |
7.0 |
5.0 |
Respiratory diseases |
11.0 |
15.0 |
(4.0) |
Autoimmune diseases |
6.0 |
N/S |
N/A |
Medtech/diagnostics |
5.0 |
7.0 |
(2.0) |
Pain |
5.0 |
5.0 |
0.0 |
Infectious diseases |
4.0 |
5.0 |
(1.0) |
Others |
21.0 |
25.0 |
(4.0) |
100.0 |
100.0 |
Source: HBM Healthcare Investments, Edison Investment Research. Note: N/S – not separately stated; may be included in ‘other’.
The portfolio is well diversified by clinical focus (Exhibit 2), with the reduction in oncology compared with 12 months previously being partly a result of the takeover of AAA. The increase in central nervous system (CNS) disorders is partly as a result of the new investment in private US company Aptinyx. Exposure to respiratory diseases has fallen mainly as a result of share price declines at the largest holding, Vectura, although HBMN’s managers remain confident that its generic version of asthma medication Advair will be approved by the FDA, although later than initially expected.
|
Exhibit 3: Portfolio breakdown by stage and currency as at 31 December 2017 |
|
Portfolio analysis by stage* |
Portfolio by region/currency |
|
|
|
Source: HBM Healthcare Investments, Edison Investment Research. Note: *Classified by most advanced stage. |
|
The strategy of rebuilding the private portfolio has led to an increase in earlier-stage companies, with more in Phase II development (20% versus 9% at 31 December 2016), increasing the risk/reward profile of the portfolio. However, the larger recent investments in private companies, such as paediatric immunotherapy specialist Y-mAbs Therapeutics and Harmony Biosciences, are lower-risk as they have products that are already approved or awaiting approval following positive Phase III data.
Private equity funds are a smaller proportion of the whole than 12 months ago (10% from 14%), partly because of an increased pace of distributions from maturing funds. New commitments have been made to two China-focused funds, which HBMN’s managers say will give them intelligence on new deals in an interesting geographical area where they would always work with partners.
Performance: Positive from both public and private
|
Exhibit 4: Investment company performance to 31 January 2018, in CHF |
||||||||
Price, NAV and benchmark total return performance, one-year rebased |
Price, NAV and benchmark total return performance (%) |
|||||||
|
|
|||||||
|
Source: Thomson Datastream, Edison Investment Research. Note: Three and five-year and since inception as a listed fund (SI, 14 February 2008) performance figures annualised. |
||||||||
|
Exhibit 5: Share price and NAV total return performance (CHF), relative to indices (%) |
||||||||
|
One month |
Three months |
Six months |
One year |
Three years |
Five years |
SI |
|
Price relative to MSCI World Health Care |
6.5 |
12.8 |
17.8 |
21.7 |
36.5 |
85.6 |
(8.3) |
|
NAV relative to MSCI World Health Care |
(1.2) |
(0.1) |
4.7 |
(1.0) |
7.8 |
57.2 |
(17.0) |
|
Price relative to NASDAQ Biotech |
5.1 |
11.6 |
19.4 |
22.2 |
57.6 |
49.6 |
(44.0) |
|
NAV relative to NASDAQ Biotech |
(2.5) |
(1.3) |
6.1 |
(0.6) |
24.5 |
26.8 |
(49.3) |
|
Price relative to FTSE All-Share |
9.1 |
12.6 |
14.7 |
20.4 |
41.1 |
166.6 |
80.9 |
|
NAV relative to FTSE All-Share |
1.2 |
(0.3) |
2.0 |
(2.1) |
11.5 |
125.9 |
63.8 |
|
|
Source: Thomson Datastream, Edison Investment Research. Note: Data to end-January 2018. Geometric calculation. |
||||||||
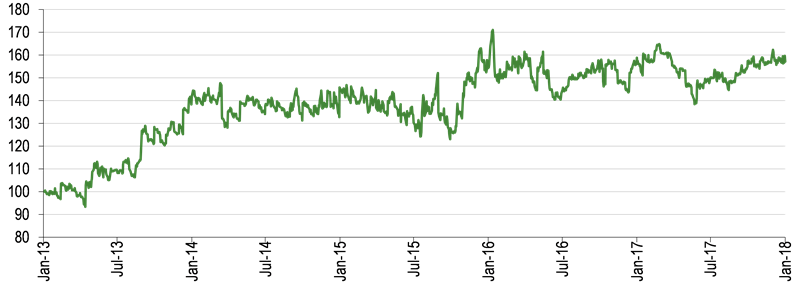
HBMN has seen particularly strong share price returns over 12 months to 31 January 2018 (Exhibit 4), with a total return of more than 40%. However, NAV returns have also been solid (c 10% pa over three years and 25% pa over five years), beating the MSCI World Health Care and NASDAQ Biotechnology indices over six months and three and five years, while underperforming marginally over one year. The largest contributor to recent strong performance was the $3.9bn takeover bid in October 2017 for the largest holding, AAA, by Novartis. HBMN first invested c CHF40m in the then private company in February 2014, and realised a profit of CHF200m on the takeover deal. Other contributors to recent performance include AnaptysBio (another former private holding), whose share price doubled in October 2017 as a result of positive clinical trial data in dermatitis, and Belgian immunotherapy company Argenx, up c 150% since December 2017, again on positive data. In the private portfolio, Vitaeris benefited from a tie-up with Australian company CSL, while the successful IPO of ARMO Biosciences also added to returns.
|
Exhibit 6: NAV performance relative to MSCI World Health Care in CHF over five years |
|
|
Source: Thomson Datastream, Edison Investment Research |
Discount: Close to record low as private equity rerates
At 12 February 2018, HBMN’s shares traded at a 14.5% discount to the 31 January NAV. This represents a significant narrowing from the long-term average level of c 20-30%, and is close to an all-time low. HBMN has tended to trade on a wider discount than peers (see Exhibit 8), probably as a result of its exposure to unlisted companies. However, discounts on private equity investment trusts as a whole have also narrowed appreciably over recent months, with the average for the AIC Private Equity sector (excluding 3i) standing at 15.5% at 12 February. The high distribution and share buyback policies have helped to limit discount volatility since they were introduced in FY13.
|
Exhibit 7: Share price discount to NAV (including income) over five years (%) |
|
|
Source: Thomson Datastream, Edison Investment Research |
Capital structure and fees
Structured as a closed-end investment company, HBMN is domiciled and listed in Switzerland. It has 7.0m shares in issue, excluding 78,710 treasury shares. During the first nine months of FY18 (to 31 December 2017), 104,210 shares were bought back into treasury, and 260,000 treasury shares were cancelled. Gearing is available through two CHF50m tranches of bonds.
HBM Partners, the portfolio manager, is paid an annual management fee equal to 0.75% of NAV plus 0.75% of market capitalisation. A performance fee of 15% of outperformance may also be paid if the year-end NAV is more than 5% above the high water mark, which is the NAV per share at the point at which a performance fee was last paid (currently CHF152.62). Based on performance for the first nine months of FY18, a provision has been made for a performance fee of CHF11.6m. We calculate ongoing charges for FY17 (excluding the performance fee, which was equivalent to 2.0% of NAV) to be 1.5%, compared with 1.6% for FY16.
Dividend policy and record
In common with many of its peers, HBMN has recognised the appeal of paying an income to its investors, and has adopted a high distribution policy, under which it returns 5-8% of NAV each year through a combination of cash distributions and share buybacks. Because healthcare and biotech companies in general are not high yielding but may offer significant capital appreciation, the fund’s distributions are funded mainly out of capital rather than revenue. Distributions are paid once a year in June. The FY17 distribution of CHF5.80 (3.7% of the year-end NAV per share) was 5.5% higher than the CHF5.50 paid in respect of FY16 and FY15, and represents a dividend yield of 4.3% based on the current share price.
Peer group comparison
In Exhibit 8 below, we compare the performance in Swiss franc terms of the members of the AIC’s specialist Biotech & Healthcare sector, as well as HBMN, Swiss biotechnology specialist BB Biotech, and Woodford Patient Capital Trust, which is a member of the AIC UK All Companies sector but has a high weighting (c 67%) in healthcare and holds both unquoted and quoted companies. HBMN’s NAV total return performance is above average over one, three and five years, ranking second, first and first respectively. Because it invests in private companies, which are valued infrequently, the fund may underperform in strongly rising equity markets but do better in periods of volatility. HBMN’s dividend yield is the second highest, yet it trades at appreciably the widest discount to NAV. Gearing is below average. HBMN has the highest ongoing charges in the group, reflecting the extra resource needed for private equity investment. In common with most peers, a performance fee may be paid.
Exhibit 8: Selected peer group as 12 February 2018*, in CHF terms
% unless stated |
Market cap CHFm |
NAV TR |
NAV TR |
NAV TR |
Ongoing charge |
Perf. |
Discount (ex-par) |
Net |
Dividend yield (%) |
HBM Healthcare Investments |
1,041.0 |
16.7 |
36.9 |
213.1 |
1.5 |
Yes |
(15.1) |
101 |
4.2 |
BB Biotech |
3,940.1 |
11.3 |
16.5 |
204.2 |
1.1 |
No |
6.2 |
103 |
4.1 |
BB Healthcare |
287.0 |
6.5 |
-- |
-- |
1.0 |
No |
1.7 |
104 |
3.2 |
Biotech Growth |
409.3 |
3.1 |
(5.2) |
111.2 |
1.1 |
Yes |
(4.9) |
106 |
0.0 |
International Biotechnology |
215.9 |
0.6 |
7.9 |
127.0 |
0.9 |
Yes |
(3.7) |
100 |
4.6 |
Polar Capital Glbl Healthcare |
236.9 |
2.6 |
5.0 |
49.7 |
1.1 |
Yes |
(3.3) |
100 |
1.8 |
Syncona |
1,305.4 |
22.7 |
21.8 |
38.7 |
1.5 |
No |
31.9 |
100 |
1.1 |
Woodford Patient Capital Trust |
650.0 |
(4.9) |
-- |
-- |
0.2 |
Yes |
(9.3) |
120 |
0.0 |
Worldwide Healthcare |
1,185.0 |
9.1 |
21.7 |
126.5 |
0.9 |
Yes |
(0.3) |
106 |
0.9 |
Weighted average |
11.1 |
19.0 |
157.4 |
1.1 |
4.4 |
104 |
3.1 |
||
HBMN rank in peer group |
4 |
2 |
1 |
1 |
1 |
9 |
6 |
2 |
Source: Morningstar, Edison Investment Research. Note: *Performance data to 8 February 2018. TR=total return. Net gearing is total assets less cash and equivalents as a percentage of net assets (100 = ungeared).
The board
HBMN has six independent, non-executive directors. Hans Peter Hasler, the chairman, joined the board in 2009 and previously worked at Wyeth and Biogen. Vice-chairman Dr Heinz Riesenhuber was a German MP from 1976 to 2017 and is a former minister for scientific research. He has served on HBMN’s board since its launch in 2001. Dr Rudolf Lanz, a lawyer and corporate financier, has been a director since 2003. Robert A Ingram, former CEO and chairman of Glaxo Wellcome, was appointed in 2009, while the oncologist Dr Eduard E Holdener joined the board in 2009. The newest appointee, in 2012, was Mario G Giuliani, president and CEO of Italian healthcare firm Giuliani.
|
|
Research: Investment Companies
Deutsche Beteiligungs (DBAG) reported a 2.7% NAV return for the three months ended 31 December 2017, with the period characterised by a high level of transaction activity at existing portfolio companies. Two new management buyout investments alongside the DBAG ECF fund were completed after the quarter end, with DBAG investing a total of up to €9.1m in specialist aluminium and steel component manufacturer, Sjølund, and fibre optic network services provider, netzkontor nord. Management guidance for FY18 is unchanged, with net income expected to be above the five-year average and NAV return below the five-year average.