Last close As at 05/08/2026
—
— 0.00 (0.00%)
Market capitalisation
—
Research: Real Estate
Palace Capital has completed the previously announced £20m acquisition via a corporate deal, more than replacing rental income from disposals made in FY17. The new assets are fully let at a higher yield than our previous estimates. This leads us to raise our forecasts slightly and provides scope for rental and valuation uplifts in future, in line with Palace’s strategy of providing capital growth as well as stable income.
Written by
Palace Capital |
Portfolio growth |
Acquisition |
Real estate |
7 August 2017 |
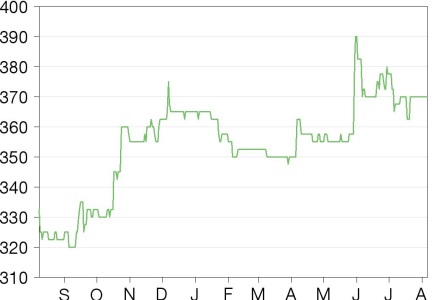
Share price performance
Business description
Next events
Analysts
Palace Capital is a research client of Edison Investment Research Limited |
|||||||||||||||||||||||||||||||||||||||||||||||||
Palace Capital has completed the previously announced £20m acquisition via a corporate deal, more than replacing rental income from disposals made in FY17. The new assets are fully let at a higher yield than our previous estimates. This leads us to raise our forecasts slightly and provides scope for rental and valuation uplifts in future, in line with Palace’s strategy of providing capital growth as well as stable income.
Year end |
Revenue (£m) |
Adj. EPRA earnings* (£m) |
Adj. EPRA EPS* (p) |
EPRA NAV/ |
P/EPRA NAV/ |
DPS |
Yield |
03/16 |
14.6 |
4.6 |
18.9 |
414 |
0.89 |
16.0 |
4.3 |
03/17 |
14.3 |
5.7 |
22.2 |
443 |
0.84 |
18.5 |
5.0 |
03/18e |
14.1 |
5.5 |
21.7 |
449 |
0.82 |
19.0 |
5.1 |
03/19e |
14.8 |
6.3 |
24.9 |
455 |
0.81 |
19.5 |
5.3 |
Note: *Adjusted EPRA earnings exclude revaluation gains, profits or losses on disposals of investment properties and surrender gains on early lease terminations.
High-quality assets at an attractive price
The company Palace has acquired owns a mixed-use, modern, office, residential, hotel and retail development in central Newcastle, with two floors of a multi-storey car park as well. The new assets’ annual rental income of £1.765m represents a net initial yield of 8.6% on the £20m acquisition price after costs, which compares well with the rest of the portfolio at c 7.5% on average. It is expected that the next speculative office development in Newcastle will not be ready for two years, and occupier demand has been strong in recent months – favourable dynamics for rental markets in the area.
Executing the investment strategy
The acquisition aims to fulfil both Palace’s aims of providing capital value increases and a rising dividend supported by a stable rental portfolio. There is potential for increased rents, with current rates c 15% below prime rates for Newcastle offices according to local property consultants, which, if achieved, could lead to higher valuations too. The 8.6% yield may also come down if investor demand in the regions rises; London offices are widely expected to lose value over the next two to three years and investors may seek income-producing assets in areas where higher yields provide attractive returns, protection from cyclical changes in the property market and less exposure to Brexit-related risks. Finally, following the disposal of £12.6m of assets in FY17 (including a £3.4m valuation gain), the new investment also shows Palace’s ability to recycle capital efficiently, with the new income more than offsetting rent on the properties sold.
Valuation: Unrecognised value
Palace’s 17% discount to 31 March 2017 EPRA NAV of 443p is well above the peer average (4% discount) and seems high even allowing for development risk on some of its assets. High yields and the regional focus provide some risk protection and the 19p FY18e dividend (5.1% yield) may add to the shares’ attraction. Our forecasts indicate 1.28x cover in FY19, or possible scope for a higher distribution.
Acquisition summary
Palace had already announced in its update on 2 May 2017 that it was negotiating a £20m acquisition and the news released today adds further detail. Palace has bought the entire share capital of SM Newcastle OB, a company that owns the freeholds of 1, 2 and 3 St James’s Gate, the adjacent Jury’s Inn (and a 125-year lease from October 2002 on the fourth and fifth floors of the Times Square Car Park), all near Newcastle Railway Station. The acquisition has been funded by a new loan from Santander of £11.5m and from the company’s existing cash resources.
The properties were developed by McAleer & Rushe from 2003 to 2006, which owns the company being acquired. They comprise a 274-bed hotel (the Jury’s Inn); 143,000 sqft of modern office space (1 and 2 St James’s Gate) and 145 apartments (3 St James’s Gate) above 16,500 sqft of commercial retail space, as well as a 635-space multi-storey car park on the other side of Railway Street, of which Palace has acquired the top two floors.
The hotel, the 61,000 sqft of offices in 1 St James’s Place and the residential element of 3 St James’s Place were already sold on 999-year leases when Palace bought SM Newcastle, but it still owns the freehold. Palace will receive rents from 2 St James’s Place and from the retail part of 3 St James’s Place. The former contains 82,500 sqft of offices, which are fully let to tenants including the National Lottery Charities Board, Eldon Insurance Services, Serco and UBS, for net income of £1.605m per annum. The retail space produces £0.16m of rent per annum, for total net rental income of £1.765m, a net initial yield of 8.6%.
The office rents equate to £19.45 per sqft, while Lambert Smith Hampton, a commercial property consultant, reports that prime office rents in Newcastle were £23 in Q217 and are expected to rise in 2017 due to a shortage of grade A supply. At full occupancy and with positive rental dynamics in Newcastle, the valuation outlook is also positive. While we have not assumed any yield contraction in our estimates, if the new assets were valued at a net initial yield of 7.5%, the valuation would rise by c £3m, or 11p a share.
Effects on estimates
We had already allowed for a £20m acquisition in our estimates but had only assumed a 7.5% net initial yield and 5% costs, so our net rental income figure has been adjusted upwards. We had assumed that the deal would be funded with £10m of new debt at Palace’s average cost of debt of 2.9% margin above Libor. We now assume that the new loan (£11.5m) is at 2.5% above Libor. As a result, our estimated interest expense is slightly increased, with an impact on earnings. We have also increased our 2019e dividend assumption in line with Palace’s progressive dividend policy which slightly affects NAV in that year.
Exhibit 1: Changes to estimates
Rental income (£m) |
Adjusted EPRA EPS (p) |
EPRA NAV per share (p) |
Dividend per share (p) |
|||||||||
Old |
New |
Change (%) |
Old |
New |
Change (%) |
Old |
New |
Change (%) |
Old |
New |
Change (%) |
|
03/18e |
14.0 |
14.1 |
0.5 |
21.4 |
21.7 |
3.2 |
449 |
449 |
0.2 |
19.0 |
19.0 |
0.0 |
03/19e |
14.7 |
14.8 |
0.3 |
26.6 |
24.9 |
(6.3) |
456 |
455 |
(0.3) |
19.0 |
19.5 |
2.6 |
Source: Edison Investment Research
The effects on our estimates can be seen in Exhibit 1. The increase in income flows through to higher earnings, which in turn have a small effect on NAV. We have not changed our dividend assumptions, but note that dividend cover has risen to 1.16x in FY18 and 1.45x in FY19, from 1.13x and 1.40x, respectively.
Valuation
Palace continues to trade at a discount to last reported EPRA NAV (443p) of c 17%, higher than most other investors in regional real estate. The average for the peer group is a 2% discount, which would put Palace at 436p per share, 18% above the current price. At that level the prospective dividend yield would still be an attractive 4.4% (currently 5.1%). This acquisition provides further evidence of management’s ability to find favourably-priced assets in good locations in the UK’s regional cities. As Palace’s track record extends and the portfolio grows, we would look for the discount to diminish to at least the peer average, and we would point to possible valuation gains from yield contraction, which is not included in our forecasts.
|
Exhibit 2: Listed regional property investors’ discounts to last reported NAV |
|
|
Source: Company data, Bloomberg. Prices at 2 August 2017 |
Exhibit 3: Financial summary
Year end 31 March |
£'000s |
2014 |
2015 |
2016 |
2017 |
2018e |
2019e |
|
PROFIT & LOSS |
IFRS |
IFRS |
IFRS |
IFRS |
IFRS |
IFRS |
||
Revenue |
|
|
3,252 |
8,637 |
14,593 |
14,266 |
14,082 |
14,755 |
Cost of Sales |
(648) |
(1,200) |
(1,624) |
(2,055) |
(1,540) |
(1,055) |
||
Gross Profit |
2,604 |
7,437 |
12,969 |
12,211 |
12,542 |
13,700 |
||
Administrative expenses |
(649) |
(1,439) |
(2,048) |
(2,915) |
(3,186) |
(3,425) |
||
Operating Profit before revaluation |
1,955 |
5,998 |
10,921 |
9,296 |
9,357 |
10,275 |
||
Revaluation of investment properties |
19,501 |
9,769 |
3,620 |
3,101 |
1,500 |
0 |
||
Costs of acquisitions/profits on disposals |
270 |
(461) |
(525) |
3,191 |
(1,000) |
0 |
||
Operating Profit |
21,725 |
15,306 |
14,016 |
15,588 |
9,857 |
10,275 |
||
Net Interest |
(573) |
(1,398) |
(2,264) |
(3,011) |
(3,074) |
(3,139) |
||
Profit Before Tax (norm) |
1,652 |
4,139 |
8,132 |
9,476 |
6,282 |
7,136 |
||
Profit Before Tax (FRS 3) |
21,153 |
13,908 |
11,752 |
12,577 |
6,782 |
7,136 |
||
Taxation |
81 |
107 |
(953) |
(3,191) |
(1,017) |
(1,070) |
||
Profit After Tax (norm) |
1,733 |
4,246 |
7,179 |
6,285 |
5,265 |
6,066 |
||
Profit After Tax (FRS 3) |
21,234 |
14,015 |
10,799 |
9,386 |
5,765 |
6,066 |
||
Deferred tax charge |
2,200 |
|||||||
Debt termination cost |
155 |
|||||||
EPRA earnings |
1,463 |
4,707 |
7,704 |
5,449 |
5,265 |
6,066 |
||
Adjusted for: |
||||||||
Surrender premium |
0 |
0 |
(3,172) |
237 |
0 |
0 |
||
Share-based payments |
0 |
114 |
110 |
0 |
200 |
200 |
||
Adjusted EPRA earnings |
1,463 |
4,821 |
4,642 |
5,686 |
5,465 |
6,266 |
||
Company adjusted PBT |
1,382 |
4,828 |
5,595 |
6,677 |
6,482 |
7,336 |
||
Average undiluted number of shares outstanding (m) |
5.3 |
17.1 |
24.6 |
25.7 |
25.2 |
25.2 |
||
EPS - normalised (p) |
|
32.9 |
24.8 |
29.2 |
24.4 |
20.9 |
24.1 |
|
EPS - FRS 3 (p) |
|
403.4 |
82.0 |
43.9 |
36.5 |
22.9 |
24.1 |
|
Adjusted EPS |
|
29.7 |
27.7 |
18.9 |
22.2 |
21.7 |
24.9 |
|
EPRA EPS (p) |
|
27.8 |
27.5 |
31.3 |
21.2 |
21.7 |
24.9 |
|
Dividend per share (p) |
0.0 |
13.0 |
16.0 |
18.5 |
19.0 |
19.5 |
||
Dividend cover (x) |
N/A |
2.12 |
1.96 |
1.14 |
1.14 |
1.28 |
||
BALANCE SHEET |
||||||||
Fixed Assets |
|
60,086 |
104,470 |
175,738 |
183,959 |
205,459 |
207,459 |
|
Investment properties |
59,440 |
102,988 |
174,542 |
183,916 |
205,416 |
207,416 |
||
Goodwill |
6 |
6 |
0 |
0 |
0 |
0 |
||
Other non-current assets |
640 |
1,475 |
1,196 |
43 |
43 |
43 |
||
Current Assets |
|
7,060 |
15,653 |
11,903 |
13,692 |
4,348 |
5,799 |
|
Debtors |
1,937 |
3,375 |
3,327 |
2,511 |
2,511 |
2,511 |
||
Cash |
5,123 |
12,279 |
8,576 |
11,181 |
1,837 |
3,288 |
||
Current Liabilities |
|
(4,171) |
(3,487) |
(9,048) |
(8,197) |
(8,197) |
(8,197) |
|
Creditors |
(2,971) |
(3,087) |
(6,815) |
(6,161) |
(6,161) |
(6,161) |
||
Short term borrowings |
(1,200) |
(400) |
(2,233) |
(2,036) |
(2,036) |
(2,036) |
||
Long Term Liabilities |
|
(18,599) |
(36,620) |
(71,778) |
(77,708) |
(88,678) |
(90,642) |
|
Long term borrowings |
(17,384) |
(35,407) |
(69,711) |
(75,758) |
(86,728) |
(88,692) |
||
Other long term liabilities |
(1,215) |
(1,214) |
(2,067) |
(1,950) |
(1,950) |
(1,950) |
||
Net Assets |
|
44,376 |
80,016 |
106,815 |
111,746 |
112,932 |
114,419 |
|
Net Assets excluding goodwill and deferred tax |
44,370 |
80,010 |
106,815 |
111,746 |
112,932 |
114,419 |
||
Basic NAV/share (p) |
219 |
395 |
414 |
434 |
440 |
446 |
||
EPRA NAV/share (p) |
219 |
396 |
414 |
443 |
449 |
455 |
||
CASH FLOW |
||||||||
Operating Cash Flow |
|
1,297 |
4,388 |
12,287 |
10,294 |
8,577 |
10,495 |
|
Net Interest |
(390) |
(1,593) |
(3,421) |
(2,516) |
(3,074) |
(3,139) |
||
Tax |
(13) |
(15) |
(158) |
(1,047) |
(1,017) |
(1,070) |
||
Preference share dividends paid |
(18) |
0 |
0 |
0 |
0 |
0 |
||
Net cash from investing activities |
2,532 |
(2,922) |
(50,012) |
(3,108) |
(20,020) |
(2,020) |
||
Ordinary dividends paid |
0 |
(1,766) |
(3,221) |
(4,617) |
(4,779) |
(4,779) |
||
Debt drawn/(repaid) |
(21,266) |
(10,600) |
21,272 |
5,861 |
10,970 |
1,964 |
||
Proceeds from shares issued |
23,009 |
19,664 |
19,114 |
29 |
0 |
0 |
||
Other cash flow from financing activities |
(66) |
(2) |
(2) |
(2,291) |
0 |
0 |
||
Net Cash Flow |
5,085 |
7,155 |
(4,141) |
2,605 |
(9,344) |
1,451 |
||
Opening cash |
|
39 |
5,123 |
12,278 |
8,576 |
11,181 |
1,837 |
|
Other items (including cash assumed on acquisition) |
0 |
0 |
439 |
0 |
0 |
0 |
||
Closing cash |
|
5,123 |
12,278 |
8,576 |
11,181 |
1,837 |
3,289 |
|
Opening net debt/(cash) |
1,724 |
13,476 |
24,742 |
65,435 |
68,563 |
88,877 |
||
Closing net debt/(cash) |
13,476 |
24,742 |
65,435 |
68,563 |
88,877 |
89,390 |
||
Source: Palace Capital data, Edison Investment research
|
|
SNP reported a 27% growth in H1 revenues, including 6% organic growth. While the growth was significantly lower than budgeted, management remains very buoyant, and activity has been picking up, with the book-to-bill ratio rising to 1.26 in Q2. The hyperactive acquisition strategy is based on the view that there is a potential tsunami of data migrations building up across the globe, particularly around SAP S/4HANA, with some 50,000 companies expected to upgrade to the new SAP ERP platform over the next few years. SNP’s goal is to be the global leader in software-based transformation projects and, following the recent correction, we believe the shares look increasingly attractive on c 16x our FY19e EPS.