Potential Chinese tariffs on US LNG and European concerns over the security of gas supply have the potential to alter forecast global gas flows materially. Growing US LNG exports were expected to make a significant contribution in meeting flourishing Chinese gas demand. However, we believe Trump’s trade war and a retaliatory Chinese LNG tariff could see US molecules redirected to other Asian consumers and the European market, a market looking to develop alternatives to Russian piped gas supply. It is difficult to quantify the precise impact of a potential tariff for US LNG on Liquefied Natural Gas Ltd’s (LNGL) valuation. Fundamentally, the impact is likely to be small as we assume fixed price tolling fee arrangements, but current rhetoric on tariffs is likely to be on the minds of project financiers and gas offtakers, potentially delaying project timelines. For now, we maintain our valuation at A$1.01/share (US$3.18/ADR). The political impasse between the US and China could push back first gas from our current 2024 forecast for Magnolia LNG.
Written by
Liquefied Natural Gas Ltd |
Political impacts on global gas trade |
Chinese LNG tariff |
Oil & gas |
15 August 2018 |
Share price performance
Business description
Next events
Analysts
Liquefied Natural Gas Ltd is a research client of Edison Investment Research Limited |
|||||||||||||||||||||||||||||||||||||||||||||||||||
Potential Chinese tariffs on US LNG and European concerns over the security of gas supply have the potential to alter forecast global gas flows materially. Growing US LNG exports were expected to make a significant contribution in meeting flourishing Chinese gas demand. However, we believe Trump’s trade war and a retaliatory Chinese LNG tariff could see US molecules redirected to other Asian consumers and the European market, a market looking to develop alternatives to Russian piped gas supply. It is difficult to quantify the precise impact of a potential tariff for US LNG on Liquefied Natural Gas Ltd’s (LNGL) valuation. Fundamentally, the impact is likely to be small as we assume fixed price tolling fee arrangements, but current rhetoric on tariffs is likely to be on the minds of project financiers and gas offtakers, potentially delaying project timelines. For now, we maintain our valuation at A$1.01/share (US$3.18/ADR). The political impasse between the US and China could push back first gas from our current 2024 forecast for Magnolia LNG.
Year end |
Revenue (A$m) |
PBT* |
Cash from operations (A$m) |
Net (debt)/ |
Capex |
06/16 |
7.3 |
(115.1) |
(117.1) |
67.2 |
(0.1) |
06/17 |
0.6 |
(29.2) |
(25.5) |
40.3 |
(0.4) |
06/18e |
0.3 |
(29.1) |
(21.7) |
45.6 |
0.0 |
06/19e |
0.0 |
(37.4) |
(29.6) |
(417.5) |
(319.7) |
Note: *PBT is normalised, excluding amortisation of acquired intangibles, exceptional items and share-based payments. We include all project debt on LNGL’s balance sheet and assume FID in late 2018.
China responds to Trump tariff talk
On Friday 3 August 2018, China responded to Trump’s tariff threats by adding US LNG to a list of imports subject to a potential 25% tariff. While the market’s immediate response was to dismiss this new tariff threat, citing an impending LNG supply deficit and options to re-route molecules to other Asian economies, we believe there is a risk that the current tariff war of words will affect the pace at which new US liquefaction projects are sanctioned. The imposition of trade tariffs on LNG is unlikely to faze IDG Energy (a 9.9% shareholder of LNGL) given its global multi-billion-dollar asset footprint, but could affect LNGL’s ability to leverage this relationship in the Chinese market.
Valuation: Waking up to potential LNG supply deficit
We maintain our valuation of A$1.01/share (US$3.18/ADR). We note that LNGL shares have performed strongly, up 90% over the last three months, reflecting positive commentary from the EU relating to US gas imports and an increasing acceptance of a potential LNG supply deficit beyond 2020. Significant uncertainty remains with regard to the timeline for project delivery for LNGL. However, with our 60% chance of success currently applied to Magnolia LNG, there is the potential for a material increase in valuation once tolling agreements are signed and FID has been taken.
Re-drawing global gas flows
China is the US’s third largest export market for LNG, importing 17.2bcf in 2016 and 103bcf in 2017. While it is too early to assume that China will act on its threat to add a 25% import tax to US LNG, crude oil flows suggest that the country is likely to take a robust stance in the face of perceived threats to the country’s US exports. China state oil major, Sinopec, has temporarily halted forward purchases of US crude oil while trade talks continue. Assuming tariffs on US gas exports into China make the trade route uncompetitive, we believe this will drive an increase in US gas flow into Europe and potentially act as a driver for the sanction of ‘Power of Siberia-2’, a major gas interconnector between Russia and China.
US LNG has export alternatives
US LNG is well placed to fill a forecast global LNG supply deficit beyond 2020, but exporters will likely have to find alternative destinations to the world’s fastest-growing gas market if Chinese tariffs are enacted. Assuming the introduction of a 25% import tax on US LNG into China makes trade uncompetitive, US gas molecules will likely be re-routed to other large Asian consumers such as Japan, Korea and India with the potential for an increase in cargoes directed into Europe. Japan and Korea are among the top three LNG importers globally, but both are slow-growing, mature markets with declining populations. Europe, on the other hand, is keen to diversify sources of supply post-Putin’s re-election and recent spats with Moscow, but will have to contend with the fact that US LNG will likely come at a higher price than Russian sources.
|
Exhibit 1: LNG supply and demand forecast |
Exhibit 2: Non-EU imports of natural gas in 2017 |
|
|
|
Source: Royal Dutch Shell, Edison Investment Research |
Source: Eurostat, Edison Investment Research |
|
Exhibit 1: LNG supply and demand forecast |
|
|
Source: Royal Dutch Shell, Edison Investment Research |
|
Exhibit 2: Non-EU imports of natural gas in 2017 |
|
|
Source: Eurostat, Edison Investment Research |
Tariffs may drive delay in exporters securing offtake & finance
Discussion on tariffs has created uncertainty in the LNG sector, which we believe will feed through to the due diligence processes of potential long-term offtakers and project financiers. We see the risk to LNGL as further delays in the signing of tolling agreements and securing debt funding. We currently assume first gas from Magnolia in 2024, but if project FID is pushed into mid-2019 we are likely to revisit this assumption and first LNG from Magnolia could accelerate or be further delayed from our base case depending on FID timing.
China has gas import alternatives, but potentially at a higher price point
The expectation of growing volumes of US LNG into China came with the promise of lower domestic gas prices, prompting the industry to switch from coal-powered to gas-powered generation. Growth in China’s demand for gas is unlikely to change, but landed prices could be higher if tariffs are imposed. On the other hand, uncertainty over US LNG imports could come as a windfall for Russian piped supply and non-US LNG suppliers. Russia and China may look at collaboration beyond the China-Russia East-Route Natural Gas pipeline (Power of Siberia), a key supply route expected to be operational by the end of 2020 under a 38bcm pa 30-year contract. Pipelines under consideration from China to Russia include ‘Power of Siberia-2’ (formerly Altai) (30bcm pa) and the Sakhalin pipeline project, for which gas pricing and funding remain in negotiation.
|
Exhibit 3: LNG imports by country (2017) |
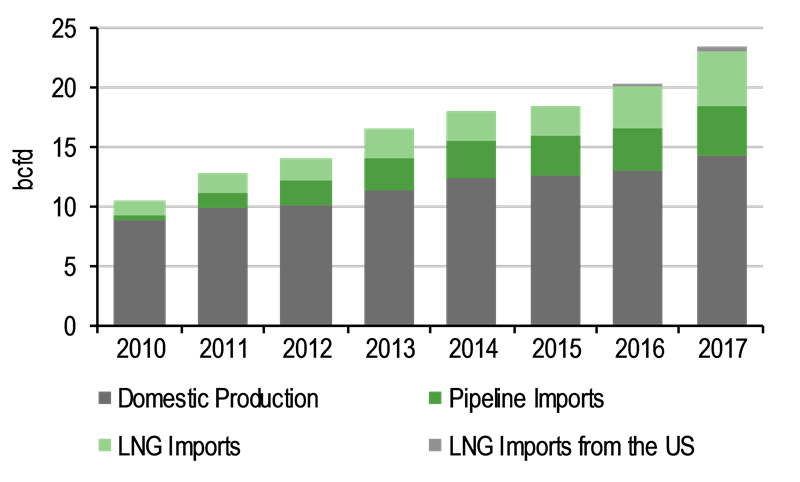
Exhibit 4: China natural gas supply (2010-17) |
|
|
|
Source: IGU, Edison Investment Research |
Source: EIA, Edison Investment Research |
|
Exhibit 3: LNG imports by country (2017) |
|
|
Source: IGU, Edison Investment Research |
|
Exhibit 4: China natural gas supply (2010-17) |
|
|
Source: EIA, Edison Investment Research |
Financials
Our financial forecasts continue to assume Magnolia LNG FID by the end of 2018. As mentioned earlier in this note, we feel there is a risk that this could slip into 2019.
LNGL’s current cash burn stands at c A$16m of annualised administration expense and c A$12m pa of project development expense. At end June 2018, LNGL had cash resources of A$50.7m, including additional funds raised in June of A$28.2m and cash burn is therefore now covered through to mid-2020. Management believes this is more than sufficient to progress Magnolia through to FID.
Exhibit 6: Financial summary
Accounts: IFRS, Year-end: June, A$m |
|
2013 |
2014 |
2015 |
2016 |
2017 |
2018e |
2019e |
|
Profit & Loss |
|
|
|||||||
Total revenues |
|
|
0.5 |
0.3 |
7.9 |
7.3 |
0.6 |
0.3 |
0.0 |
Cost of sales |
|
|
0.0 |
0.0 |
0.0 |
0.0 |
0.0 |
0.0 |
(2.5) |
Gross profit |
|
|
0.5 |
0.3 |
7.9 |
7.3 |
0.6 |
0.3 |
(2.5) |
SG&A (expenses) |
|
|
(2.7) |
(3.5) |
(8.1) |
(19.1) |
(13.4) |
(9.9) |
(10.1) |
R&D costs |
|
|
0.0 |
0.0 |
0.0 |
0.0 |
0.0 |
0.0 |
0.0 |
Other income/(expense) |
|
|
(11.3) |
(20.1) |
(71.9) |
(89.3) |
(14.0) |
(12.6) |
(17.1) |
Exceptionals and adjustments |
|
0.1 |
(0.5) |
(14.8) |
(14.3) |
(2.5) |
(7.0) |
(7.5) |
|
Depreciation and amortisation |
|
(0.1) |
(0.1) |
(0.1) |
(0.2) |
(0.2) |
(0.2) |
(0.2) |
|
Reported EBIT |
|
(13.6) |
(23.8) |
(86.9) |
(115.7) |
(29.6) |
(29.4) |
(37.5) |
|
Finance income/(expense) |
|
0.2 |
(0.8) |
0.6 |
0.6 |
0.4 |
0.2 |
0.1 |
|
Other income/(expense) |
|
0.0 |
0.0 |
0.0 |
0.0 |
0.0 |
0.0 |
0.0 |
|
Exceptionals and adjustments |
|
0.0 |
0.0 |
0.0 |
0.0 |
0.0 |
0.0 |
0.0 |
|
Reported PBT |
|
|
(13.4) |
(24.7) |
(86.3) |
(115.1) |
(29.2) |
(29.1) |
(37.4) |
Income tax expense (includes exceptionals) |
|
|
0.0 |
0.0 |
(0.1) |
0.0 |
(0.1) |
(0.0) |
0.0 |
Reported net income |
|
|
(13.4) |
(24.7) |
(86.3) |
(115.1) |
(29.3) |
(29.2) |
(37.4) |
Basic average number of shares, m |
|
|
267.7 |
333.9 |
464.4 |
503.2 |
513.0 |
541.9 |
570.1 |
Basic EPS (c) |
|
|
(0.0) |
0.0 |
(0.2) |
(0.2) |
(0.1) |
(0.1) |
(0.1) |
Adjusted EBITDA |
|
|
(13.6) |
(23.3) |
(72.0) |
(101.1) |
(26.8) |
(22.1) |
(29.7) |
Adjusted EBIT |
|
|
(13.7) |
(23.3) |
(72.1) |
(101.4) |
(27.0) |
(22.4) |
(30.0) |
Adjusted PBT |
|
|
(13.5) |
(24.1) |
(71.5) |
(100.8) |
(26.7) |
(22.1) |
(29.9) |
Adjusted EPS (c) |
|
|
(0.1) |
(0.1) |
(0.2) |
(0.2) |
(0.1) |
(0.0) |
(0.1) |
Adjusted diluted EPS (c) |
|
|
(0.1) |
(0.1) |
(0.2) |
(0.2) |
(0.1) |
(0.0) |
(0.1) |
BALANCE SHEET |
|
|
|||||||
Property, plant and equipment |
|
|
0.1 |
0.3 |
12.1 |
12.0 |
12.0 |
11.8 |
315.4 |
Goodwill |
|
|
0.0 |
0.0 |
0.0 |
0.0 |
0.0 |
0.0 |
0.0 |
Intangible assets |
|
|
0.0 |
0.0 |
0.0 |
0.0 |
0.0 |
0.0 |
16.0 |
Other non-current assets |
|
|
0.5 |
0.0 |
0.0 |
0.0 |
0.0 |
0.0 |
0.0 |
Total non-current assets |
|
|
0.6 |
0.3 |
12.1 |
12.0 |
12.0 |
11.8 |
331.4 |
Cash and equivalents |
|
|
1.6 |
47.8 |
47.0 |
67.2 |
40.3 |
45.6 |
0.0 |
Inventories |
|
|
0.0 |
0.0 |
0.0 |
0.0 |
0.0 |
0.0 |
0.0 |
Trade and other receivables |
|
|
0.0 |
0.3 |
2.5 |
0.7 |
0.1 |
0.3 |
0.3 |
Other current assets |
|
|
1.0 |
3.3 |
135.2 |
4.6 |
4.6 |
4.3 |
4.3 |
Total current assets |
|
|
2.6 |
51.4 |
184.6 |
72.6 |
45.0 |
50.1 |
4.6 |
Non-current loans and borrowings |
|
|
0.0 |
0.0 |
0.0 |
0.0 |
0.0 |
0.0 |
417.5 |
Other non-current liabilities |
|
|
0.3 |
0.2 |
0.2 |
0.1 |
0.0 |
0.0 |
0.0 |
Total non-current liabilities |
|
|
0.3 |
0.2 |
0.2 |
0.1 |
0.0 |
0.0 |
417.5 |
Trade and other payables |
|
|
1.1 |
3.4 |
13.9 |
2.6 |
2.2 |
2.1 |
2.1 |
Current loans and borrowings |
|
|
0.0 |
0.5 |
0.0 |
0.0 |
0.0 |
0.0 |
0.0 |
Other current liabilities |
|
|
0.3 |
0.0 |
1.0 |
0.9 |
0.4 |
0.3 |
0.3 |
Total current liabilities |
|
|
1.4 |
3.9 |
14.9 |
3.5 |
2.5 |
2.4 |
2.4 |
Equity attributable to company |
|
|
1.7 |
47.7 |
181.7 |
81.1 |
54.6 |
59.7 |
(83.9) |
Non-controlling interest |
|
|
(0.1) |
(0.1) |
(0.1) |
(0.1) |
(0.1) |
(0.1) |
(0.1) |
CASH FLOW STATEMENT |
|
|
|||||||
Profit for the year |
|
|
(13.4) |
(24.7) |
(86.3) |
(115.1) |
(29.3) |
(29.2) |
(37.4) |
Taxation expenses |
|
|
0.0 |
0.0 |
0.0 |
0.0 |
0.0 |
(0.0) |
0.0 |
Net finance expenses |
|
|
0.0 |
0.0 |
0.0 |
0.0 |
0.0 |
0.0 |
0.0 |
Depreciation and amortisation |
|
|
0.1 |
0.1 |
0.1 |
0.2 |
0.2 |
0.2 |
0.2 |
Share based payments |
|
|
(0.1) |
0.0 |
14.8 |
14.3 |
2.5 |
7.0 |
7.5 |
Other adjustments |
|
|
5.3 |
0.8 |
(7.4) |
(6.8) |
1.5 |
0.2 |
0.0 |
Movements in working capital |
|
|
0.4 |
2.0 |
8.9 |
(9.8) |
(0.4) |
0.0 |
0.0 |
Interest paid / received |
|
|
0.0 |
0.0 |
0.0 |
0.0 |
0.0 |
0.0 |
0.0 |
Income taxes paid |
|
|
0.0 |
0.0 |
0.0 |
0.0 |
0.0 |
0.0 |
0.0 |
Cash from operations (CFO) |
|
|
(7.7) |
(21.8) |
(70.0) |
(117.1) |
(25.5) |
(21.7) |
(29.6) |
Capex |
|
|
(0.0) |
(0.2) |
(11.6) |
(0.1) |
(0.4) |
0.0 |
(319.7) |
Acquisitions & disposals net |
|
|
0.0 |
0.0 |
0.0 |
0.0 |
0.0 |
0.0 |
0.0 |
Other investing activities |
|
|
2.4 |
(1.8) |
(131.7) |
130.6 |
0.0 |
0.1 |
0.0 |
Cash used in investing activities (CFIA) |
|
|
2.4 |
(2.0) |
(143.3) |
130.5 |
(0.4) |
0.1 |
(319.7) |
Net proceeds from issue of shares |
|
|
0.0 |
70.2 |
205.0 |
0.2 |
0.7 |
27.4 |
0.0 |
Movements in debt |
|
|
0.0 |
0.0 |
0.0 |
0.0 |
0.0 |
0.0 |
417.5 |
Other financing activities |
|
|
(0.0) |
(0.0) |
(0.0) |
(0.0) |
(0.0) |
(0.0) |
(113.7) |
Cash from financing activities (CFF) |
|
|
(0.0) |
70.2 |
205.0 |
0.2 |
0.7 |
27.4 |
303.8 |
Increase/(decrease) in cash and equivalents |
|
|
(5.3) |
46.4 |
(8.3) |
13.5 |
(25.3) |
5.7 |
(45.6) |
Currency translation differences and other |
|
|
0.0 |
(0.3) |
7.5 |
6.7 |
(1.6) |
(0.5) |
0.0 |
Cash and equivalents at end of period |
|
|
1.6 |
47.8 |
47.0 |
67.2 |
40.3 |
45.6 |
0.0 |
Net (debt) cash |
|
|
1.6 |
47.3 |
47.0 |
67.2 |
40.3 |
45.6 |
(417.5) |
Movement in net (debt) cash over period |
|
|
(5.3) |
45.7 |
(0.3) |
20.2 |
(26.9) |
5.3 |
(463.1) |
Source: Company accounts, Edison Investment Research. Note: *Assumes Magnolia LNG FID at the end of 2018.
|
|
Research: Financials
H118 results show Secure Trust Bank (STB) is making good progress in shifting its loan mix into lower risk segments and where pricing is more attractive. Despite being in a transition phase, STB delivered strong momentum in loans (22% YoY) and PBT (+38%). Concerns regarding these asset mix changes and the transition drag on earnings have probably contributed to recent share price weakness and the current valuation suggests there is room for rerating as STB continues to deliver successfully on its strategy.