Palm Hills Developments
Written by
Palm Hills Developments |
Strategy paying off |
Initiation of coverage |
Real estate |
28 April 2016 |
Share price performance
Business description
Next event
Analysts
Palm Hills Developments is a research client of Edison Investment Research Limited |
||||||||||||||||||||||||||||||||||||||||||||||||||||||||
Palm Hills (PHDC) has capitalised on a period of strong housing demand (which the recent devaluation continues to support) during the economic recovery since the 2011 revolution to accelerate development and grow sales. The balance sheet has been significantly strengthened since and the group is actively pursuing growth of its land bank following a period of optimisation. As operating cash flow improves, the company is investing in recurring revenue streams from commercial properties. Despite these positive developments, the share price has continued to lag the sector and it now trades at one of the lowest price-to-book ratios in the peer group.
Year |
Gross sales* |
Revenue |
EBIT |
NAV/share** |
P/B |
EPS** |
P/E |
12/14 |
3,936 |
2,126 |
402 |
2.73 |
0.93 |
0.26 |
9.9 |
12/15 |
6,322 |
3,602 |
613 |
2.73 |
0.93 |
0.60 |
4.2 |
12/16e |
7,422 |
4,280 |
1,022 |
2.86 |
0.89 |
0.28 |
9.1 |
12/17e |
7,563 |
4,318 |
970 |
3.07 |
0.83 |
0.21 |
12.2 |
Note: *Gross sales is a measure of the value of properties reserved by customers before cancellations. It is a lead indicator of P&L revenues. **Per share values adjusted for 1:20 bonus issue which is expected to take place on in Q2 2016.
Record results in 2015 and dividend
2015 saw strong further progress on gross sales (“reservations”), up 61% y-o-y, together with accelerated construction work and deliveries. Revenues grew 69%, net profits nearly tripled and EPS increased 135% y-o-y. The balance sheet was strengthened significantly and a dividend of EGP0.15 a share was paid on 7 April 2016 in the belief (consistent with our estimates) that operational cash flows are set to be on an improving trend. Management is optimistic about the current year, a view reinforced by strong demand for two recently launched projects.
Financial strength for sustainable growth
The Egyptian housing market is supported by favourable demographics and an improving economy. Palm Hills’ two most recently launched project phases have sold out quickly and price appreciation seen in 2015 has continued in Q1 2016. Recapitalised and strategically refocused, Palm Hills has accelerated development activity to bring forward revenues and profits and is building a recurring revenue base to reduce earnings volatility. The land bank is being replenished using co-developments to limit fixed cash outlays. Accelerated construction has weighed on cash flow, but we believe that increasing cash receipts from recent strong sales growth will enhance group cash inflows significantly.
Valuation: Significant unrecognised value
Palm Hills’ current share price is c 10% below FY15 NAV of EGP2.73/share. However, the land bank is held at cost and there is potential upside from future profits on development projects. Including a mark-to-market value for the land bank and hotels on management’s guidance gives an NAV of EGP4.54. We estimate that the NPV of future profits from residential developments and the Palm October Club could add a further EGP1.60, leading to a total potential value of EGP6.14/share.
Investment summary: Major Egyptian developer
Palm Hills develops and sells premium quality residential properties in new cities outside Cairo and upscale holiday homes for the domestic market on Egypt’s Mediterranean coast. It also operates a country club in West Cairo (Palm October Club); has a 60% interest in a JV with Accor, managing two hotels aimed at the domestic business market and one leisure hotel in Sharm El Sheikh; and is building retail and leisure facilities to serve its residential projects and to generate recurring income; Palm Hills also has the second-largest undeveloped land bank by area of its Egyptian peers.
Palm Hills is operating in a buoyant property market (discussed in detail on page 6): it reported record sales (“reservations”) for 2015 (EGP6.3bn gross) and management guides to a further increase in 2016 (EGP6.5-6.8bn gross) as a number of new projects are launched. The last two sales launches demonstrated the strength of demand: 95% of Capital Gardens’ first tranche sold out within two days and Palm Valley’s first tranche sold out within 48 hours for a total value of EGP491m. For the broader Egyptian market, long-term demographic and economic trends seem likely to support further growth in the residential property market.
Capital strengthening providing solid base for growth: Palm Hills’ capital and liquidity position has been significantly improved in the past two years. Equity issues in 2013 (EGP600m) and 2015 (EGP1,648m) were supported by the major shareholders and new third-party investors. Shareholders’ equity was EGP6,314m at the end of 2015 compared with EGP3,221m at the end of 2013. Net debt was EGP2,145m (35% of equity) at the end of 2015 compared with EGP1,189m (37%) at the end of 2013. This strengthening has enabled Palm Hills to accelerate construction and deliveries, renew its land bank and invest in sources of recurring income.
Improving cash flows and now dividend paying: Palm Hills has been profitable since 2013 and 2015 saw profit reach a record level at EGP1bn, although this included c EGP425m of non-recurring profits from the disposal of non-core land. Operating cash flow has continued to be negative during this period, not least because Palm Hills has accelerated its construction activity, bringing forward deliveries. As construction spend levels out and as new sales start to generate cash flow, we forecast pre-tax operating cash flow to be slightly positive in 2016 and grow significantly thereafter. Confident in its improving cash flow, Palm Hills has paid a dividend of EGP0.15/share in respect of 2015 and intends to distribute 30% of free cash flow. We interpret this as cash flow after land investments, making it more difficult to predict future dividend payments, although we note the trend to undertake new projects on a co-development basis, with revenue-sharing agreements displacing fixed land payments.
Building a recurring revenue stream: to complement the residential development and sales activities, Palm Hills plans to develop its recurring revenue streams, targeting a 25% share of profits from these sources by 2020, including commercial property, leisure and educational facilities. Currently these activities are relatively small (we estimate 2% of 2015 revenues) and include three hotels and a golf and country club. Four retail and office projects are under development and set to start producing income before 2019; several others are being planned.
Undemanding valuation: Palm Hills currently trades at around 1 x FY15 NAV of EGP 2.73/share, towards the lower end of the peer group. Within NAV, all development projects and undeveloped land are held at cost. Management estimates a potential market value of undeveloped residential land of EGP4.6bn against a carried value of EGP0.5bn, a potential uplift of EGP1.37/share after tax. On a similar basis, commercial land would add EGP0.37/share and hotels would be worth EGP0.07 more at replacement value. In addition, existing projects under development and the Palm October Club will generate profits over time, which should lift NAV. We estimate the NPV (based on a discount rate of 18%) of those profits (EBITDA after tax) to be EGP3.7bn or EGP1.60/share. More detail on our assumptions is given on page 16. The combined value of current NAV and the estimated market value of land bank and hotels give a mark-to-market NAV of EGP4.54, or EGP6.14 including the NPV of estimated future profits from residential projects.
Summary of 2015 results
Palm Hills produced record financial results in 2015 with strong progress on gross sales (“reservations”) and accelerated construction work and deliveries. The balance sheet was strengthened significantly during the year and management has paid a dividend of EGP0.15 a share in the belief (consistent with our estimates) that operational cash flows are set to be on an improving trend. We summarise the main features of the 2015 results below:
|
Exhibit 1: Gross sales and units delivered & forecast |
Exhibit 2: Total revenue and EBITDA (EGPm) |
|
|
|
Source: Company data, Edison Investment Research estimates |
|
Exhibit 1: Gross sales and units delivered & forecast |
|
|
Source: Company data, Edison Investment Research estimates |
|
Exhibit 2: Total revenue and EBITDA (EGPm) |
|
|
Source: Company data, Edison Investment Research estimates |
■
Reservations increased 61% to a record level of EGP6.3bn (Q4 +57% y-o-y to EGP1.7bn). Developments launched in both East Cairo and the North Coast during the year met strong demand, primarily as domestic buyers continue to head west and east and others seek secondary homes on the North Coast. The cancellation rate declined to 8.5% vs 9.2% in 2014.
■
Contracted sales in the year grew 49% to EGP4.4bn. Following the growth in reservations, contracted sales were EGP2.3bn in H215.
■
Revenues recognised at contract on land sales for standalone units and completions/deliveries of both standalone units and apartments increased by 69% to EGP3.5bn (2014 EGP2.1bn), again another record level. Accelerated construction spending (EGP1.9bn, up from EGP1.1 in 2014) saw a record 1,573 units delivered (2014: 981) during the year. Collections from outstanding receivables and new sales were EGP2.1bn in the year.
■
Gross profit was up 70% to EGP1.3bn (2014: EGP0.7bn) and the IFRS gross margin was 35.3% (35.2%). In Q4 the gross margin was 26.9%, affected by a higher share of apartment deliveries (typically lower margin that standalone units) and the fact that many of these had been sold at depressed prices during the more difficult 2011 and 2012 periods. Management indicates that this effect has now largely played out.
■
Selling and administrative expenses increased by 91% to EGP659.5m on an IFRS basis. Within this, marketing expenses increased 128% to EGP230m (2014: EGP101m) or 3.6% of gross reservations (2014: 2.6%). On an IFRS basis, the EBITDA margin was 17.6% (2014: 19.9%). On a GAAP basis, which treats cash-selling discounts as negative revenue rather than the IFRS treatment as cost, the EBITDA margin was 21.8% (2014: 23.8%). Net finance costs were a positive EGP14.2m versus negative EGP103.7m as a result of bank debt refinancing and declining land purchase liabilities. This left net attributable profit ahead by 192% at EGP1.031bn. This was more than twice the previous record earned in 2010, but includes EGP425m in non-core land sale profits.
■
Net debt stood at EGP2.1bn (gross debt of EGP3.0bn less cash of EGP0.85bn) or EGP1.5bn adjusted for marketable securities of EGP0.7bn. The pre-tax operating cash outflow was EGP2,249m, an increase from an outflow of EGP687m in 2014, primarily as a result of the accelerated construction spend. Given management’s expectation of improving cash flow, Palm Hills has paid a cash dividend of EGP0.15/share, and will implement a 1:20 bonus share issue, expected in Q216. Both were approved at the AGM on 13 March.
■
Adjusting for the 1:20 bonus share issue, attributable EPS increased from EGP0.257/share to EGP0.590/share (+135%). The increase in EPS lagged net attributable earnings as a result of the EGP1.648bn capital raise (865m shares, adjusted for the bonus issue, at a price of EGP2.0/share) in July 2015. Year-end shares on a similarly adjusted basis were 2.309bn and the average for the year was 1.705bn.
■
Attributable shareholders’ equity was EGP6.314bn at 31 December 2015 (2014: EGP3.868bn). The July 2015 capital increase accounts for EGP1.648bn of the increase. NAV/share remained level at EGP2.73 (adjusted for the bonus share issue) as the dilution was offset by gains on sales of land and profits during the year.
■
Building the recurring income portfolio to complement the residential development and sales activity has progressed with the completion of all construction works on the Street 88 strip mall, with 60% of the gross lettable area (GLA) pre-leased. An indicative interest in 70% of the GLA in the Phase 8 office building has been received, and construction is progressing as planned. Construction of the Village Gate and VGK malls in East Cairo is set to finish in 2016.
■
Replenishment of the land bank has continued with the addition of three projects via co-development agreements and a land plot adjacent to Hacienda Bay: the co-developments include Palm Hills’ largest project to date – 2.1m sqm in East Cairo for which the New Urban Communities Authority (NUCA) is providing the land; Smart Village in West Cairo, in conjunction with Reacap, an Egyptian investment bank; and a project undertaken alongside private landowners on the North Coast at Ras El Hekma.
■
In its outlook comment, the company says that it plans a number of pre-sales launches during 2016 and that it expects gross reservations of EGP6.5bn, deliveries of c 1,600 units and construction spending of c EGP2.0bn. The planned launches include Phase 2 of Palm Hills Katameya extension in Q116, as well as its 2.1m sqm co-development with NUCA in Q316. The company is exploring a number of land bank opportunities on the North Coast and hopes to conclude an agreement for the land in West Cairo during H116. A sale of the 5m sqm (51% owned) of land in Saudi Arabia, no longer core to the operations, remains a possibility. Management guides that this could realise proceeds of between EGP900m and EGP1.1bn and a net gain of c EGP0.32 per share after tax.
Company description: Prime residential specialist
Background
Palm Hills’ main activity is the design, development and sale of high-quality residential property in the Greater Cairo area and on Egypt’s Mediterranean coast. It identifies and acquires land, plans its development and sells properties off-plan using third-party contractors for construction. Palm Hills has a strategy to build its stream of recurring revenue and currently owns 60% of a JV with Accor (a major French hotel company), which owns three hotels in Egypt managed by Accor. It also runs a golf and country club adjacent to several of its West Cairo projects. Four commercial construction projects are also under development.
A group of investors formed the company in 1997 to develop a residential project in an area called 6th of October City, west of Cairo, in 1997, in line with the trend in Egypt for development to be outside existing urban centres, where profitable development is impeded by strict rent controls. The founders included Mansour Maghraby Investment and Development Company (MMID), a subsidiary of the Mansour Group, one of Egypt’s biggest conglomerates and controlled by the Mansour family. Yasseen Mansour has been chairman of Palm Hills since its foundation and MMID remains the largest single shareholder in Palm Hills with 42.5% of the outstanding shares. Architect Shehab Mazhar, an executive board member, was also a founder of the company. By the end of 2007, 12 residential projects had been launched and the Accor JV had been formed. Palm Hills was listed on the Cairo and Alexandria Stock Exchange in 2008 and global depositary receipts (GDRs) were admitted to trading on the London Stock Exchange at the same time. 12 more projects have been launched since the IPO in similar locations to their predecessors, bringing the total to 24 launched developments, with two more confirmed and set to launch in 2016 (Ras El Hekma and 500 feddans).
|
Exhibit 3: PHDC project areas (red) and hotels (green) |
Exhibit 4: Projects in Greater Cairo |
|
|
|
Source: Palm Hills, Google Maps, Edison Investment Research. Note: Map 1: 675km x 525km; Map 2: 90km x 70km. Readers with Google accounts can click on either map and open them to view project locations in detail. |
|
|
Exhibit 3: PHDC project areas (red) and hotels (green) |
|
|
|
|
Exhibit 4: Projects in Greater Cairo |
|
|
|
|
Source: Palm Hills, Google Maps, Edison Investment Research. Note: Map 1: 675km x 525km; Map 2: 90km x 70km. Readers with Google accounts can click on either map and open them to view project locations in detail. |
The Egyptian Revolution of 2011 had a major impact on the national economy and on the housing sector. New sales fell sharply and a large number of existing customer purchase contracts were cancelled. This reduced Palm Hills’ cash flows, prompting further cancellations as buyers feared the company might not be able to meet its fixed land purchase liabilities and deliver contracted units, exacerbating the problem. MMID continued to support Palm Hills throughout this challenging period with an interest-free loan. New equity capital was raised in 2013 (EGP600m) and 2015 (EGP1.65bn), in addition to an EGP2.4bn bank loan in 2014.
Strategy
Post-recapitalisation, Palm Hills has adopted a four-pillar strategy for growth: rationalise and grow the land bank, improve profitability, establish recurring income streams and accelerate deliveries of units. Having shed land plots to preserve liquidity, it set about optimising the remaining land bank, selling non-core plots and replenishing the land bank in its target areas of Greater Cairo and the North Coast. Greater emphasis is being given to co-developments that reduce initial cash outlay and future fixed land payment schedules. Improved liquidity has enabled the company to accelerate its construction programme, bringing forward revenue and profit recognition with the aim of completing all existing projects by the end of 2017. Meanwhile, Palm Hills is benefiting from improved selling prices and reports that land and built-up area prices rose 23% and 15% respectively in 2015. The creation of Palm Hills Investments in the last year is aimed at developing the commercial real estate strategy by deploying existing raw land (initially c 337ksqm or 1.4% of the portfolio). The target is for the commercial sector to contribute 25% of net profits by 2020, offsetting the inherent volatility in residential real estate earnings (in 2015 these activities contributed 2% of group revenues). The sectors targeted are shopping centres, office buildings, leisure, health, education and business and destination hotels.
Management and governance
Palm Hills has a substantial and long-serving in-house team, all of whom are locally based. Out of c 830 employees, there are 94 senior staff: directors, partners and development professionals including architects, engineers and surveyors. It also has a substantial sales platform with 107 sales and marketing staff. As noted above, MMID remains the largest shareholder with 42.5% and Yasseen Mansour, one of the three brothers who control Mansour Group, is Palm Hills’ chairman. Palm Hills has three CEOs who bring different areas of expertise to Palm Hills: Engineer Mohamed Ahmed Sultan was previously vice president for development, leading the Palm Hills’ North Coast projects, and took over in 2011. Co-CEO Tarek Abdel Rahman was previously the chief investment officer. He has extensive experience in investment banking and M&A. Architect Shehab Mazhar, a founding shareholder of the company, is the CEO for engineering and oversees the architectural, planning, urban design and landscaping of the company’s projects. The CFO, Ali Thabet, has been with Palm Hills since its foundation and previously ran his own financial consultancy business.
Other members of the 10-man board include Mohamed Mansour (a relation of the chairman), vice chairman of MMID and Hassan Darwish, a vice president of MMID; Timothy Collins, CEO of Ripplewood Holdings, a US private equity firm with more than $10bn in AUM including 2.5% of Palm Hills; Yasser El Mallawany, CEO of EFG Hermes and Youssef Medhat El Far, vice chairman of Naeem Holding, both leading MENA investment banks. An eleventh member has yet to be appointed, but will represent Aabar Investments, a subsidiary of Abu Dhabi’s state oil company, which bought a 5.1% stake in Palm Hills in November 2014.
Positive demographic support for residential market
Egypt has a large, growing population and high housing demand. Colliers estimates annual new demand for housing in Greater Cairo at 90-100k units a year and the Egyptian housing ministry expects annual population growth of 2m, generating demand for 0.5m new houses annually.1 Palm Hills competes at the high end of the market (on the North Coast as well as Greater Cairo), which Talaat Moustafa Group (TMGH), Egypt’s biggest residential developer, estimates at 5k units a year. Palm Hills’ main listed competitors are TMGH and Six of October Development and Investment Company (OCDI). Both companies build gated communities in Greater Cairo and holiday homes at the coast and have market capitalisations of c EGP13.7bn and c EGP3.6bn respectively (vs Palm Hills’ EGP5.6bn).
Khaled Abbas, Assistant Minister of Housing, quoted by Bloomberg, 27 March 2016.
Despite its large area, 95% of Egypt’s 90 million people live in 5% of its land, along the Nile, Suez Canal and the Mediterranean and Red Sea coasts. Cairo alone holds c 18 million people, as many as Libya, Jordan and Lebanon combined. The World Bank expects the population to double by 2050. Housing demand is likely to be concentrated around Cairo, where efforts to ease the pressure by building new satellite cities in the desert have been made since the 1970s. Many employers have moved out of Central Cairo to avoid congestion and take advantage of better infrastructure in newer satellite cities. These cities have in turn become very attractive to high-income households that have moved out of Central Cairo in large numbers, drawn by better amenities, less pollution and more space to support a better quality of life. These new cities now accommodate a number of universities, international businesses and retail and leisure facilities. Meanwhile, in older parts of the capital, rent control laws mean that contracts between tenants and landlords are automatically renewed annually at the same price and can be inherited by the relations of a tenant. These rent rules mean that the supply of high-quality new apartments in Central Cairo is very limited, because landlords have little incentive to upgrade accommodation and tenants have little incentive to move. As a result, there is a general trend for middle- and upper-income households to move out of Central Cairo and Palm Hills focuses on areas attractive to these households.
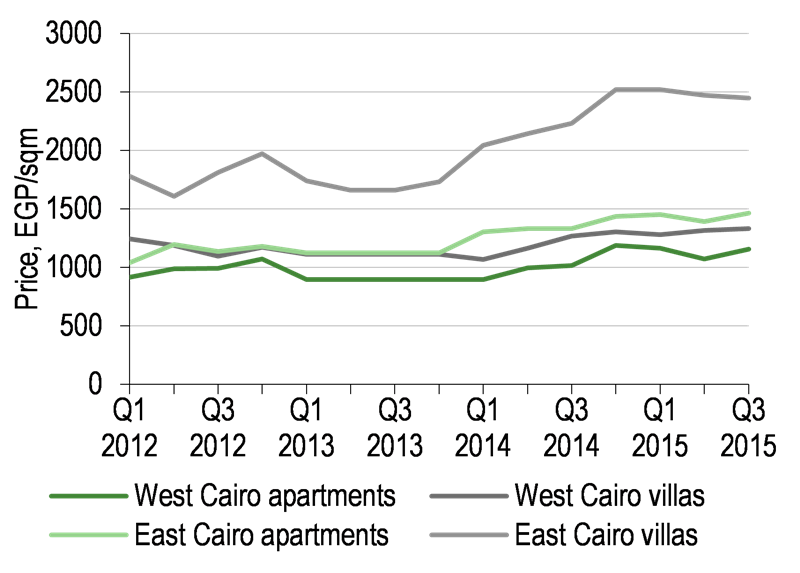
Colliers estimates that Egyptian households earning up to EGP510k can afford to buy houses worth up to EGP1.2m (2.4x income). Palm Hills’ least expensive studio flats sell for EGP1.3m, implying that it is targeting households with income over EGP540k. The Central Agency for Public Mobilization and Statistics’ (CAPMAS) figures imply that only 2.8% of households in Cairo earnt more than EGP100k in 2012/13 (Exhibit 5). The market appears strong in spite of this, as evidenced by pre-sales of Palm Hills’ Capital Gardens development and Palm Valley, mentioned on page 2. For the broad market, JLL (formerly Jones Lang LaSalle) has reported price increases of 7.4% CAGR in East and West Cairo from Q212 to date, somewhat below the price increases that Palm Hills has reported for its high-end developments.
|
Exhibit 5: Egyptian earnings brackets by % of households, EGP |
Exhibit 6: Greater Cairo property prices, EGP/sqm |
|
|
|
Source: CAPMAS 2012/13 survey, January 2014 |
Source: JLL, quarterly Cairo property market reviews |
|
Exhibit 5: Egyptian earnings brackets by % of households, EGP |
|
|
Source: CAPMAS 2012/13 survey, January 2014 |
|
Exhibit 6: Greater Cairo property prices, EGP/sqm |
|
|
Source: JLL, quarterly Cairo property market reviews |
Economic environment
The general economic environment is important to Palm Hills and the effects of the revolution on the economy were severe, damaging tourism and foreign investment, both major sources of foreign reserves and contributors to the economy in general. The economy has since been recovering and the IMF forecasts GDP growth of 3.26% in 2016, a reduction from 2015 partly due to spillover effects from Egypt’s oil-exporting regional neighbours (Exhibit 7).
Exhibit 7: Egypt and selected comparators, GDP growth per capita growth*
2009 |
2010 |
2011 |
2012 |
2013 |
2014 |
2015 |
2016e |
2017e |
2018e |
2019e |
2020e |
|
Egypt |
4.67 |
5.12 |
1.77 |
2.23 |
2.10 |
2.16 |
4.19 |
3.26 |
4.26 |
4.54 |
4.94 |
5.04 |
MENA |
2.25 |
5.16 |
4.57 |
5.05 |
2.11 |
2.58 |
2.34 |
2.94 |
3.30 |
3.39 |
3.59 |
3.71 |
UK |
(4.31) |
1.91 |
1.65 |
0.66 |
1.67 |
2.99 |
2.25 |
1.89 |
2.22 |
2.21 |
2.13 |
2.11 |
US |
(2.78) |
2.53 |
1.60 |
2.22 |
1.49 |
2.43 |
2.43 |
2.40 |
2.50 |
2.37 |
2.13 |
1.96 |
Source: IMF WEO April 2016. Note: *GDP at constant prices.
On 14 March 2016 the EGP was devalued by 14% to 8.878 against the US$, against which its value is managed (Exhibit 9) in order to maintain the economy’s competitiveness and ease pressure on foreign exchange reserves. The central bank subsequently increased its headline interest rate by 150bp to 11.25% and to 10.75% on overnight deposits. The EGX 30, the main local index, rose 7% on the day of the news and has maintained its gains since. Management believes that the economic turbulence of recent years, combined with capital controls and the expectation of high inflation, have to some extent encouraged people to invest in real estate as a safe store of value, as may be suggested by Exhibit 8 and by the successful launch of the Palm Valley project in March 2016, where EGP491m of units were reserved within 48 hours. The devaluation is expected to increase demand for real estate by increasing expectations of a further devaluation. There will also be an increase in input costs, particularly steel and cement, although this has yet to materialise.
|
Exhibit 8: Real estate-related internet searches in Egypt |
Exhibit 9: EGP/US$ |
|
|
|
Source: Google trends. Note: The January 2011 revolution and June 2013 election show as marked dips. |
Source: Bloomberg |
|
Exhibit 8: Real estate-related internet searches in Egypt |
|
|
Source: Google trends. Note: The January 2011 revolution and June 2013 election show as marked dips. |
|
Exhibit 9: EGP/US$ |
|
|
Source: Bloomberg |
The fall in the oil price has had the effect of reducing foreign direct investment from the Gulf States, but as a net importer of oil, Egypt benefits from low oil prices. They have allowed the government to reduce fuel subsidies, which made up 25% of government expenditure in 2013. This subsidy reduction is welcome news as Egypt looks to manage its budget deficit (11.5% of GDP in 2015). Management of the government budget may also encourage it to engage in more public-private development partnerships to increase revenue, which should also benefit residential developers.
Key investment considerations
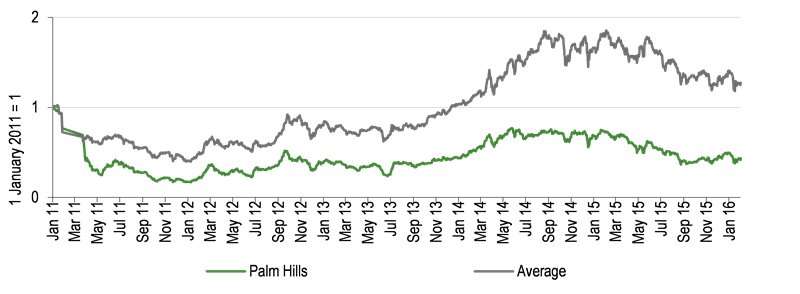
Palm Hills struggled more than its competitors immediately after the revolution, with the share price losing 83% of its value in 2011 compared with 59% on average for its peers. Despite considerable progress being made on a number of issues that have affected performance (financial strength, cash flow, land bank and security of earnings), its market price has not shared in the subsequent sector recovery.
|
Exhibit 10 Palm Hills’ and peers’ share price performance since 2010 |
|
|
Source: Bloomberg. Note: The peer group is as in Exhibit 25 and excludes Palm Hills. The Egyptian Stock Exchange was shut from 27 January to 23 March 2011 following the uprising. |
Balance sheet considerably strengthened
One reason Palm Hills was so badly affected by the revolution was that it was insufficiently capitalised to cope with the unexpected decline in the market. During 2013 and 2015 EGP2.25bn of new equity was raised with support from both existing and new shareholders. Liquidity has been strengthened in 2014 with new bank debt of EGP2.4bn, with a grace period (no capital repayments) until March 2017. Interest on this loan of 3.25% over the central bank deposit rate (of 10.75%) is capitalised. Equity has increased to EGP6.3bn at the end of 2015 with net debt of EGP2.1bn. Palm Hills has indicated that it is considering securitising some of its receivables in order to bring cash flows forward. Accounts receivable stood at EGP1.4bn at the year end.
Exhibit 11: Palm Hills’ capital events since the Egyptian Revolution, January 2011
Date |
Capital event |
EGPm |
March and September 2011 |
Land returned to government |
Reduction in land liability |
Q311 |
Shareholder loan |
600 |
28 October 2013 |
Rights issue |
609 |
01 September 2014 |
Bank loan |
2,400 |
01 June 2015 |
Land sale |
481 |
04 June 2015 |
Rights issue |
1,648 |
16 July 2015 |
Bank loan to subsidiary |
750 |
Source: Company data
Exhibit 12 shows the development of cash and marketable securities as a percentage of current liabilities over time. Exhibit 13 shows that total debt to EBITDA has declined significantly.
|
Exhibit 12: Cash and marketable securities as % of current liabilities |
Exhibit 13: Total debt and total debt/EBITDA |
|
|
|
Source: Company data, Edison Investment Research |
|
|
Exhibit 12: Cash and marketable securities as % of current liabilities |
|
|
|
|
Exhibit 13: Total debt and total debt/EBITDA |
|
|
|
|
Source: Company data, Edison Investment Research |
Cash flow set to grow
Although the company has been profitable since 2013, accelerated construction expenditure has meant operating cash flows have been negative. In the past, Palm Hills has bought land, developed a master plan and begun marketing and construction. This has meant that substantial cash outflows for land purchases have preceded cash inflows. These begin when customers reserve units and then continue as they pay a further deposit on exchange of contracts and instalments thereafter. Construction of units lasts around four years on average, versus a five-year average payment period from customers. Therefore, projects launched before 2015 have cash flow profiles that are heavily weighted to the end of their lives. A change in land sales policy by the government agency NUCA (a major source of development land) from land sales on fixed payment schedules to revenue and profit-sharing co-development should reduce upfront land investment. Recent developments entered into by Palm Hills, including the 500 feddans in East Cairo, Capital Gardens and the soon-to-be-launched Ras El Hekma are co-developments based on this model. As the cash inflows from the accelerated sales activity since 2013 grow, we expect this to more than offset development spending in the coming years, even though we forecast that this spending will grow further. As we show in Exhibit 14, our forecast for pre-tax operating cash flow turns positive in 2016 and grows significantly in 2018.
|
Exhibit 14: Operating cash flow before tax and interest |
|
|
Source: Company data, Edison Investment Research |
Land bank
As Palm Hills develops its residential projects, it naturally depletes its land bank. The company made a conscious decision to accelerate development in 2015, which will continue in 2016 and 2017. Having earlier rationalised its land bank in the post-revolution period, there have been some concerns about its ability to replenish this to feed future development activity. At the start of 2015 16.9m sqm out of a total land bank of 22.8m were already under development. Core “raw” land for future development projects was 7.7m sqm, which includes the Botanica project on the Cairo-Alexandria desert road. Previously classified as a development project, it is now on hold pending a re-zoning decision. Palm Hills intends to return deposits to its customers with 9.5% interest (amounting to a total of c EGP 20m). The company’s renewed focus on Greater Cairo and second homes on the coast had identified non-core land of 5.3m sqm at the end of 2014, of which 0.3m sqm has been sold and 5m sqm in Saudi Arabia is held for sale. Importantly, Palm Hills has had success replenishing its land bank, adding 3.2m sqm. This has been achieved through four co-development deals, which are a less cash-intensive way to secure new development land than buying it outright. Palm Hills continues to seek more land, particularly on the North Coast, but also around Cairo. Should an existing MoU with Aabar Investments and NUCA proceed to contract, as management hopes, it would be transformational, adding 42m sqm of land in West Cairo (see page 17). Sales of non-core land will continue and management hopes to sell the Saudi land in 2016, although, as we explain in the Financials section, we have not included this in our forecasts.
|
Exhibit 15: Land bank at 31 December 2014 |
Exhibit 16: Land bank at 31 December 2015 |
|
|
|
Source: Company data, Edison Investment Research. Note: Total = 22.8m sqm. |
Source: Company data, Edison Investment Research. Note: Total = 27.1m sqm. |
|
Exhibit 15: Land bank at 31 December 2014 |
|
|
Source: Company data, Edison Investment Research. Note: Total = 22.8m sqm. |
|
Exhibit 16: Land bank at 31 December 2015 |
|
|
Source: Company data, Edison Investment Research. Note: Total = 27.1m sqm. |
Recurring income
A pillar of Palm Hills’ strategy is to establish material recurring profit streams to complement the inevitable volatility of residential development and sales. As we discuss above, the current commercial activities are relatively small compared with the target of 25% of operating profit in 2020. Currently disclosed initiatives include the expansion of the Palm October Club and four build-and-hold commercial development projects. Investment in the Palm October Club looks to increase membership from 1,800 to 10,000 by 2019 (fees start at EGP100,000 on joining, EGP150,000 for non-residents of Palm Hills’ adjacent projects, and EGP5,000 a year subscription thereafter). Our estimates allow for 5,000 members in 2020, generating operating profits of EGP61m (6.1% of our forecast group EBITDA in that year). One of the four commercial developments has recently reached completion (Street 88 mall in West Cairo) and the three ongoing developments (the Phase 8 office building and two malls at the Katameya and Village Gate residential projects) will require c EGP300m of funding and are all expected to be operational by 2019. Several other commercial projects are in the planning stages. Relatively little has been disclosed about the revenue-generating potential of the commercial developments and we have not allowed for these in our forecasts. They are carried at a cost of EGP858m on the balance sheet (excluding Palm October Club).
Financials
Palm Hills publishes its financial statements on both an IFRS basis and on an Egyptian GAAP basis. Net earnings and net asset value are very similar in both cases, although there are more material differences in the line item reporting, and gross IFRS assets and liabilities are higher than those reported under GAAP. Our analysis and forecasts are based on the IFRS financial statements.
P&L account
A key performance metric for the company is “sales”, or the value of residential properties (and land) that is reserved by customers during the period. Sales are not revenues reported through the P&L, although Palm Hills does receive a deposit, typically 10% of the value, on reservation. Sales are best seen as a lead indicator of future revenues and they have increased more than fivefold (on a gross basis) since the 2011 revolution to EGP6.3bn in the recently reported FY15, a 58% CAGR. We expect further growth in the coming years as several planned development projects (500 feddans in East Cairo, Palm Hills Katameya Extension II, Ras El Hekma, etc) are released for sale and as sales continue on further tranches of existing projects. Some reservations are subsequently cancelled and, in the aftermath of the revolution, unusually high cancellations actually exceeded gross new sales in both 2011 and 2012. We have been guided towards a normal cancellation rate of c 10% (2014: 9.2%, 2015: 8.5%) and have used this in our forward-looking forecasts.
|
Exhibit 17: Gross and net sales |
|
|
Source: Company data, Edison Investment Research. Note: Cancellation rate = cancellations/gross sales. |
When sales proceed to contract (a process that typically takes around 2-6 months according to management and is assumed to be six months in our forward modelling), the customer makes an initial contract payment (in addition to the deposit), usually 10% of the total value but in some cases 15%. Revenues from the sale of land (ie the garden and surrounding land) for villas and townhouses are also recognised in the P&L at the point of contract, along with the appropriate cost of goods (land) sold, although revenues (and costs) from construction are not recognised until the building is completed. Similarly, revenues (and costs) from apartments and multi-tenanted buildings are not recognised until delivery to the customer. Egyptian GAAP is moving to a percentage of completion accounting basis for land, as well as buildings, in 2016 (IFRS will follow in 2018). Palm Hills will therefore change its accounting basis, but expects this to have a minimal impact on the accounts.
After contracting, customers usually pay the outstanding balance for their purchase in instalments, typically over a five-year period (also assumed in our modelling). This substantially funds the cash costs of construction, for which the typical lag between contract and delivery is around four years (as modelled).
Management provides detailed costing expectations for its current and planned residential development projects, and our forecasts are based on these, combined with our forecasts of future sales, building, and delivery schedules on a project-by-project basis. We expect the current portfolio of projects to produce a long tail of sales and revenues lasting well beyond 2020, and cash flows through 2027. This long tail is reflected in our valuation, although we do not show group forecasts stretching out this far. We expect further projects to be announced, but these are not captured in our forecasts. The company enjoyed significant tax exemptions until 31 December 2015, but will pay a corporate tax rate of 22.5% of profits from 2016 onwards (2015 effective tax rate 3.4%).
We believe our sales value assumptions reflect the current market environment. As we show above, land and selling prices have been increasing in recent years and CPI has averaged around 10% pa over the last four years. To reflect currently elevated demand for residential real estate (demonstrated by the reservation rates at Capital Gardens and Palm Valley), partly fuelled by the ongoing currency devaluation, we have allowed for prices to increase 15% per year in 2016 and 2017. We also expect the costs to grow due to the current inflation, but have assumed a lower growth rate of 5% per year in 2016 and 2017 to reflect Palm Hills’ ability to control costs to some extent with long-term contracts. After 2017 we have assumed 5% annual growth in both unit sales prices and costs.
If we were to assume a blanket 10% increase in both the land and building sales values contained in our forecasts, the total estimated gross profit over the remaining life of the contracts would increase from EGP17.4bn to EGP22.6bn (+30%). Building costs are generally fixed by contract at the start of each development phase (management indicates the current launched project pipeline has building costs fixed in this way). However, every 1% increase in total building costs would reduce the uplift in gross profit by c EGP220m and on this basis a matching 10% increase in all future building costs would limit the net increase in future gross profits to EGP20.4bn (+11%). It is likely that the recent 14% devaluation of the Egyptian Pound will directly increase some costs, such as imported materials, fixtures and fittings; and indirectly it may exert upward pressure on local costs and wages. However, early indications from the industry suggest that this can be offset by increased selling prices. For this reason we have made no specific adjustments for the devaluation.
As indicated above, our forecasts allow for the continued development of the hotels and Palm October Club and we will include the planned commercial development when management is in a position to provide more information.
Our estimate for borrowing costs assumes a continuation of current spreads and current official rates (c 10%) and allows for the interest to be paid rather than capitalised on the EGP2.4bn loan from AAIB from March 2017. We have assumed no profits from non-core land sales although, as we discuss below, this is possible if non-core land in Saudi Arabia is sold this year, as management hopes.
Exhibit 18: Key financial data – income statement
IFRS EGPm |
2013 |
2014 |
2015 |
2016e |
2017e |
Sale of land attributable to villas and houses |
579.5 |
1,311.9 |
2,119.1 |
2,283.8 |
2,156.2 |
Revenue from construction contracts |
619.0 |
775.2 |
1,411.3 |
1,922.3 |
2,074.3 |
Total residential construction revenues |
1,198.5 |
2,087.0 |
3,530.4 |
4,206.2 |
4,230.5 |
Revenue from club activities |
12.8 |
20.0 |
41.9 |
49.8 |
60.2 |
Revenue from hospitality |
10.7 |
19.0 |
30.2 |
24.0 |
27.6 |
Total revenues |
1,222.0 |
2,126.1 |
3,602.5 |
4,280.0 |
4,318.3 |
Cost of land |
(297.7) |
(353.2) |
(403.9) |
(1,180.7) |
(1,114.7) |
Cost of build and infrastructure |
(600.6) |
(1,000.3) |
(1,887.7) |
(1,422.9) |
(1,535.4) |
Total costs attrib. to development |
(898.3) |
(1,353.5) |
(2,291.7) |
(2,603.6) |
(2,650.0) |
Cost of club revenue |
(18.0) |
(19.0) |
(17.3) |
(17.4) |
(19.5) |
Cost of hospitality revenue |
(7.1) |
(5.7) |
(5.4) |
(5.6) |
(6.4) |
Other |
0.0 |
0.0 |
(15.8) |
0.0 |
0.0 |
Total cost of goods sold |
(923.3) |
(1,378.1) |
(2,330.1) |
(2,626.6) |
(2,676.0) |
Gross profit (loss) |
298.7 |
747.9 |
1,272.4 |
1,653.4 |
1,642.3 |
Selling and Admin expenses |
(165.1) |
(345.9) |
(659.5) |
(631.7) |
(672.6) |
EBIT |
133.6 |
402.1 |
612.9 |
1,021.8 |
969.8 |
Net finance income/(expense) |
76.6 |
(103.7) |
14.2 |
(201.1) |
(370.2) |
Other income/expense |
38.0 |
83.7 |
475.1 |
49.1 |
49.1 |
Profit (Loss) before income tax & non-controlling interests |
248.2 |
382.1 |
1,102.2 |
869.8 |
648.7 |
Income tax expense |
(.5) |
(8.8) |
(37.7) |
(195.7) |
(146.0) |
Non-controlling interests |
(10.9) |
(20.0) |
(32.9) |
(33.7) |
(25.1) |
Net attributable profit |
236.8 |
353.3 |
1,031.5 |
640.4 |
477.6 |
Basic and fully diluted average number of shares (m) |
1,100.7 |
1,375.2 |
1,705.0 |
2,308.9 |
2,308.9 |
EPS (EGP) |
0.22 |
0.26 |
0.60 |
0.28 |
0.21 |
DPS (EGP) |
0.0 |
0.0 |
0.2 |
0.0 |
0.0 |
Source: Company data, Edison Investment Research.
Cash flow
Under normal circumstances, there is a reasonable matching between the cash outlays for building and infrastructure and the cash receipts from customers, while much of the recognition of profits is deferred until completion. As discussed above, although historically upfront land investment has been necessary, there is a shift underway to co-developments with fewer or no fixed land payments. The natural matching of cash flows was interrupted by the unusual circumstances of 2011-12 (as discussed on page 10), which saw material reservation and contract cancellations, squeezing cash flow, delaying construction activity and thereby further squeezing cash flow. Supported by the recapitalisation of the balance sheet and market tailwinds, we forecast that recent strong growth in sales will produce a marked turnaround in cash flow over the coming three years, especially as construction costs on older projects are brought forward and several co-developments start producing cash flow (without land costs). This is providing the resources for Palm Hills to boost its land bank for future growth and undertake commercial property development investment for future recurring income. As guided by management, we have allowed for EGP8.4bn of future land payments in respect of the current project portfolio between 2016 and 2022. We have not included any future land purchase agreements in our forecasts, nor have we allowed for the sale of the non-core Saudi land. Management believes this has a value of between EGP900m and EGP1.1bn which, if realised, could boost cash balances above our forecast by c EGP750m.
Exhibit 19: Key financial data – cash flow
IFRS EGP millions |
2013 |
2014 |
2015 |
2016e |
2017e |
PBT |
248 |
382 |
1,102 |
870 |
649 |
Adjust for: |
|||||
Depreciation and impairment of property and equipment |
26 |
21 |
22 |
10 |
10 |
(Gain)/losses on disposal |
(14) |
(36) |
(433) |
0 |
0 |
Net finance (income)/expense |
(77) |
104 |
(14) |
201 |
370 |
Share of loss (gain) of associates |
1 |
(3) |
(1) |
0 |
0 |
Cash flows from operating activities before changes in working capital |
185 |
468 |
676 |
1,081 |
1,029 |
(Increase) Decrease in notes receivable |
(328) |
(1,825) |
(2,904) |
(2,170) |
(1,856) |
(Increase) in accounts receivable and prepayments |
(104) |
410 |
282 |
0 |
0 |
(Increase) Decrease in development properties |
0 |
266 |
(194) |
(41) |
144 |
Increase (Decrease) in notes payable |
124 |
(30) |
(39) |
213 |
0 |
Increase (Decrease) in accounts payable and accruals |
(118) |
(80) |
(376) |
119 |
0 |
Increase (Decrease) in advances from customers |
(42) |
27 |
149 |
29 |
21 |
Increase (Decrease) in billings in excess of costs |
28 |
16 |
67 |
1,256 |
830 |
Increase (Decrease) in other non-current liabilities |
20 |
61 |
90 |
0 |
0 |
Cash flows from operations before tax and financing costs |
(235) |
(687) |
(2,249) |
487 |
168 |
Interest paid |
(59) |
(76) |
(39) |
(111) |
(302) |
Tax paid |
0 |
0 |
(83) |
(196) |
(146) |
Net cash flows from operating activities |
(293) |
(763) |
(2,371) |
181 |
(279) |
Cash flows from investing activities |
(9) |
(120) |
59 |
(16) |
(16) |
Proceeds from share issuance |
0 |
600 |
1,648 |
0 |
0 |
Dividends paid in period |
0 |
0 |
0 |
(346) |
0 |
Other financing |
22 |
(9) |
0 |
0 |
0 |
Cash flows from financing |
22 |
591 |
1,648 |
(346) |
0 |
(Increase)/decrease in net debt |
(280) |
(291) |
(664) |
(182) |
(295) |
Opening net (debt)/cash |
(909) |
(1,189) |
(1,481) |
(2,145) |
(2,327) |
Closing net (debt)/cash |
(1,189) |
(1,481) |
(2,145) |
(2,327) |
(2,622) |
Source: Company data, Edison Investment Research
We forecast cash flow from operations (before tax and finance cost payments) to turn positive in 2016 and grow strongly in 2018. Because of the increase in the effective tax rate (from 1 January 2016) and the step-up in debt costs (from March 2017), net operating cash flow is not forecast to turn positive until 2018. This group figure includes all of the group operations and administrative costs whereas, looking simply at the residential real estate activities, we forecast positive gross cash flow (customer receipts less building, infrastructure and land payments) in 2016 and for an aggregate EGP17.4bn of gross cash flow over the remaining life of the existing projects.
When proposing the payment of a dividend in respect of FY15, management indicated that it anticipates distributions of around one-third of free cash flow in the future. 2015 benefited from cEGP425m of non-core land sale gains and, assuming no repeat of these, our forecasts show free cash flow (the net change in cash) becoming significantly positive only from 2018. Moreover, we anticipate that Palm Hills may wish to undertake material investment, not captured in our model, to progress its strategy of building a recurring earnings stream. Future residential land bank investment (as opposed to co-development), again not captured in our estimates, is also a possibility. For this reason, despite the company’s intention to pay dividends in the future, we will look to include these as management finds itself in a position to provide additional guidance.
Balance sheet
The importance of maintaining financial strength was demonstrated in 2011-12. Any concern over the ability to meet future commitments has the potential to increase customer cancellations during periods of market disruption, with negative impacts on the normal pattern of cash flow. As discussed on pages 9 and 10, Palm Hills’ capital and liquidity position has been greatly enhanced. By the end of 2015 the net financial debt to equity ratio2 had strengthened to 23% from a post-revolution peak of 38% before the last equity raise. Palm Hills has debt facilities totalling EGP3.5bn including a Mudarabah contract with the Abu Dhabi Islamic Bank. The largest loan of EGP2.4bn from the Arab African International Bank is at 3.25% above the Egyptian Central Bank deposit corridor rate (10.75% at 6 April 2016) and is repayable quarterly over 4.5 years from 31 October 2016. Debts are secured against cash flows from projects.
(Net debt – non-cash financial assets) ÷ shareholders’ equity.
Exhibit 20: Key financial data – balance sheet
IFRS EGPm |
2013 |
2014 |
2015 |
2016e |
2017e |
Investment property |
1,439 |
1,943 |
1,713 |
1,713 |
1,713 |
Property and equipment |
332 |
312 |
335 |
344 |
354 |
Advance payments for investment acquisitions |
178 |
224 |
205 |
205 |
205 |
Investment in associates |
54 |
57 |
58 |
58 |
58 |
Notes receivable |
1,429 |
2,660 |
4,546 |
6,024 |
7,309 |
Deferred tax asset |
0 |
4 |
12 |
12 |
12 |
Total non-current assets |
3,433 |
5,201 |
6,869 |
8,356 |
9,651 |
Notes receivable |
1,273 |
1,572 |
2,371 |
3,142 |
3,812 |
Accounts receivable and prepayments |
2,129 |
1,719 |
1,437 |
1,437 |
1,437 |
Cash |
111 |
195 |
966 |
893 |
344 |
Financial assets at fair value held for trading |
69 |
57 |
67 |
67 |
67 |
Financial assets held to maturity |
0 |
20 |
613 |
613 |
613 |
Development properties |
3,668 |
2,769 |
2,243 |
2,284 |
2,140 |
Total current assets |
7,250 |
6,331 |
7,698 |
8,437 |
8,414 |
Total assets |
10,683 |
11,533 |
14,567 |
16,793 |
18,065 |
Term loans |
802 |
1,462 |
2,918 |
3,025 |
2,778 |
Land purchase liabilities |
403 |
350 |
268 |
355 |
442 |
Notes payable |
762 |
537 |
149 |
149 |
149 |
Other non-current liabilities |
334 |
395 |
486 |
486 |
486 |
Deferred tax liability |
6 |
0 |
0 |
0 |
0 |
Total non-current liabilities |
2,307 |
2,744 |
3,821 |
4,014 |
3,854 |
Bank overdrafts and credit balances |
284 |
39 |
111 |
111 |
111 |
Term loans |
215 |
174 |
81 |
84 |
77 |
Land purchase liabilities |
198 |
217 |
263 |
349 |
434 |
Accounts payable and accruals |
1,595 |
1,515 |
1,140 |
1,258 |
1,258 |
Current notes payable |
727 |
805 |
474 |
686 |
686 |
Advances from customers |
89 |
116 |
265 |
294 |
315 |
Billings in excess of costs |
1,697 |
1,714 |
1,781 |
3,037 |
3,867 |
Income tax payable |
65 |
84 |
47 |
47 |
47 |
Total current liabilities |
4,870 |
4,664 |
4,162 |
5,867 |
6,796 |
Total liabilities |
7,177 |
7,409 |
7,982 |
9,881 |
10,651 |
Net assets |
3,506 |
4,124 |
6,584 |
6,912 |
7,415 |
Non-controlling interests |
285 |
256 |
271 |
304 |
330 |
Shareholders' equity |
3,221 |
3,868 |
6,314 |
6,608 |
7,085 |
Fully diluted period end number of shares (m) |
1,100.7 |
1,415.7 |
2,308.9 |
2,308.9 |
2,308.9 |
NAV per share (EGP) |
2.93 |
2.73 |
2.73 |
2.86 |
3.07 |
Source: Company data, Edison Investment Research
Exhibit 21: Debt summary
Institution |
Facility (EGPm) |
Rate |
Expiry |
Bank Misr |
750 |
Deposit rate + 1.9% |
Revolving |
Arab African Investment Bank |
225 |
Deposit rate +2.75% |
2018 |
Arab African Investment Bank |
2,400 |
Deposit rate + 3.25% |
2021 |
Abu Dhabi Islamic Bank |
96 |
N/A* |
2017 |
Source: Company data. Note: *The Mudarabah Contract has expected profit of 33% distributed 95% to the bank and 5% to Palm Hills.
Valuation: NAV and earnings
Palm Hills trades broadly in line with FY15 NAV per share of EGP2.73. We believe this is a conservative measure of the value of the company’s assets, as undeveloped land assets and the hotel interests are all carried at book value. To estimate an achievable market value, we have taken management’s guided values for these assets and allowed for tax at 22.5% on any potential gain. The resulting NAV is equivalent to EGP4.54/share. In addition, we estimate the after tax NPV of all current residential development projects to be EGP1.60 per share. We derived this value by discounting our forecast net profits of all current residential developments less tax at 22.5% at a conservative discount rate of 18%. Exhibit 22 shows a potential future NAV of 6.14p after incorporating all these elements.
Exhibit 22: Valuation table (EGP per share)
Current NAV (31 December 2015) |
2.73 |
Estimated market value uplift of the undeveloped land bank |
1.74 |
Estimated market value uplift of the hotel interests |
0.07 |
Mark-to-market NAV |
4.54 |
NPV of future residential development profits |
1.60 |
Total potential value |
6.14 |
Current NAV (31 December 2015) |
Estimated market value uplift of the undeveloped land bank |
Estimated market value uplift of the hotel interests |
Mark-to-market NAV |
NPV of future residential development profits |
Total potential value |
2.73 |
1.74 |
0.07 |
4.54 |
1.60 |
6.14 |
Source: Company data, Edison Investment Research
Management’s estimates of the undeveloped land values (both residential and commercial) are based on recent comparable transactions and market indications. In attempting to verify these values, we have compared management’s estimates with what we believe to be similar real estate asset values on local price comparison sites and research reports from local property agents (sources: JLL, Colliers, OLX).
Exhibit 23: Undeveloped land bank and hotel value based on management guidance
Asset |
Book value (EGPm) |
Area |
Book value (EGP/sqm) |
Mgmt guided market value (EGP/sqm) |
Mgmt guided market value (EGPm) |
Potential gain (EGPm) |
Tax rate (%) |
Gain after tax (EGPm) |
Gain (EGP/share) |
Botanica* |
212 |
7,138 |
30 |
380 |
2,712 |
2,500 |
22.5 |
1,938 |
0.84 |
KSA |
135 |
2,550 |
53 |
430 |
1,097 |
962 |
22.5 |
745 |
0.32 |
Galala |
58 |
487 |
119 |
1350 |
657 |
599 |
22.5 |
465 |
0.20 |
Red Sea |
114 |
92 |
1,236 |
1500 |
138 |
24 |
22.5 |
19 |
0.01 |
Residential land subtotal |
519 |
10,267 |
51 |
448 |
4,605 |
4,086 |
22.5 |
3,167 |
1.37 |
Commercial land |
858 |
337 |
2,546 |
5,786 |
1,950 |
1,091 |
22.5 |
846 |
0.37 |
Hotels |
106 |
318 |
212 |
22.5 |
164 |
0.07 |
|||
Total/average |
1,377 |
10,604 |
3,985 |
9,446 |
6,555 |
5,177 |
22.5 |
4,012 |
1.81 |
Source: Company data, Edison Investment Research. Note: *Botanica’s estimated market value assumes obtaining the zoning consent; all other estimated market values are based on the current land conditions without further planning or zoning consents.
In Exhibit 22 we show the bridge from the carried book value of commercial and undeveloped residential land values (at end FY15) to market values after tax and the potential uplift to market value per share. We have only included the undeveloped land bank because we have separately allowed for the uplift supporting the current development projects in our valuation of future profits. We note that undeveloped commercial land prices are higher than the sales price for certain completed residential properties on a per square metre basis. According to management, this is typical due to the location of the commercial land. Also, as guided by management, we have valued Palm Hills’ three hotels at a replacement value of $80,000 per room and allowed for Accor’s 40% share of the JV (which owns the hotels) as well as a tax rate of 22.5%. This adds another EGP0.07 per share to the group NAV above current carrying value. Incorporating these elements, we arrive at a mark-to-market NAV of EGP4.54 (based on management guidance).
In addition, we estimate that the net present value of future profits of the current residential developments and the Palm October Club, allowing for group central overhead and tax, is an additional EGP1.60 per share that will be earned over time and increase NAV further. To calculate this future profit we have constructed future forecasts for gross profit of all ongoing and planned residential development projects, calculated bottom-up, project-by-project throughout their duration, which we expect to be until 2028. For the Palm October Club we assumed slower growth in memberships than management’s plan (reaching capacity of 10,000 in 2024 rather than 2020); kept costs at the current proportion of revenues and maintained depreciation at current levels. This gives an operating profit margin of 30%, rising to 50% in 2020 as membership grows. For the NPV calculation, we have chosen a discount rate of 18%, close to Palm Hills’ cost of equity, for our base case scenario, giving a present value of the future forecast profits of EGP3.7bn or EGP1.60 per share, compared with a current NAV of EGP2.73/share. The risk-free rate in Egypt (yield on 10-year government bonds) is 15.7% at 28 April; given an expected market return of 16.44%, the country risk premium is 0.89%. Palm Hills has a beta of 1.20. In Exhibit 24 we have shown the sensitivity of this NPV to a range of discount rates.
Exhibit 24: DCF sensitivity to discount rate on the value of residential development profits
Discount rate (%) |
NPV of EBIDA (EGPm) |
NPV per share (EGP) |
NPV + NAV per share (EGP) |
24 |
3,037 |
1.32 |
4.05 |
23 |
3,132 |
1.36 |
4.09 |
22 |
3,231 |
1.40 |
4.13 |
21 |
3,336 |
1.44 |
4.18 |
20 |
3,446 |
1.49 |
4.23 |
19 |
3,562 |
1.64 |
4.28 |
18 |
3,685 |
1.60 |
4.33 |
17 |
3,816 |
1.65 |
4.39 |
16 |
3,954 |
1.71 |
4.45 |
Source: Edison Investment Research
Egyptian quoted peer group
Egypt’s property development market has 10 players with market capitalisations around or over EGP1bn, six of which, including Palm Hills, are in the main local stock market index, the EGX 30. In Exhibit 25 we show the eight companies that can reasonably be compared with Palm Hills, excluding Egyptian Resorts Company (ERC), which only builds holiday resorts on the Red Sea coast. Heliopolis (HELI), Amer (AMER), Talaat Moustafa (TMGH) and Madinet Nasr (MNHD) target middle to upper income households; Emaar Misr (EMFD), Palm Hills (PHDC) and SODIC (OCDI) aim at the higher income bracket and United (UNIT) and El Kahera (ELKA) target the middle and lower range. Of the peer group, Palm Hills had the second highest revenues, profits, units reserved and units delivered in 2015 and has the second largest land bank, according to the company presentation of April 2016. Despite this, it appears to be conservatively valued compared to the peer group, on the second lowest price-to-book ratio. We have also included the P/E ratios for comparison in Exhibit 25 below; these are based on 12-month trailing earnings because there are no public consensus estimates available for several of the peer companies. Palm Hills’ 2015 earnings included a one-off profit of EGP425m from the sale of land. Excluding this, its P/E would be 7.6x on 2015 earnings. While these ratios (based on the last 12-month reported earnings) may not be the best measure of value in the property development industry, they help to illustrate Palm Hills’ relative rating within the peer group.
Exhibit 25: Peer group
Company |
Market capitalisation (EGPm) |
NAV (EGPm) |
P/B (x) |
P/E (x) |
Land bank, sqm |
Palm Hills |
5,691 |
6,314 |
0.90 |
4.2 |
27.1m |
TMGH |
13,702 |
26,755 |
0.51 |
18.1 |
50.0m |
EMFD* |
12,056 |
15.4m |
|||
MNHD |
7,688 |
966 |
7.96 |
32.3 |
9.7m |
HELI* |
5,624 |
511 |
11.00 |
32.9 |
N/A |
OCDI |
3,620 |
3,386 |
1.07 |
11.7 |
6.0m |
UNIT |
1,120 |
236 |
4.75 |
31.0 |
9.7m |
ELKA |
1,030 |
839 |
1.23 |
10.1 |
N/A |
AMER* |
1,778 |
1,836 |
1.28 |
23.5 |
N/A |
Source: Bloomberg, company data. Note: *Heliopolis and Amer NAV and land bank figures are as of 30 September 2015, EMFD’s last data are unavailable. All other companies’ NAV and land bank data are as at 31 December 2015. Market capitalisation, P/B and P/E are from Bloomberg as at 27 April 2016.
Potential new project: Wahet October MoU (October Oasis)
Palm Hills has an MoU, signed in March 2015, with NUCA and Aabar Investments, a subsidiary of IPIC, the Abu Dhabi national oil and development company. The MoU is the first step towards a contract for Palm Hills and Aabar to co-develop a new city on 10,000 feddans (42sq km) of land in West Cairo. There is no certainty yet that Wahet October will go ahead. For that reason, we have not included it in our forecasts, although given its potential scale we illustrate its possible impact on Palm Hills. We have used the 500 feddan and Capital Gardens co-development projects in East Cairo as a guide. The Wahet October project is 10,000 feddans (42m sqm) and, assuming similar zoning and levels of housing density, we think it could accommodate in the region of 36m sqm of sellable accommodation and 20m sqm of sellable land area. Housing and land sales prices, and construction costs from Palm Hills’ recent West Cairo projects imply that Wahet October could have a total sales value of residential units of perhaps EGP400bn and construction costs could be in the region of EGP120bn. This is purely an illustration, with little evidence to go on. Moreover, we have no idea how the value could be split between the parties interested in the discussions.
Sensitivities
New project launches: should the MoU with Aabar and the government for the 42m sqm West Cairo development be converted into a contract, we would expect the share price to increase.
Unit deliveries: as explained above, the timing of delivery of units affects revenue recognition strongly. Acceleration or deceleration of this would likely have an effect on the share price. Recent execution has been timely or ahead of schedule and we expect that to continue, with the company aiming to complete all projects launched before September 2015 by 2018 (except Botanica).
Sales prices and construction costs: Our estimates allow for sales prices to grow at 15% pa in 2016 and 2017 as explained on page 12, and for construction costs to grow by 5% pa in those years, in line with recent trends. We have allowed for 5% growth in both prices and costs from 2018 onwards. A blanket increase in costs of 1% throughout the life of the existing projects reduces our NPV of future EBITDA after tax by roughly EGP100m. The same 1% increase in prices raises it by c EGP200m. If both rise by 1% there is a net increase of EGP0.045 per share in our NPV of future profits.
Political and economic climate: the recently elected government of Abdel Fatah el-Sisi seems firmly ensconced and although it faces both economic and political difficulties, it has begun to reduce the budget deficit and reform some of the laws holding the economy back (eg subsidies). More broadly, the IMF expects Egypt’s economy to grow over the next five years (Exhibit 9).
Terrorism: the effect of several terrorist acts and the revolution on foreign tourism in Egypt has been severe and has affected the wider economy. Palm Hills’ only direct exposure to foreign tourism is through one of the hotels owned by its JV with Accor, a Novotel in Sharm el-Sheikh. Otherwise its market is almost exclusively domestic, including for its other hotels. We therefore do not expect any other terrorism targeting foreigners to affect earnings directly.
Currency: the Egyptian pound may well fall below its current value, although, as a company with costs and revenues in the domestic currency, Palm Hills may not be adversely affected and its properties may be used as a store of value by Egyptians. The official exchange rate of EGP8.878 per US$ compares with EGP10.16/US$ on the black market reported by Capital Economics on 7 April 2016.
Interest rates: a rise in the cost of debt could increase Palm Hills’ costs significantly. The central bank increased interest rates by 150bp in March 2016 and they are now slightly above the post-revolution average.
Land disputes: Palm Hills is currently free of litigation. Construction has begun on all launched projects and we expect them to remain free of disputes.
Land sale: Palm Hills intends to sell its land near Riyadh in 2016. The company has a 51% interest in 5m sqm. It reports land prices of c EGP430 per sqm in the area, which would give Palm Hills’ share a value of c EGP1.1bn.
Residential development portfolio
Palm Hills has six completed projects and 18 under or awaiting construction, as well as four undeveloped land plots (one held for sale).
Exhibit 26: Development project portfolio (includes only projects where sales have begun).
Project |
Location |
Type |
Number of units |
Land area |
Built-up |
Total value of |
Average price/ |
Unsold value |
% remaining to |
% of total portfolio |
|
Phase 1-5 & Cascade* |
West Cairo |
Standalone units |
104 |
52,835 |
43,047 |
319,071,790 |
3,328 |
21,363,382 |
7 |
0.6 |
|
Bamboo* |
West Cairo |
Apartments |
132 |
31,567 |
88,381,359 |
2,800 |
11,839,253 |
13 |
0.2 |
||
Golden Palm* |
West Cairo |
Standalone units |
122 |
108,159 |
70,210 |
287,811,484 |
1,614 |
15,412,804 |
5 |
0.5 |
|
Bamboo Extension* |
West Cairo |
Standalone units |
149 |
75,939 |
65,397 |
352,789,599 |
2,496 |
- |
0 |
0.6 |
|
Palm Parks |
West Cairo |
Apartments |
1,182 |
- |
379,788 |
2,419,398,750 |
6,370 |
1,579,956,583 |
65 |
4.4 |
|
Golf Views |
West Cairo |
Standalone units |
680 |
652,113 |
492,266 |
3,995,010,877 |
3,491 |
936,387,219 |
23 |
7.2 |
|
Golf Extension |
West Cairo |
Standalone units |
971 |
462,216 |
424,298 |
3,728,419,369 |
4,206 |
1,715,731,223 |
46 |
6.7 |
|
Woodville |
West Cairo |
Standalone units |
475 |
135,016 |
178,080 |
1,422,246,362 |
4,543 |
705,178,201 |
50 |
2.6 |
|
Palm Valley |
West Cairo |
Standalone units |
238 |
110,130 |
107,627 |
1,084,873,900 |
4,982 |
1,079,834,766 |
100 |
2.0 |
|
CASA |
West Cairo |
Apartments |
1,154 |
- |
273,837 |
1,040,375,398 |
3,799 |
59,835,605 |
6 |
1.9 |
|
Smart Village Residence** |
West Cairo |
Apartments |
430 |
- |
53,093 |
715,179,188 |
13,470 |
715,179,188 |
100 |
1.3 |
|
Palm Hills Katameya |
East Cairo |
Standalone units |
516 |
428,857 |
317,874 |
2,244,988,465 |
3,006 |
209,102,793 |
9 |
4.0 |
|
Palm Hills Katameya Extension |
East Cairo |
Standalone units |
341 |
125,246 |
126,473 |
1,049,048,858 |
4,168 |
151,101,703 |
14 |
1.9 |
|
Palm Hills Katameya Extension Phase 2 |
East Cairo |
Standalone units |
166 |
81,757 |
68,271 |
1,070,543,283 |
7,136 |
1,070,543,283 |
100 |
1.9 |
|
Village Avenue |
East Cairo |
Apartments |
96 |
- |
28,473 |
160,119,287 |
5,624 |
- |
0 |
0.3 |
|
Village Garden Katameya |
East Cairo |
Standalone units |
115 |
36,190 |
35,851 |
226,452,991 |
3,143 |
3,853,266 |
2 |
1.7 |
|
Apartments |
1,004 |
202,700 |
731,205,703 |
3,607 |
- |
0 |
|||||
Village Gate |
East Cairo |
Apartments |
686 |
110,380 |
741,839,260 |
6,721 |
21,501,365 |
3 |
1.3 |
||
500 Feddan** |
East Cairo |
Standalone units |
924 |
418,635 |
527,707 |
4,854,809,500 |
5,130 |
4,854,809,500 |
100 |
30.2 |
|
Apartments |
5,541 |
524,916 |
1,768,682 |
11,897,041,616 |
5,187 |
11,897,041,616 |
100 |
||||
Capital Gardens** |
East Cairo |
Apartments |
2,454 |
- |
473,985 |
5,064,493,609 |
10,685 |
4,449,159,709 |
88 |
9.1 |
|
The Village* |
East Cairo |
Apartments |
468 |
- |
67,448 |
294,706,443 |
4,369 |
1,378,331 |
0 |
0.5 |
|
Hacienda Bay |
North Coast |
Standalone units |
557 |
474,481 |
213,638 |
2,994,779,583 |
4,352 |
1,309,722,064 |
44 |
9.7 |
|
Apartments |
1,637 |
334,362 |
2,409,735,028 |
7,207 |
718,317,542 |
30 |
|||||
Hacienda White 1* |
North Coast |
Standalone units |
37 |
42,058 |
17,709 |
267,845,883 |
4,482 |
- |
0 |
1.1 |
|
Apartments |
266 |
- |
40,609 |
355,579,780 |
8,756 |
17,959,998 |
5 |
||||
Hacienda White 2 |
North Coast |
Standalone units |
152 |
127,056 |
64,622 |
1,174,657,269 |
6,128 |
491,646,514 |
42 |
3.7 |
|
Apartments |
685 |
91,908 |
868,690,453 |
9,452 |
225,289,494 |
26 |
|||||
Ras El Hekma** |
North Coast |
TBA |
525 |
565,350 |
235,000 |
2,750,000,000 |
11,700 |
2,750,000000 |
100 |
4.9 |
|
Total |
|
|
22,229 |
4,906,256 |
6,965,208 |
55,559,173,992 |
35,785,400,487 |
64% |
100% |
||
|
Source: Company data. Note: *Construction complete. **Co-development. |
|||||||||||
|
|||||||||||||||||||||||||||||||||||||||||||
|