Last close As at 05/08/2026
GBP12.66
▲ −2.00 (−0.16%)
Market capitalisation
GBP1,703m
Research: Investment Companies
The Law Debenture Corporation (LWDB) has once again proved that while its structure may be unusual, its combination of a UK-biased investment trust and a portfolio of independent professional services (IPS) businesses can deliver for investors. IPS produced a fourth consecutive year of on-target high single-digit growth in FY21, while the investment portfolio bounced back after a tough 2020 in both capital and revenue terms. The IPS contribution to revenues (c 35% in FY21) gives fund managers James Henderson and Laura Foll at Janus Henderson increased flexibility to select lower- or non-yielding stocks that may have better growth potential. That said, the top contributors to performance in the year unusually included such stalwarts as Marks & Spencer and Shell. A 5.5% increase in total dividends for the year secures a 43rd year of growing or maintaining the payout, and the trust currently yields 3.3%.
Written by
The Law Debenture Corporation |
Outperforming in another strong year |
Investment trusts |
25 February 2022 |
Analysts
|
||||||||||||||||||||||||||||||||||||||||||||||||||||||||||||||||||||||||||||||||||||||||||||||||||||||||
The Law Debenture Corporation (LWDB) has once again proved that while its structure may be unusual, its combination of a UK-biased investment trust and a portfolio of independent professional services (IPS) businesses can deliver for investors. IPS produced a fourth consecutive year of on-target high single-digit growth in FY21, while the investment portfolio bounced back after a tough 2020 in both capital and revenue terms. The IPS contribution to revenues (c 35% in FY21) gives fund managers James Henderson and Laura Foll at Janus Henderson increased flexibility to select lower- or non-yielding stocks that may have better growth potential. That said, the top contributors to performance in the year unusually included such stalwarts as Marks & Spencer and Shell. A 5.5% increase in total dividends for the year secures a 43rd year of growing or maintaining the payout, and the trust currently yields 3.3%.
The analyst’s view
LWDB has been around for more than 130 years, but until recently its IPS business had been a sleepy, low-growth backwater that was as likely to deter potential investors in search of a largely UK equity investment trust as it was to attract them. However, two factors have worked to change this in the past four years: first, a new growth-focused IPS leadership team that has set a target of mid- to high single-digit annual growth and delivered it consistently, and second, a greater appreciation that IPS (c 18% of net asset value (NAV)) punches above its weight in terms of income generation (c 35% of net revenues in FY21), giving managers Henderson and Foll investment flexibility and helping to ensure continued dividend growth even as COVID-19 caused a c £50m hole in UK corporate dividends in 2020. The fund managers are cautiously optimistic on the outlook for equities, preferring cash-generative companies with strong management and balance sheets in a higher-inflation environment, but also continuing to back some of the earlier-stage growth names that drove performance in the previous year. While they retain the flexibility to invest up to 20% overseas, they currently see the greatest opportunities in the UK, where they invested a net £55m in FY21.
Reassessment sees shares move to a premium
In the past 12 months LWDB’s share price has moved from a persistent discount to NAV (long-term range of c 5–15%) to a small average premium of 0.8%. This has facilitated the issuance of c £40m in new shares over the past 12 months, which, along with an additional £50m in low-cost borrowing, gives significant firepower to both the fund managers and the IPS business to pursue attractive opportunities where they present themselves. While the current geopolitical strife may dent appetite for risk assets in the near term, we see the much lower volatility in LWDB’s discount/premium over the past 12 months as suggestive that any de-rating is unlikely to be severe or sustained, assuming no major systemic or market events.
Good growth continues for enlarged IPS business
LWDB’s IPS business has produced a fourth consecutive year of growth in earnings and profits, underlining the successful pivot to a more growth-orientated mindset following the appointment of CEO Denis Jackson (initially as chief commercial officer) during 2017 (Exhibit 1). For the business as a whole, the target of mid- to high single-digit profits growth was once again achieved (+9.1%), although the aggregate figure masks a slight decline in revenues from the corporate trusts business after a particularly strong year in 2020, and a jump in revenues for corporate services. This step up follows the transformative £20m acquisition early in the year of a company secretarial business from Konexo, a division of global law firm Eversheds Sutherland.
Exhibit 1: IPS performance summary
£m unless stated otherwise |
FY21 |
FY20 |
FY21 vs FY20 |
FY19 |
FY18 |
FY17 |
Compound growth rate, four years to end-2021 |
Net revenue |
|||||||
Pensions |
13.1 |
11.5 |
13.8% |
10.6 |
9.5 |
8.3 |
12.1% |
Corporate Trust |
9.8 |
10.8 |
(9.4%) |
9.0 |
7.9 |
7.9 |
5.5% |
Corporate Services |
18.8 |
12.2 |
53.4% |
12.2 |
11.0 |
11.0 |
14.3% |
Total net revenue |
41.6 |
34.5 |
20.6% |
31.8 |
28.4 |
27.1 |
11.3% |
PBT |
13.3 |
12.2 |
9.1% |
11.5 |
10.5 |
9.7 |
8.2% |
EPS (p) |
10.0 |
9.35 |
7.0% |
8.54 |
7.87 |
7.21* |
8.5% |
Source: The Law Debenture Corporation, Edison Investment Research. Note: *Excludes 2.72p of non-recurring realisation gains.
The corporate services business covers four business lines: corporate secretarial services (CSS), service of process, structured finance services and whistleblowing (through subsidiary Safecall). Even before the acquisition of the CSS business from Konexo, corporate services was the largest contributor to LWDB’s IPS revenues in each of the four preceding years. However, the 53.4% revenue growth for the division in FY21 does reflect the integration of the newly acquired business (bringing over 50 largely Manchester-based staff into the LWDB fold), and therefore should not necessarily be seen as a guide to future growth rates. Jackson points out that more than 99% of the new CSS business’s existing clients have been retained following the move, and new business wins during the year have included some of the largest companies in both the UK and the United States. The CEO argues that the acquisition has given LWDB critical mass in the CSS sector (having previously had fewer than five employees), and that the business has a brighter future as a core professional services business at LWDB, rather than a non-core part of the Eversheds Sutherland legal empire. The other areas of the corporate services business also saw good growth during FY21, with Safecall (an acquisition Jackson describes as having perhaps been made ‘10 years too early’ in 2007) adding 149 new corporate clients and seeing a 25% increase in reporting, increasingly through digital channels. Safecall has a new leader, Joanna Lewis, with previous CEO Graham Long having become chairman. The service of process business (focused on cross-border commercial transactions) ended the year slightly ahead after a tough 2020 when dealflow was hampered by the pandemic, and structured finance services (providing accounting and administrative services to special purpose vehicles), although a small division, also saw incremental growth during FY21.
There are two main strands to the pensions business: pension trustee services and the Pegasus outsourced administration division. Both have seen a change in leadership during FY21, with Vicky Paramour now heading up the trustee business and Sankar Mahalingham taking the reins at Pegasus. Revenues for the pensions business grew by 13.8% year-on-year in 2021 and are up a compound 12.1% pa over the past four years, an impressive outcome given its growth has been entirely organic (as opposed to corporate services, where the 14.3% compound annual revenue growth over four years was significantly assisted by the CSS acquisition from Konexo). Jackson describes LWDB’s pensions business as ‘rock solid’ and expects further growth opportunities following implementation of the Pensions Act 2021, which tightens up the oversight requirements for pension schemes, thus favouring an offering such as LWDB’s, which gives schemes access to expert trustee and administration services. The opening of LWDB’s Manchester office (following the CSS acquisition) means a greater opportunity to service the large number of businesses based outside London and the South East, while the firm also appointed its first Ireland-based trustee during the year.
The corporate trust business saw a decline in revenue (-£1.0m) during FY21, although Jackson argues that this should be seen in the light of a strong £1.8m increase in FY20. While down on the prior year, the FY21 number is 8.8% above the pre-pandemic FY19 total. Corporate trust – which represents the foundation of LWDB, dating back to 1889 – is focused on loans and bonds, acting as a bridge between the borrower/issuer and the lender/investor, as well as providing escrow services to support transactions, for example mergers and acquisitions (M&A). The business received a pandemic boost in 2020 owing to the high pace of debt issuance; however, this slowed significantly in 2021, while the expected uptick in post-issue work (restructuring and bankruptcy) has been slow to materialise, as support from central government to enterprises (such as COVID loans and the furlough scheme) has arguably only delayed some inevitable failures, according to LWDB’s CEO. Jackson points to the historically low level of UK corporate bankruptcies as an anomaly that is bound to reverse. ‘The last airline to go bust in the UK was before the pandemic, which makes no sense’, he says. ‘While we don’t wish ill to anyone, with governments all saying we should go back to work and withdrawing support, it is inevitable that some companies with stretched balance sheets will run into trouble’. The CEO points out that an anticipated higher level of corporate restructuring would have benefits not just for LWDB’s corporate trust business but across its divisions, including work with pension schemes and company secretarial functions.
Looking ahead, Jackson says the IPS businesses could benefit from higher inflation, as many contracted (rather than one-off) revenues are inflation-linked, in most cases without a cap. These uplifts are accounted for when they occur, so with inflation accelerating from a low base, there is limited impact in the FY21 numbers, but a much higher level is expected in FY22.
Reflecting on his time at LWDB so far, Jackson concludes: ‘We are a much bigger business today than we were four years ago. We have gone from about 100 people to about 250, of whom only 55 are from the CSS acquisition, so most of the growth has been organic. Our net revenues have gone from £27m to £42m. We have a younger workforce and we are developing a career framework. We have set out what we want to achieve in terms of consistent mid to high single digit growth, and having achieved that for four years in a row, people are getting the point. Now we have to do it five years in a row’.
Exhibit 2: Fair valuation of IPS business
£000s unless stated |
31 December |
30 June |
31 December |
30 June |
IPS valuation |
||||
IPS EBITDA |
15,369 |
13,665 |
13,335 |
11,734 |
EBITDA multiple (x) |
10.8 |
10.1 |
9.4 |
8.7 |
Operational value of IPS |
165,985 |
138,017 |
125,349 |
102,086 |
IPS surplus net assets |
4,041 |
11,696 |
10,605 |
9,970 |
IPS fair value |
170,026 |
149,713 |
135,954 |
112,056 |
IPS fair value per share (p) |
138.9 |
122.6 |
115.1 |
94.6 |
LWDB fair value |
||||
LWDB fair value per share as per IFRS financial statements (p) |
717.9 |
695.5 |
615.2 |
515.6 |
IPS fair value adjustment per share (p) |
111.0 |
105.5 |
95.1 |
75.2 |
Debt fair value adjustment (p) |
(41.0) |
(34.0) |
(44.2) |
(40.4) |
LWDB fair value NAV per share (p) |
767.2* |
766.9 |
646.7* |
543.9* |
IPS book value (IFRS) as % of total |
3.9% |
2.5% |
3.3% |
3.8% |
IPS fair value as % total |
18.1% |
16.0% |
17.8% |
17.4% |
Source: The Law Debenture Corporation, Edison Investment Research. Note: *After deducting dividends.
As shown in Exhibit 2, the operational value of IPS (based on LWDB’s internally derived multiple) rose by 32.4% in FY21 and the fair value of IPS per share rose by 20.7%, compared with growth of 18.3% and 11.2% respectively in FY20. At 138.9p per share (an increase of 13.3% since the H121 results), the fair value of IPS accounted for 18.1% of LWDB’s NAV per share (with debt at fair value), a higher share than at either end-H121 or end-FY20. The IFRS book value rose from 19.9p to 27.9p per share (+39.9%) in FY21; the 111.0p per share fair value adjustment was a 16.7% increase from 95.1p in FY20.
|
Exhibit 3: Overall IPS revenue growth once more driven by divisional divergence in FY21 |
|
|
Source: The Law Debenture Corporation, Edison Investment Research |
The fund managers: James Henderson and Laura Foll
The managers’ view: Early signs of value and income rotation
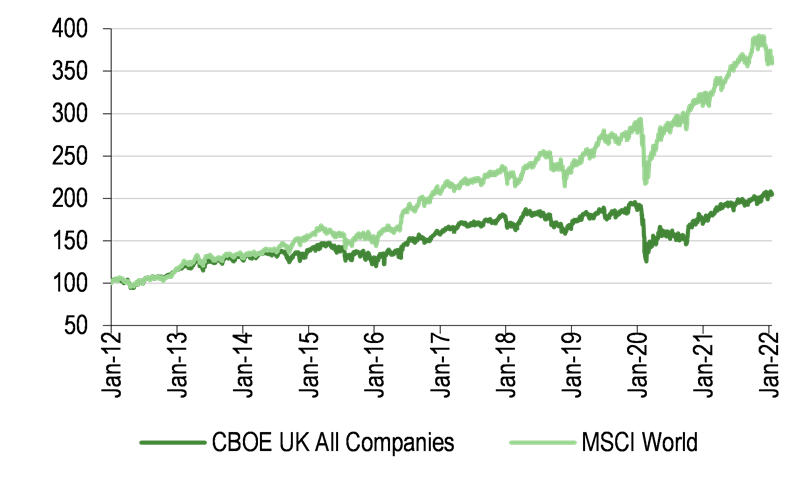
Henderson and Foll say that what sets LWDB apart from peers in the Association of Investment Companies’ (AIC) UK Equity Income sector is the flexibility afforded to them as managers by the fact that LWDB’s IPS business accounts for c 18% of NAV but supplies around one-third of group income (10.0p of the 28.1p net revenue return per share in FY21). This means they have been able to invest in lower- or non-yielding stocks and have not been forced into the high-yielding blue-chips that dominate many income portfolios but have struggled to achieve capital performance in recent years. Foll points out that on a three-year view, the higher-yielding large- and mid-cap UK stocks have underperformed their lower-yielding counterparts by a ‘staggering’ 26pp, which she describes as ‘such a headwind’ for managers who are trying to achieve an above-market yield from a UK equity portfolio. In addition, LWDB’s c 18% overseas exposure has proved beneficial in an environment where UK equities have severely lagged the rest of the world (Exhibit 4).
|
Exhibit 4: UK still represents a value opportunity versus the rest of the world |
|||||||||||||||||||||||||||||||||||||||||||
UK and world equity indices, total return over 10 years to end-January (£) |
Forward P/E valuations of Datastream indices (at 23 February 2022) |
||||||||||||||||||||||||||||||||||||||||||
|
|
||||||||||||||||||||||||||||||||||||||||||
|
Source: Refinitiv, Edison Investment Research |
|||||||||||||||||||||||||||||||||||||||||||
However, more recently these trends of UK and high yield underperformance have begun to reverse, as investors increasingly question the high valuations of ‘growth’ companies such as US mega-cap technology names, which had previously turbo-charged market returns across the Atlantic in the past few years. As such, Henderson and Foll invested a net £55m (through a combination of borrowings and the proceeds of share issuance) in UK equities during FY21, aiming to take advantage of the changing environment of higher inflation and interest rates. Henderson says that having yielded materially below the market average for some time, LWDB’s portfolio yield is now only at a slight discount to that of the benchmark, with arguably better dividend growth potential according to the fund managers, given its greater focus on names outside the largest 100 companies. ‘Our portfolio earnings growth forecast is c 25% [in 2022] compared with c 13% for the benchmark, and choosing companies with genuine sales and earnings growth is the way to increase income in the future. For me, that is the case for equities in an inflationary environment’, he adds.
Speaking ahead of the Russian invasion of Ukraine, Henderson and Foll remained optimistic that the market was absorbing a lot of the potentially bad news around higher interest rates and inflation as well as geopolitical tension. ‘It is important to remember that interest rates are only going up because other parts of the economy are doing quite well, and there is actually less stress on corporate balance sheets than there would normally be going into a tightening cycle’, said Henderson. Although markets have taken a hit from the incursion (the main UK blue-chip index was down c 3.8% on the day of the attack, although writing on 25 February there has so far been a slight bounce back), the managers may see this as a buying opportunity, given their preference for adding to favoured stocks on weakness.
Asset allocation
Current portfolio positioning
LWDB’s investment portfolio remains broadly diversified, with the number of holdings rising to 149 at end-December 2021, from 137 a year earlier. Concentration in the top 10 holdings declined, from 20.2% of the portfolio to 18.6%. Holdings are spread across large, medium-sized and smaller companies; Henderson points out that while mid- and small-caps tend to outperform over time, ‘they don’t do it tidily’, so holding some blue-chip companies can offset a degree of this volatility and bring balance to the overall portfolio.
Exhibit 5: Top 10 holdings (as at 31 December 2021)
Company |
Country |
Sector |
Portfolio weight % |
|
31 December 2021 |
31 December 2020 |
|||
GlaxoSmithKline |
UK |
Pharmaceuticals & biotechnology |
2.7 |
2.8 |
Shell |
UK |
Oil & gas producers |
2.0 |
1.9 |
Barclays |
UK |
Banks |
2.0 |
0.9 |
HSBC |
UK |
Banks |
2.0 |
1.5 |
BP |
UK |
Oil & gas producers |
1.9 |
1.8 |
Rio Tinto |
UK |
Mining |
1.9 |
2.5 |
Accsys Technologies |
UK |
Construction materials |
1.6 |
1.4 |
Herald Investment Trust |
UK |
Pooled equity investments |
1.5 |
2.2 |
National Grid |
UK |
Electricity |
1.5 |
1.5 |
Severn Trent |
UK |
Gas, water & multiutilities |
1.5 |
1.4 |
Top 10 (% of holdings) |
18.6 |
20.2 |
||
Source: The Law Debenture Corporation, Edison Investment Research
Geographical and sector weightings (Exhibits 6 and 7) have not changed significantly over the course of 2021 and tend to be an output of stock selection. In general, overseas holdings are in companies where there is no compelling UK equivalent (such as Toyota), although the very small Pacific ex-Japan exposure is through a more diversified regional fund, Scottish Oriental Smaller Companies Trust.
Exhibit 6: Portfolio geographic exposure (% unless stated)
Portfolio end-December 2021 |
Portfolio end-December 2020 |
Change (pp) |
Allocation guidelines |
|
UK |
82.6 |
82.0 |
0.6 |
55–100 |
Europe ex-UK |
10.0 |
10.6 |
(0.6) |
0–10 |
North America |
5.4 |
5.4 |
0.0 |
0–20 |
Japan |
1.1 |
1.1 |
0.0 |
0–10 |
Pacific ex-Japan |
0.7 |
0.9 |
(0.2) |
0–10 |
Other |
0.2 |
0.0 |
0.2 |
0–10 |
100.0 |
100.0 |
Source: The Law Debenture Corporation, Edison Investment Research
Foll says that new purchases during FY21 were ‘quite an esoteric list’, in contrast to FY20 when there was a modest tilt towards ‘reopening’ and cyclical stocks such as Marks & Spencer and the high street banks. New FY21 positions such as French healthcare giant Sanofi (£8.4m invested) and Anglo-French DIY group Kingfisher (which owns B&Q and Screwfix) are ‘very stock-specific’; Foll says that while Kingfisher might be thought of as a ‘pandemic winner’ because of the popularity of home improvements during COVID-19 lockdowns (leading analysts to forecast negative sales growth next year), she and Henderson believe that having learned some basic DIY skills online, many customers will continue to ‘do it themselves’ even though trades have reopened. Meanwhile, in the trade-orientated space, the managers believe the earnings growth potential of Screwfix is underappreciated, particularly given plans for an expansion of the business in France. Kingfisher (£11.7m, invested in stages as is usual for LWDB’s managers) was the biggest purchase in FY21, but was closely followed by Flutter Entertainment (£11.0m), bought as a play on the liberalisation of gambling rules in the United States. ‘It used to be a really miserable experience gambling on horses or football in the US’, says Henderson, explaining that sports betting was illegal in most states until recently, with online gambling still in its nascent stages. ‘To us, Flutter is the best operator and we think the US opening up will power it forward’.
Barclays Bank (£8.8m invested) is a continuation of the increase in high street banks that was begun in FY20, while the South Africa-based but AIM-listed Jubilee Metals (£8.8m invested) rounds out the list of the five largest purchases. Jubilee extracts platinum group metals (PGM) from tailings – essentially waste from other mining operations – making it a double play from an environmental perspective, given the need for PGM in electric vehicles, as well as the fact the firm is reusing/reducing waste. ‘It’s quite a small company but is growing’, says Foll.
Exhibit 7: Portfolio sector exposure (% unless stated)
Portfolio end-December 2021 |
Portfolio end-December 2020 |
Change (pp) |
|
Financials |
23.8 |
23.8 |
0.0 |
Industrials |
20.7 |
22.0 |
(1.3) |
Oil & gas |
10.1 |
11.6 |
(1.5) |
Basic materials |
9.7 |
9.3 |
0.4 |
Consumer services |
8.8 |
8.9 |
(0.1) |
Consumer goods |
7.4 |
6.2 |
1.2 |
Health care |
7.2 |
5.2 |
2.0 |
Utilities |
4.4 |
4.8 |
(0.4) |
Pooled equity investments |
3.2 |
4.7 |
(1.5) |
Telecommunications |
2.6 |
1.9 |
0.7 |
Technology |
1.6 |
1.6 |
0.0 |
100.0 |
100.0 |
Source: The Law Debenture Corporation, Edison Investment Research
The largest sales during the year were a mixture of profit-taking and M&A activity. Applied Materials (see Performance section) was a complete exit with proceeds of £12.6m; the second-largest sale, Croda (£11.3m) was also a complete exit of a very long-held position that Henderson describes as ‘individually the best investment I have ever made’, having begun to buy the shares at a price around £1.70 and sold at c £90 per share. The holding in Ceres Power (which was the largest holding at end-FY20, accounting for 3.0% of the portfolio) was trimmed (proceeds of £7.5m) to lock in profits; the share price has since fallen significantly as investors increasingly shun early-stage technologies, particularly in renewable energy, although the sale proceeds in FY21 alone far exceed the initial investment in the company. Aerospace engineering firm Meggitt and St Modwen Properties were both taken over during the year, with Meggitt being acquired by a US peer while St Modwen was subject to a private equity buyout.
Outperforming over the short and long term
Exhibit 8: Five-year discrete performance data (financial years)
12 months ending |
Share price |
NAV |
CBOE UK All Cos (%) |
CBOE UK 250 (%) |
MSCI World (%) |
31/12/17 |
22.2 |
15.6 |
14.0 |
18.3 |
12.4 |
31/12/18 |
(11.6) |
(6.2) |
(9.8) |
(14.7) |
(2.5) |
31/12/19 |
24.5 |
16.6 |
19.3 |
30.6 |
23.4 |
31/12/20 |
12.9 |
2.0 |
(10.9) |
(7.7) |
12.9 |
31/12/21 |
20.3 |
25.1 |
18.4 |
18.7 |
23.5 |
Source: Refinitiv. Note: All % on a total return basis in pounds sterling.
LWDB’s NAV and share price returns outperformed the broad UK equity market during FY21 (Exhibit 8), buoyed by another year of high single-digit growth for the IPS business (net revenue return per share of 10.0p), as well as resurgent performance from the investment portfolio, providing a capital return of 94.6p per share and a revenue return of 18.1p per share (all based on the average number of shares in issue). Performance for the 12 months to end-January 2022 (Exhibit 9) has been even stronger, with NAV and share price total returns of 28.6% versus 19.3% for the CBOE UK All Companies index, although more recently the performance has been broadly flat. Factors underlying the outperformance include the tilt (begun in late FY20) towards more cyclical stocks such as banks and insurance companies, which also tend to benefit in an environment of higher inflation and interest rates. However, as a bottom-up portfolio, the largest individual impacts on performance will always tend to come from stock selection (see the five largest contributors and detractors in Exhibits 10 and 11, discussed below).
|
Exhibit 9: Investment trust performance to 31 January 2022 |
|
Price, NAV and benchmark total return performance, one-year rebased |
Price, NAV and benchmark total return performance (%) |
|
|
|
Source: Refinitiv, Edison Investment Research. Note: Three, five and 10-year performance figures annualised. |
|
Exhibit 10: Top five contributors to FY21 performance
Stock |
Share price total return (%) |
Contribution (£m) |
Marks & Spencer |
69.8 |
5.7 |
Applied Materials |
85.2 |
5.4 |
Senior |
64.7 |
5.0 |
Shell |
34.2 |
4.5 |
Royal Mail |
61.2 |
4.5 |
Total |
25.1 |
Source: The Law Debenture Corporation, Edison Investment Research
As shown in Exhibit 10, retailer Marks & Spencer was the top contributor to portfolio performance (in absolute terms) during FY21. Foll says this was a combination of a strong bounce back from lockdown restrictions as well as positive management ‘self help’ action, such as improving the website, partnering with Ocado for home delivery of groceries and setting the pricing of some food and clothing items at more affordable levels. The managers have since trimmed the position to lock in gains. The holding in Applied Materials, a US semiconductor equipment stock that was also among the top contributors over three years, was sold due to valuation concerns prior to the year-end; year-to-date in 2022 its share price is down by c 16%. The position in Royal Mail has also been reduced and was less than 80bp at end-FY21. Aerospace name Senior was a beneficiary of the rollout of COVID-19 vaccinations feeding through into increased demand for air travel; its share price was also boosted by an ultimately unsuccessful bid from a private equity buyer. While Shell was a top contributor in absolute terms, thanks to its high level of cash generation, it was a relative detractor because of its large weighting in the index. However, LWDB’s portfolio is deliberately diversified and an index-weight position (c 6% versus the portfolio weighting of 2% for Shell) for a mega-cap stock would be unlikely because, says Foll, ‘there are a lot of other things we could be doing with that 4%’.
Exhibit 11: Top five detractors from FY21 performance
Stock |
Share price total return (%) |
Contribution (£m) |
AFC Energy |
(37.9) |
(3.9) |
Ceres Power |
(24.5) |
(3.6) |
SIMEC Atlantis Energy |
(92.7) |
(3.5) |
Rio Tinto |
0.6 |
(2.2) |
ITM Power |
(23.6) |
(2.1) |
Total |
(15.3) |
Source: The Law Debenture Corporation, Edison Investment Research
Three of the largest detractors (Ceres Power, ITM Power and Rio Tinto) were among the largest contributors in FY20. Ceres and ITM, along with fellow detractors AFC Energy and SIMEC Atlantis Energy, are all in the alternative energy space (fuel cells, electrolysis and waste-to-energy), and to a degree suffered a de-rating as market participants focused less on the scale of the future opportunities and more on the lack of current revenues. SIMEC Atlantis Energy in particular has suffered on the back of planning delays for its proposed plastic pellet power station (converted from coal-fired) in Newport, South Wales. Rio Tinto saw its share price decline c 17% during the year; although its interim and special dividends amounting to c £4 per share were enough to bring its total return into positive territory, the income was paid to LWDB’s revenue account (and subsequently used towards the payment of dividends), and the negative contribution only reflects the capital performance. On 23 February, Rio Tinto, which remains a top 10 holding for LWDB, announced further special and final dividends of $4.69 (c £3.50) in respect of FY21.
Exhibit 12: Share price and NAV total return performance, relative to indices (%)
|
One month |
Three months |
Six months |
One year |
Three years |
Five years |
10 years |
Price relative to CBOE UK All Companies |
0.5 |
2.5 |
2.3 |
7.8 |
32.3 |
42.7 |
64.7 |
NAV relative to CBOE UK All Companies |
0.3 |
(0.2) |
(0.2) |
7.8 |
17.8 |
22.7 |
36.6 |
Price relative to CBOE UK 250 |
7.2 |
10.7 |
13.3 |
14.8 |
27.1 |
37.0 |
21.8 |
NAV relative to CBOE UK 250 |
7.0 |
7.8 |
10.6 |
14.8 |
13.1 |
17.7 |
1.0 |
Price relative to MSCI World |
4.8 |
6.1 |
3.6 |
7.4 |
1.1 |
2.5 |
(9.6) |
NAV relative to MSCI World |
4.6 |
3.2 |
1.1 |
7.4 |
(10.0) |
(11.9) |
(25.1) |
Source: Refinitiv, Edison Investment Research. Note: Data to end-January 2022. Geometric calculation.
LWDB’s investment flexibility (including the ability to hold lower- or non-yielding stocks because of the income contribution from IPS, its multi-cap approach and c 17% overseas allocation) has helped it to outperform the broad UK equity market over most periods, as shown in Exhibits 12 and particularly 13. In the 12 months to end-January 2022 it has also outperformed the MSCI World Index, as the US equity market – a key driver of global returns over the past 10 years – has experienced a significant sell-off, particularly in higher-growth sectors.
|
Exhibit 13: NAV performance versus CBOE UK All Companies Index over three years |
|
|
Source: Refinitiv, Edison Investment Research |
Peer group comparison
Exhibit 14: UK Equity Income peer group as at 23 February 2022*
% unless stated |
Market cap £m |
NAV TR |
NAV TR |
NAV TR |
NAV TR |
Ongoing |
Perf. |
Discount |
Net |
Dividend |
Law Debenture Corporation |
969.9 |
17.8 |
35.4 |
51.8 |
158.6 |
0.5 |
No |
2.0 |
113 |
3.5 |
Aberdeen Standard Equity Inc Trust |
169.8 |
13.5 |
2.1 |
7.5 |
85.8 |
0.9 |
No |
(4.7) |
113 |
6.2 |
BlackRock Income and Growth |
39.0 |
12.2 |
16.2 |
21.7 |
95.8 |
1.2 |
No |
(9.6) |
105 |
3.9 |
BMO Capital & Income |
336.7 |
11.3 |
15.9 |
28.4 |
107.1 |
0.6 |
No |
(1.5) |
107 |
3.7 |
BMO UK High Income Units |
113.5 |
1.9 |
10.1 |
11.0 |
76.5 |
1.0 |
No |
(5.2) |
102 |
4.5 |
Chelverton UK Dividend Trust |
41.5 |
19.4 |
25.2 |
22.2 |
238.3 |
2.5 |
No |
(3.9) |
137 |
5.5 |
City of London |
1,790.7 |
20.5 |
16.2 |
24.7 |
116.1 |
0.4 |
No |
0.6 |
109 |
4.8 |
Diverse Income Trust |
404.4 |
6.7 |
31.7 |
42.2 |
213.7 |
1.1 |
No |
0.1 |
100 |
3.4 |
Dunedin Income Growth |
437.1 |
0.7 |
20.5 |
30.8 |
97.3 |
0.6 |
No |
0.8 |
108 |
4.4 |
Edinburgh Investment Trust |
1,053.2 |
16.8 |
12.8 |
13.0 |
115.1 |
0.4 |
No |
(10.0) |
105 |
3.9 |
Finsbury Growth & Income |
1,872.4 |
3.5 |
15.2 |
42.4 |
211.8 |
0.6 |
No |
(4.7) |
101 |
2.0 |
Invesco Select UK Equity |
139.4 |
21.7 |
28.3 |
30.1 |
173.6 |
0.9 |
No |
(4.8) |
110 |
3.6 |
JPMorgan Claverhouse |
418.2 |
12.6 |
16.6 |
24.1 |
124.0 |
0.7 |
No |
(2.7) |
116 |
4.4 |
JPMorgan Elect Managed Inc |
78.4 |
15.5 |
15.4 |
19.3 |
95.5 |
0.8 |
No |
(1.2) |
105 |
4.5 |
Lowland |
353.3 |
16.8 |
12.2 |
12.9 |
112.5 |
0.6 |
No |
(7.5) |
114 |
4.6 |
Merchants Trust |
730.3 |
31.5 |
39.5 |
50.4 |
151.0 |
0.6 |
No |
1.2 |
110 |
4.8 |
Murray Income Trust |
985.0 |
9.5 |
23.9 |
35.4 |
112.1 |
0.5 |
No |
(7.0) |
109 |
3.9 |
Schroder Income Growth |
211.9 |
12.7 |
16.2 |
23.4 |
118.7 |
0.8 |
No |
0.4 |
113 |
4.2 |
Shires Income |
81.4 |
11.5 |
24.9 |
33.3 |
137.8 |
1.0 |
No |
(3.7) |
121 |
5.2 |
Temple Bar |
804.5 |
20.9 |
7.5 |
14.4 |
97.0 |
0.5 |
No |
(2.2) |
107 |
3.2 |
Troy Income & Growth |
232.1 |
9.5 |
8.2 |
14.8 |
94.7 |
0.9 |
No |
0.1 |
100 |
2.6 |
Simple average (21 funds) |
536.3 |
13.7 |
18.8 |
26.4 |
130.1 |
0.8 |
(3.0) |
110 |
4.1 |
|
LWDB rank in peer group |
5 |
6 |
2 |
1 |
5 |
18 |
1 |
5= |
17 |
Source: Morningstar, Edison Investment Research. Note: *Performance as at 22 February 2022 based on cum-fair NAV. TR = total return. Net gearing is total assets less cash and equivalents as a percentage of net assets.
LWDB has been a member of the Association of Investment Companies’ UK Equity Income sector since May 2019, when it moved from the Global sector. In its previous peer group, it had always been an outlier given its high UK weighting. The UK Equity Income sector rules permit up to 20% overseas investment; at end-January 2022, average UK equity exposure across the peer group was 88% (LWDB’s was c 83% at end-December 2021).
UK Equity Income is one of the largest AIC sectors, with 21 constituents accounting for £12bn of assets. LWDB is the fifth largest, with a market cap close to £1bn. Its NAV total return performance has been well above average over one, three, five and 10 years, ranking sixth, second, first and fifth, respectively. Ongoing charges are among the lowest in the group, at 0.50% (end-FY21) compared to an already competitive sector average of 0.82%. None of the funds in the sector has a performance fee. The range of discounts and premiums to NAV is relatively narrow; LWDB tops the ratings with a premium of 2.0% (as of 23 February) versus an average discount of 3.0%, having seen a significant re-rating in recent years as investors have begun to appreciate its unique offering. Gearing of 13% at end-January is moderately above the 10% average, and the 3.5% dividend yield is towards the lower end of the peer group range.
Dividends
LWDB has achieved a 43rd consecutive year of increasing or maintaining its dividend, with the FY21 final payment of 8.375p bringing the total for the year to 29.0p, a 5.5% increase on the FY20 total dividend of 27.5p. Following a tough 2020 when UK corporate dividends fell by 44% and LWDB’s own portfolio income was down 38.6%, FY21 has represented a significant bounce-back, with a revenue return from the investment trust of 18.1p per share, a 49.3% year-on-year increase, while income from IPS (10.0p per share) was also up by 7.0%. While the FY21 dividend will be partly uncovered (50% of the first three quarterly dividends for FY21 was paid out of capital reserves), the revenue reserve remains healthy at £27.4m, or 22.4p per share at 31 December 2021. The board hopes to return to a dividend fully covered by income in FY22.
With effect from the start of FY20, LWDB has paid dividends quarterly rather than semi-annually, in July, October, January and April. Annual dividends have grown at a compound rate of 11.7% pa from FY16 to FY21 (see Exhibit 15).
|
Exhibit 15: Dividend history since FY16 |
|
|
Source: The Law Debenture Corporation, Edison Investment Research |
Fund profile: Unusual hybrid with distinguished history
Founded in 1889, LWDB is unusual in that it is an investment trust but also has an operating business set up to facilitate the issue of corporate debentures, an area that still provides a significant revenue stream today. At end-FY21 (31 December), the diversified investment portfolio made up c 82% of fair value NAV, while the IPS business, which has three divisions – pensions, corporate trusts and corporate services – accounted for c 18% of NAV. The IPS business has always provided a significant revenue stream to the company, typically c 30% of the total (c 35% in FY21).
The investment portfolio is managed with the aim of achieving long-term capital growth and a steadily increasing income from a portfolio of c 130–150 stocks, overseen by James Henderson and Laura Foll at Janus Henderson Investors. There is a bias towards the UK (c 82% of the portfolio at end-FY21), although overseas stocks are also held. The revenue contribution from the IPS business gives the managers more freedom to invest in lower-yielding stocks while still allowing the trust to keep up its long record of maintaining or increasing its annual dividend (+5.5% in FY21).
LWDB is a constituent of the AIC’s UK Equity Income sector and measures its investment performance versus a broad UK stock market index (for comparison purposes in this note we have used the CBOE UK All Companies Index). The trust is structurally geared through four tranches of long-term debt (par value of £165m) at a blended interest rate of c 4.0%.
At the corporate level, LWDB is led by CEO Denis Jackson, supported by chief operating officer, Trish Houston, chief financial officer, Hester Scotton and general counsel, Kelly Stobbs.
Investment process: Fundamental multi-cap approach
LWDB’s investment portfolio is managed on a bottom-up basis by co-managers Henderson and Foll, aiming to provide investors with a diverse selection of quality companies, mainly made up of those listed in the UK, although they have the flexibility to invest in overseas stocks where there is no compelling UK equivalent. As with their other portfolios (which include Lowland Investment Company and Henderson Opportunities Trust), they run a relatively long list of stocks, broadly spread by sector and market capitalisation, in order to mitigate company-specific risk. The managers invest directly in the UK, North America, Japan and Europe (where their Janus Henderson colleague James Ross is responsible for stock selection), while the small allocation to Asia-Pacific ex-Japan and other markets tends to come via funds.
Investment choice is based on a rigorous assessment of company fundamentals, with a focus on finding growing businesses whose current share prices are not believed to reflect their long-term growth prospects. Henderson and Foll are able to draw on the broad global research resources of Janus Henderson Investors, which can be particularly helpful in terms of overseas stock selection.
The managers tend to build and exit positions gradually, with an average starting position of c 0.3% of the portfolio (with c 149 stocks, the overall average position size is c 0.7%). Portfolio turnover is relatively low, at 16.6% for FY21 compared with 16.1% for FY20, implying a holding period of more than six years. The managers will gently trim positions that have done well and may also sell out of holdings where there has been a deterioration in fundamentals.
LWDB’s approach to ESG
LWDB approaches environmental, social and governance (ESG) issues in a variety of ways. On the investment side, Janus Henderson’s policy is to discuss any material issues directly with investee companies and monitor for improvement. The firm says fund managers are not afraid to exit positions where investee management fails to deliver expected improvements, while they favour companies that are actively seeking to address ESG concerns. ESG issues are considered both directly by the fund managers and also by the experienced responsible investing team at Janus Henderson. At present they do not explicitly screen out companies based on ESG ratings, so ratings are still an emerging area and the data quality is not always consistent.
Many of the IPS operational areas are focused on providing governance benefits to clients and their stakeholders. Within the IPS business itself, the move to a new ‘green’ head office building in 2020 allowed for the digitisation of decades of paperwork and a move to new paperless ways of working. The firm monitors its carbon footprint and anticipates a reduction in business travel post-pandemic, given the robustness of many of the virtual meeting solutions that have been widely adopted over the past year. Investment trusts do not generally have any employees, but as an obvious exception to this, LWDB says it is proud that all its three senior leadership appointees in the past year are women, and it is also committed to further improving ethnic diversity in its senior workforce.
Gearing: New debt provides low-cost extra firepower
LWDB is permitted to gear up to 50% of net assets, although in practice it has a working range of 10% net cash to 20% net geared. To reflect the growth in its assets and allow greater flexibility to both the fund managers and the IPS business, an additional £50m of borrowing was arranged in November 2021, made up of two tranches of loan notes: £20m maturing in 2041 with a coupon of 2.54% and £30m maturing in 2050 with a coupon of 2.53%. This is in addition to the two existing tranches of long-term debt (£40m of 6.125% guaranteed bonds maturing in 2034 and £75m of 3.77% senior secured bonds maturing in 2045) and brings the total blended interest rate on borrowings down from 4.59% to 3.97%. Because of the current low rates of bond yields compared with the higher coupons on LWDB’s debt, the fair or market value of the debt is currently £214.5m, compared with £165.0m for the par value. Using the fair value of the debt, maximum gross gearing currently stands at 22.3%, with net gearing of 13.0% at end-January 2022 reflecting cash offsetting some of the borrowings.
Fees and charges: Highly competitive fee structure
Janus Henderson Investors, which manages LWDB’s investment portfolio, is paid an annual management fee of 0.30% of net assets (excluding the net assets of the IPS business). This was previously charged 100% to the revenue account, but since the start of FY19 has been allocated 25:75 between the revenue and capital accounts, reflecting the expected split of future returns. There is no performance fee, and LWDB’s ongoing charges (0.50% at end-FY21) are among the lowest of any investment trust, and 0.32pp below the average for the AIC UK Equity Income sector (see Exhibit 14).
Capital structure
|
Exhibit 18: Major shareholders |
Exhibit 19: Average daily volume |
|
|
|
Source: Bloomberg, as at 24 December 2021. |
Source: Refinitiv. Note: 12 months to 23 February 2021. |
|
Exhibit 18: Major shareholders |
|
|
Source: Bloomberg, as at 24 December 2021. |
|
Exhibit 19: Average daily volume |
|
|
Source: Refinitiv. Note: 12 months to 23 February 2021. |
Despite its hybrid nature, LWDB is structured as a conventional investment trust, with one class of share. Until recently, although LWDB’s board has long had the authority to repurchase up to 14.99% of the shares, or to allot shares up to 5% of the issued share capital, allotments and repurchases had largely been in respect of the employee share ownership scheme. However, with the shares having moved from a discount to a generally sustained premium to NAV (see Exhibit 16), more than £40m has been raised from share issuance since the start of FY21 (Exhibit 17), helping to fund the acquisition of CSS and providing additional investable resources for the fund managers. As at 23 February 2022, there were 123.9m ordinary shares in issue.
As shown in Exhibit 18, LWDB’s shareholder base is diverse but increasingly retail-orientated, with the largest three holders (accounting for 25.1% of the shares) being platforms used by private investors. Trading liquidity (Exhibit 19) remains good, with an average of 168,219 shares (0.14% of the average number of shares in issue) changing hands daily in the 12 months to 23 February 2022.
The board
Exhibit 20: LWDB’s board of directors
Board member |
Date of appointment |
Remuneration in FY21 |
Shareholdings at end-FY21* |
Robert Hingley (chairman) |
Oct 2017 (Apr 2018) |
£87,550 |
4,870 |
Denis Jackson (CEO) |
January 2018 |
£364,000 |
3,394 |
Trish Houston (COO) |
September 2020 |
£271,000 |
1,564 |
Mark Bridgeman (audit & risk cttee chair) |
March 2013 |
£56,650 |
4,513 |
Tim Bond |
April 2015 |
£45,320 |
0 |
Claire Finn (remuneration cttee chair) |
September 2019 |
£49,547 |
0 |
Clare Askem |
June 2021 |
£25,275** |
0 |
Pars Purewal |
December 2021 |
£5,868** |
0 |
Source: The Law Debenture Corporation. Note: *Outright shareholdings only (excludes share options). **£45,320 pro rata.
LWDB’s board is currently made up of two executive directors (CEO Denis Jackson and chief operating officer Trish Houston) and six non-executive directors (NEDs). The number of NEDs will fall to five following the retirement of Mark Bridgeman at the AGM in April 2022, having completed the recommended maximum nine years’ service. Two new NEDs joined the board during FY21: Clare Askem in June and Pars Purewal in December. Askem has a background in retail (including as managing director of Habitat at J Sainsbury), with particular experience in business change and digital transformation. Purewal is a former senior partner at PricewaterhouseCoopers, with extensive experience in accounting, investment trusts and professional services.
NEDs’ FY21 fees (Exhibit 19) were unchanged on FY20 but are increasing in FY22 to £92,000 (chairman), £47,600 (director) plus £5,950 (from £5,665) for committee chairs.
|
|
Research: Healthcare
FY21 results highlight delivery on key elements of Oasmia’s ongoing transformation. Notably, ‘rightsizing’ the business and prudent cost control has brought the underlying cash burn rate down to c SEK10m per month in 2021. With the fully secured rights issue expected to raise gross proceeds of c SEK150m, management has guided it can fund operations for 18–24 months. We anticipate material progression can be made across the pipeline during this time, with clinical progress expected from Cantrixil and Docetaxel micellar and the start of commercial royalties from Apealea sales in Europe. Separate financing requirements will be considered for any potential bolt-on acquisitions to the pipeline. We maintain our valuation at SEK2.89bn but place our financial forecasts under review, pending publication of the prospectus and closing of the rights issue.