Orexo
Written by
Orexo |
Zubsolv gathers momentum |
Q316 results |
Pharma & biotech |
4 November 2016 |
Share price performance
Business description
Next events
Analysts
|
||||||||||||||||||||||||||||||||||||||||||||||||||||||||||||||
Orexo’s Q316 results delivered positive momentum in Zubsolv revenues and market share. Exclusive preferred status on Maryland FFS Medicaid from July boosted Zubsolv’s market share in the public segment by 1.4pp. In the coming quarters we expect further US market share gains. Orexo is targeting a disproportionally higher share of new patients embarking on opioid dependence treatment, enabled by continued salesforce optimisation. The impact of the US Department of Health and Human Services’ (HHS) increased 275 patient cap coupled with CARA 2016 implementation from H217 and ongoing progress in improving market access will support this. Nevertheless, the share price performance remains muted ahead of a Q416 court decision on the Actavis IP litigation.
Year end |
Revenue (SEKm) |
PBT* |
EPS* |
DPS |
P/E |
Yield |
12/14 |
570.3 |
(52.6) |
(1.6) |
0.0 |
N/A |
N/A |
12/15 |
643.2 |
(191.2) |
(5.7) |
0.0 |
N/A |
N/A |
12/16e |
728.1 |
42.8 |
1.0 |
0.0 |
N/A |
N/A |
12/17e |
898.8 |
153.7 |
2.5 |
0.0 |
N/A |
N/A |
Note: *PBT and EPS are normalised, excluding amortisation of acquired intangibles, exceptional items and share-based payments.
Actavis IP litigation: First decision due in Q416
Overlap between Actavis’s ANDAs and Orexo’s Zubsolv patents mean that the first court decision (due Q416) on IP infringement will likely affect the process/outcome of subsequent suits. A worst-case scenario (all patents invalid) would allow launch of Actavis generic(s) post-FDA approval, with Orexo switching to a branded generic marketing strategy. However, timelines are unclear (with potential for protracted litigation, no generic is approved). A favourable ruling would strengthen Orexo’s IP situation and preclude generic launch until expiry of the last Zubsolv patent upheld.
Financials: Top-line growth and new cost guidance
Increased Zubsolv (SEK142.8m) and Abstral (SEK36.8m) sales drove the 30% y-o-y net revenue increase (Q316: SEK181.9m vs Q315: SEK139.5m). Zubsolv re-packaging in H216 will increase COGS but lower risk of inventory write off. Ongoing cost control meant Q316 costs came in under guidance; Q416 cost guidance is lowered and we have increased our profit forecast accordingly. The outcome of the Actavis IP suit is the major swing factor. Positive operating cash flow (SEK31.2m) was achieved in Q316, for the fourth successive quarter.
Valuation: SEK4.54bn or SEK131/share
Evolving market dynamics have prompted us to revisit our US Zubsolv forecasts given increased focus on pricing/rebate levels and increased competition. Our new lower valuation of SEK4.54bn or SEK131/share (SEK5.13bn or SEK149/share previously) reflects new Q416 expense guidance (and impact on FY17e costs), the prevailing FX rate (the SEK has weakened vs both the US$ and €) and our lower Zubsolv forecasts. Our valuation includes potential European Zubsolv revenues (assuming late-2018 launch, conservative €100m peak sales, 10% net royalty) but not potential Mundipharma milestones, as magnitude and timing are undisclosed.
Update: Tailwinds increase Zubsolv momentum
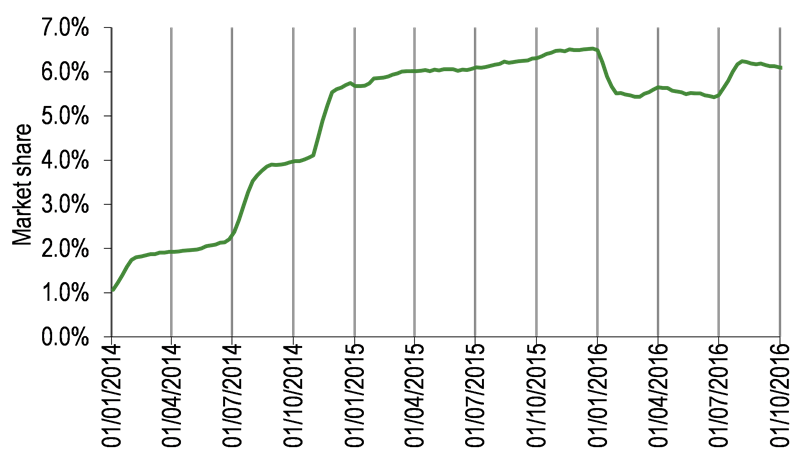
Orexo had a solid quarter with growth in both Zubsolv net revenue and market share in Q316 (Exhibits 1 and 2). Net Zubsolv revenues of SEK142.8m were up 26% on Q216 (SEK112.8m) and up 29% on Q415 (SEK110.8m). Average market share by volume for Q316 was 6.12% vs 5.51% for Q216, which was outstripped by pricing growth given the higher average mg/Rx (pricing is linear). Average market share by dollar value was 6.22% (Q316) vs 5.47% (Q216). The overall 18% increase in demand for Zubsolv, in a market that grew c 7% (vs Q315), was largely due to tailwinds from the Maryland FFS (fee for service contract) and a stronger US dollar against the Swedish krona, which boosted Zubsolv revenues in Orexo’s reporting currency.
|
Exhibit 1: Zubsolv tablet volumes (four-week average) |
Exhibit 2: Zubsolv market share (four-week average) |
|
|
|
Source: Symphony, Bloomberg. Note: Gridlines separate quarters. |
|
Exhibit 1: Zubsolv tablet volumes (four-week average) |
|
|
Source: Symphony, Bloomberg. Note: Gridlines separate quarters. |
|
Exhibit 2: Zubsolv market share (four-week average) |
|
|
Source: Symphony, Bloomberg. Note: Gridlines separate quarters. |
Zubsolv has been the exclusive preferred product on the Maryland state formulary since 1 July. The Maryland FFS contract added >1,000 weekly Rx to Zubsolv and underpinned a 1.4 percentage point increase in Zubsolv’s overall market share in the public segment (to 5%; or 35% of total Zubsolv volume). As expected, during the second half of the quarter some patients reverted to their original treatment option (which requires prior authorisation); nevertheless, Zubsolv had a c 44% Maryland FFS market share at end-September. Maryland is the largest fee for service Medicaid state in the US with c 1.3% overall market share by value. From a financial perspective, Orexo has benefited from Maryland-associated inventory build, and despite a lower gross to net ratio (reflecting the higher rebate in the public segment), the EBIT contribution from the Maryland business has been ‘attractive’ as investment in implementation has been limited.
Added impetus: Market access and US legislative change
Orexo remains focused on growth opportunities, driven by improved market access and legislative change. The Maryland FFS agreement has stimulated market share gains for Zubsolv in the public segment. Other new market access agreements (both commercial and public) have been secured, which will activate in the coming months. Management has confirmed that in the commercial segment most of the formulary listings for 2017 have been finalised with Zubsolv at least maintaining its current position. A major win is the contract with CIGNA, the firth largest health plan in the US, whereby prior authorisation and step edits required to previously access Zubsolv have been removed from 15 October. From January 2017, Zubsolv will also have an improved position on two unnamed regional plans. In the public segment, Zubsolv will become the preferred branded product in a large Medicare part D plan from 1 January 2017.
In addition to ongoing efforts to maintain or improve Zubsolv’s position with payers, Orexo is also optimising its field force deployment to focus on regions with good market access (comparable to main branded competition) and where there is a high density of high prescribing physicians. The increased cap on the number of patients that certified physicians can treat with buprenorphine (to 275 from 100) will have a mounting impact on Zubsolv market share. The first ‘C275’ physicians received their certification in late August and, while over 1,500 have received waivers to increase their limit by mid-October, it will take time for these doctors to grow their practices to the higher limit. It is reasonable to expect that the ramp up in Zubsolv market share will also build in tandem. A total of 78% of the newly C275 waivered physicians are accessible to the existing field force, with 52% currently covered. Geographic distribution of C275 physicians will likely be a key determinant for salesforce deployment and potential future expansion.
Orexo confirmed 15% market share growth in September with the first wave of C275 physicians vs 7% growth across the overall market. This follows the trend seen to date whereby Orexo has been more successful in winning a higher share of new patients than in switching existing patients. Over time, we expect that C275 certification and implementation of CARA 2016 (Comprehensive Addiction and Recovery Act of 2016) in the latter part of 2017 will contribute to increased momentum in Zubsolv revenue and market share growth by increasing the overall market for buprenorphine therapies. More patients would be able to be treated, with an expectation that more new patients would seek therapy, with Orexo potentially securing a disproportionate share of these new patients. Potential sales force expansion in selected regions, as well as a stronger marketing message (supplemented by the recent unique 0.7mg dose approval and insights from RESOLV data) could provide added impetus. Prior to the approval of the new 0.7mg buprenorphine/0.18 mg naloxone tablet Zubsolv had the broadest available buprenorphine dose range. Once the new low dose is launched in early 2017, Zubsolv’s dose range will be expanded to six doses. This will improve physician dosing flexibility (both up and down) and enable tapering of patients to the lowest effective maintenance dose, without compromising tablet or packaging integrity through ‘dose splitting’ (tablet breakage). The broad dose range, patient preference data and real-world clinical database gathered throughout the 1,080-pt RESOLV study provide a strong message for Orexo to convey to key stakeholders (physicians, politicians and payers) as it seeks to optimise and improve access to opioid dependence therapy.
However, we have revisited our US forecasts for Zubsolv as the market continues to evolve. Recent legislative changes will steadily expand the market for medically assisted opioid dependence treatment, albeit in an overall pharmaceutical market where there is increased focus and pressure on pricing and rebate levels and also increased competition. Consequently, we have moderated our growth trajectory for Zubsolv and increased our assumed rebate level in the short term and longer term, where we now assume a rebate level of 45% from 2020 rather than 35% previously. The assumed higher rebate level reflects the assumptions that:
■
in a competitive market the gross-to-net ratio will be pushed downwards as various players seek to maintain or win favourable commercial formulary status and;
■
a significant proportion of new patients treated by C275 physicians will be covered by public plans, which typically have a lower gross-to-net than commercial programmes.
Evidence of a growth step-up following implementation of new US legalisation to increase access to treatment could lead us to upgrade our Zubsolv forecasts, especially as Orexo is targeting a disproportionate share of new patients. However, continued pricing/rebating pressures remain a downside risk to current forecasts. We expect to revisit our forecasts again post FY17 results when there is likely to be more data on the impact of the new legislation.
An overhang: Actavis Paragraph IV litigation
The key near-term sensitivity for Orexo is the outcome of its Zubsolv patent infringement suit against Actavis. Actavis is the first and, so far, only company to file an ANDA for a Zubsolv generic. Three litigation processes are ongoing (Exhibit 3), covering different the buprenorphine doses in Zubsolv and various patents.
Exhibit 3: Ongoing Actavis Zubsolv IP litigation
ANDA submission/ confirmation |
Doses covered (buprenorphine element) |
Relevant patents |
Key dates |
June 2014 |
1.4mg and 5.7mg |
‘996 and ‘330 |
Trial date: June 2016; Hatch Waxman expiry: November 2016; expected court ruling: Q416. |
July 2015 |
2.9mg, 8.6mg and11.4mg |
‘996 and ‘330 |
Trial date: October 2017. |
June 2014/July 2015 |
1.4mg, 2.9mg, 5.7mg, 8.6mg and 11.4mg |
‘421 |
Filed: February 2016. Pending trial date. |
Source: Edison Investment Research, Orexo
Resolution of the first lawsuit is expected in Q416 and its outcome is likely to have a bearing on the second as both are based on the same Orexo Orange Book patents (numbers 8,454,996 and 8,940,330 with expiries of September 2019 and September 2032 respectively). Since Actavis’s first ANDA filing, four additional Zubsolv strengths have been approved by the FDA (0.7mg, 2.9mg, 8.6mg and 11.4mg) and two new Zubsolv patents have been issued (9,259,421 and 9,439,900). Orexo has responded by initiating two additional infringement suits:
■
infringement of the ‘996 and ‘330 patents by the 2.9mg, 8.6mg and 11.4mg strengths, which has a trial date of October 2017; and
■
infringement of the ‘421 patent (which is related to the ‘330 patent) for all the Zubsolv strengths covered by existing ANDAs (ie all except the recently approved 0.7mg dose).
At present Actavis has not filed an ANDA covering the 0.7mg Zubsolv dose (approved in October 2016) or indicated that it will challenge the newest ‘900 patent (approved in September 2016).
Orexo continues to have confidence in the strength of the IP around Zubsolv and is seeking to protect this position through a multi-layer strategy in the courts. The overlap between the various ANDA filings and patents being challenged by Actavis mean that the court decision in the first case is likely to have an impact on the process and outcome of the subsequent suits. For example, if the court rules in favour of Orexo in the first suit, the company will then not need to proceed in its defence of the ‘421 patent. A negative outcome would in the first instance also be likely to prompt an appeal process from Orexo. On the Q316 results call, management would not be drawn on the likelihood of various outcomes but indicated that it had analysed 16 different potential scenarios.
In our view the worst-case scenario, assuming all patents are deemed invalid, could see launch of one or more Actavis generic dose strengths soon after its FDA approval. However, the timeline for a potential launch is uncertain as no FDA approval for a Zubsolv generic has been granted to date, and there may also be a protracted legal process. In this scenario, Orexo’s marketing strategy would need to shift to that of a branded generic product: Zubsolv’s peak sales opportunity may be lower, but this would be offset by a lower cost of promotion. The best-case scenario would preclude Actavis from launching its product until expiry of the last of the Zubsolv patents upheld by the court (potentially into 2032); a favourable ruling would also strengthen Orexo’s IP situation, as any future ANDA filing(s) would have to target other patent claims.
Valuation
Our decreased Orexo valuation is SEK4.54bn or SEK131/share (vs SEK5.13bn or SEK149/share previously). We roll forward our financial model and update our forecasts with new Q416 expense guidance (with knock on impact on FY17e costs) and the prevailing FX rates (now SEK8.84/US$ from SEK8.57/US$; SEK9.69/€ from SEK9.48/€). These two changes each add SEK6 to the per-share valuation, but are more than offset (-SEK30/share) by new Zubsolv forecasts (Exhibit 4). The rationale for these changes has been discussed above.
Exhibit 4: Zubsolv revenue assumptions to 2021
Assumption |
2015 |
2016e |
2017e |
2018e |
2019e |
2020e |
2021e |
US Zubsolv sales – pre-rebates ($m) |
107.0 |
128 |
163 |
230 |
302 |
440 |
583 |
US Zubsolv sales – post-rebates ($m) |
51.9 |
60 |
81 |
121 |
166 |
242 |
302 |
Total US Zubsolv sales – post-rebates (SEKm) |
416.7 |
504.2 |
720.4 |
1.069.1 |
1,470.0 |
2.140.3 |
2,834.3 |
European Zubsolv sales – pre-rebates (€m) |
1.3 |
6.5 |
13.3 |
20.3 |
|||
European Zubsolv sales – post-rebates (€m) |
0.77 |
4.23 |
9.29 |
15.22 |
|||
Total European Zubsolv sales – post-rebates (SEKm) |
7.4 |
41.0 |
90.0 |
147.5 |
|||
Total European Zubsolv net royalty (SEKm) |
0.7 |
4.1 |
9.0 |
14.8 |
|||
Total Zubsolv revenues – post-rebates (SEKm) |
416.7 |
504.2 |
720.4 |
1.069.8 |
1,474.1 |
2,149.3 |
2,849.1 |
Total product sales (SEKm) |
643.2 |
728.1 |
898.8 |
1,149.1 |
1,524.9 |
2,174.3 |
2,849.1 |
Source: Edison Investment Research, Orexo. Note: In the US, assumes SEK8.84/$ FX rate, peak market share of 25% and average 45% rebate. In Europe, SEK9.69/€, peak market share of 20% and average 20% rebate.
Following EMA filing of Zubsolv in October, EU approval is possible around Q417. Subject to reimbursement decisions from various national authorities, launch is possible by late-2018 as per our original assumption. We continue to assume European sales of c €60m in year six, with peak sales of €100m (20% share of a conservative €500m market growing at 2% pa); and a net royalty of 10%. As the magnitude and timing of milestones from Mundipharma are undisclosed, these are not captured in Exhibit 4 or our full model; nevertheless, we would expect milestones to become due on approval/launch in key territories. In addition, we do not explicitly value the RoW opportunity (ex-US, ex-Europe) until Mundipharma discloses its intention and there is more clarity on timelines; we recognise that this could provide upside to our forecasts.
Overall our explicit DCF-based valuation out to 2030 continues to assume a WACC of 10%, a long-term tax rate of 30% after 2016 and no terminal value. However, we now estimate a long-term gross margin of 80% on Zubsolv (down from 85%) by 2025, with the operating margin gradually trending to 45% (down from 50%) in the long term. We include a modest revenue contribution from global Abstral and Edluar royalties until 2020, at which point we assume for simplicity that all revenues relate to Zubsolv. At present we do not value Orexo’s development pipeline: securing a partnership and defining the indication for OX51 could also unlock valuation upside, as would pipeline expansion.
Financials
Growth in Zubsolv and Abstral revenues were the key drivers of the 30% y-o-y increase in net revenues (Q316: SEK181.9m vs Q315: SEK139.5m); Abstral royalty receipts benefitted from continued growth in European sales leading to royalty payment being achieved one month earlier than in the prior period. Excluding the impact of the €7m Mundipharma milestone received in Q216, product sales also increased vs Q216 (SEK122.8m). Exhibit 5 provides a revenue breakdown for the period and our full-year per product estimates. COGS of SEK38.3m in Q316 (SEK34.8m in Q315) reflected one off costs incurred in the re-packaging of Zubsolv tablets, which offset the increased efficiencies resulting from higher manufacturing volumes over the quarter. FDA approval of a longer shelf life lowers the risk of inventory write offs and will be complete by year-end 2016; however, the associated cost will add an additional SEK10m to the normal COGS level for Q416.
Exhibit 5: Q316 actual and forecast revenue breakdown per product (SEKm)
Q316 |
Change on Q315 |
Old FY16e |
New FY16e |
Notes |
|
Abstral royalties |
36.8 |
45% |
101.6 |
103.3 |
US generic entry (Actavis) from June 2018 (or earlier under certain undisclosed conditions), ahead of September 2019 patent expiry. Partnered with ProStrakan (Europe): 15% royalty on net sales >€42.5m; Sentynl (acquired US rights from Galena in Nov 2015): low double-digit royalty; Kyowa Hakko Kirin (Japan) single-digit royalty. |
Abstral milestones |
- |
- |
- |
- |
|
Edluar royalties |
2.3 |
-30% |
13.9 |
13.9 |
Sold by Mylan (acquired Meda in August 2016) in the US, Canada and EU. |
Zubsolv US |
142.4 |
29% |
531.3 |
504.7 |
Q3 is the first quarter of the Maryland FFS Medicaid agreement: this increased market share but depressed the gross to net. Main patent to 2032. |
Zubsolv ROW |
0.4 |
N/A |
65.4 |
65.4 |
SEK0.4m milestone earned under Mundipharma ex-US global license in Q3. |
Total product revenue |
181.9 |
30% |
716.6 |
687.3 |
|
Other revenue |
0.0 |
N/A |
40.8 |
40.8 |
$5m AZ upfront for OX-CLI. |
Source: Edison Investment Research, Orexo
Q316 operating costs of SEK114.7m were lower than Orexo guidance with admin and R&D expenses coming in lower than expectations and sales costs in line; guidance was for SEK80m in both R&D and admin spend over H216 (c SEK40m in each quarter). Operating profit (pre-FX impact) for the period was SEK28.9m (Q315: loss of SEK44.2m), with a PBT of SEK37.6m vs SEK44.1m loss (Q315).
A significant proportion of the admin costs of SEK33.4m (Q315: SEK34.8m) related to the first Actavis Zubsolv IP infringement suit. Following the trial in June, the level of admin spend has decreased; it is expected to be lower in Q416 (c SEK30-35m) although this will depend on the outcome of the legal decision and progress in the second IP infringement case. R&D costs of SEK24.1m (Q315: SEK43.3m) were lower due to Mundipharma bearing the costs associated with completion of the regulatory bio-equivalence study for EU submission under the Zubsolv ex-US global license. Q416 R&D guidance is SEK30-35m reflecting the early-stage of development of the undisclosed internal pipeline projects. Following the sales force optimisation carried out in late 2015, sales expenses in Q316 were lower than the prior period (SEK57.3m vs SEK70.8m); a similar run rate is expected into Q416 with SEK60m guidance. Orexo will continue to dynamically manage its investment into the salesforce, optimising deployment and investment based on market conditions; the impact of recent legislative changes in the US may increase future investment.
Net debt at end September 2016 stood at SEK219.2m, with SEK276.9m of cash and equivalents. Q316 was the fourth quarter in which Orexo achieved a positive operating cash flow (SEK31.2m).
We have updated our model to incorporate Q316 results, new guidance and the movement in FX rates; a detailed summary is provided in Exhibit 7 overleaf, with key forecast changes shown in Exhibit 6. The revenue upgrade to our forecasts is driven by FX, while PBT and EPS improvements also benefit from the lower costs we model for the remainder of 2016 and 2017.
Exhibit 6: Changes to estimates
Revenue (SEKm) |
PBT (SEKm) |
EPS (SEK) |
|||||||
Old |
New |
Change |
Old |
New |
Change |
Old |
New |
Change |
|
2016e |
753 |
728 |
(3%) |
25 |
43 |
72% |
0.5 |
1.0 |
100% |
2017e |
989 |
899 |
(7%) |
137 |
154 |
12% |
2.2 |
2.5 |
18% |
Source: Edison Investment Research. Note: SEK/US$ rate updated to 8.84 from 8.57.
Exhibit 7: Financial summary
SEKm |
2014 |
2015 |
2016e |
2017e |
||
Year end 31 December |
IFRS |
IFRS |
IFRS |
IFRS |
||
PROFIT & LOSS |
||||||
Revenue |
|
|
570.3 |
643.2 |
728.1 |
898.8 |
Cost of Sales |
(107.4) |
(136.1) |
(150.3) |
(161.3) |
||
Gross Profit |
462.9 |
507.1 |
577.8 |
737.5 |
||
EBITDA |
|
|
(12.5) |
(88.4) |
86.3 |
173.1 |
Operating Profit (before GW and except.) |
|
(25.0) |
(169.1) |
64.6 |
166.4 |
|
Intangible Amortisation |
0.0 |
0.0 |
0.0 |
0.0 |
||
Other |
16.5 |
(64.6) |
15.9 |
0.0 |
||
Exceptionals |
0.0 |
0.0 |
0.0 |
0.0 |
||
Operating Profit |
(25.0) |
(169.1) |
64.6 |
166.4 |
||
Net Interest |
(27.6) |
(22.1) |
(21.7) |
(12.6) |
||
Other |
0.0 |
0.0 |
0.0 |
0.0 |
||
Profit Before Tax (norm) |
|
|
(52.6) |
(191.2) |
42.8 |
153.7 |
Profit Before Tax (IFRS) |
|
|
(52.6) |
(191.2) |
42.8 |
153.7 |
Tax |
(4.0) |
(6.9) |
(6.8) |
(65.8) |
||
Deferred tax |
0.0 |
0.0 |
0.0 |
0.0 |
||
Profit After Tax (norm) |
(56.6) |
(198.1) |
36.1 |
88.0 |
||
Profit After Tax (IFRS) |
(56.6) |
(198.1) |
36.1 |
88.0 |
||
Average Number of Shares Outstanding (m) |
34.3 |
34.6 |
34.5 |
34.5 |
||
EPS - normalised (ore) |
|
|
(165) |
(573) |
105 |
255 |
EPS - IFRS (SEK) |
|
|
(1.6) |
(5.7) |
1.0 |
2.5 |
Dividend per share (SEK) |
0.0 |
0.0 |
0.0 |
0.0 |
||
Gross Margin (%) |
81.2 |
78.8 |
79.4 |
82.1 |
||
EBITDA Margin (%) |
(2.2) |
(13.7) |
11.8 |
19.3 |
||
Operating Margin (before GW and except.) (%) |
(4.4) |
(26.3) |
8.9 |
18.5 |
||
BALANCE SHEET |
||||||
Fixed Assets |
|
|
289.5 |
185.9 |
163.8 |
158.0 |
Intangible Assets |
259.2 |
159.1 |
142.4 |
142.4 |
||
Tangible Assets |
29.1 |
24.7 |
21.4 |
15.6 |
||
Other |
1.2 |
2.1 |
0.0 |
0.0 |
||
Current Assets |
|
|
936.4 |
830.4 |
940.2 |
1,070.7 |
Stocks |
478.1 |
398.9 |
308.8 |
176.7 |
||
Debtors |
173.8 |
233.4 |
179.5 |
221.6 |
||
Cash |
284.5 |
198.1 |
451.9 |
672.4 |
||
Other |
0.0 |
0.0 |
0.0 |
0.0 |
||
Current Liabilities |
|
|
(268.1) |
(251.6) |
(304.8) |
(341.0) |
Creditors |
(265.6) |
(251.6) |
(304.8) |
(341.0) |
||
Short term borrowings |
(2.5) |
0.0 |
0.0 |
0.0 |
||
Long Term Liabilities |
|
|
(502.8) |
(498.3) |
(498.5) |
(498.5) |
Long term borrowings |
(493.8) |
(494.4) |
(496.1) |
(496.1) |
||
Other long term liabilities |
(9.0) |
(3.9) |
(2.4) |
(2.4) |
||
Net Assets |
|
|
455.0 |
266.4 |
300.7 |
389.2 |
CASH FLOW |
||||||
Operating Cash Flow |
|
|
(455.7) |
(73.2) |
275.8 |
263.6 |
Net Interest |
(31.6) |
(29.0) |
(26.9) |
(12.6) |
||
Tax |
0.0 |
0.0 |
0.0 |
(29.5) |
||
Capex |
(71.7) |
(4.1) |
(1.6) |
(1.0) |
||
Acquisitions/disposals |
0.0 |
21.8 |
11.0 |
0.0 |
||
Financing |
341.7 |
3.8 |
2.1 |
0.0 |
||
Dividends |
0.0 |
0.0 |
0.0 |
0.0 |
||
Other |
0.0 |
0.0 |
0.0 |
0.0 |
||
Net Cash Flow |
(217.3) |
(80.7) |
260.4 |
220.6 |
||
Opening net debt/(cash) |
|
|
135.4 |
211.8 |
296.3 |
44.2 |
HP finance leases initiated |
0.0 |
0.0 |
0.0 |
0.0 |
||
Exchange rate movements |
1.5 |
4.5 |
6.7 |
0.0 |
||
Other |
139.4 |
(8.3) |
(15.0) |
0.1 |
||
Closing net debt/(cash) |
|
|
211.8 |
296.3 |
44.2 |
(176.5) |
Source: Edison Investment Research, Orexo accounts
|
|