As Caledonia Mining (CMCL) continues to implement its investment plan (IP), logistical issues governing ore handling volumes and access to higher-grade ore bodies have affected gold production during Q2 and H117. Underground works to ameliorate material handling bottlenecks have taken place with successful completion, inter alia an underground tramming loop. However, grades are lower due to restricted access to the higher-grade Eroica and Lima ore bodies situated on the other side of the Central Shaft development area to the main surface haulage route – the No. 4 haulage shaft. We have adjusted our valuation to reflect this and the H117 financial results, leading to a valuation of 933p for successful implementation and operation of the Blanket IP.
Written by
Caledonia Mining |
Ore extraction hindered by IP implementation |
Q2 & H117 results |
Metals & mining |
14 September 2017 |
Share price performance
Business description
Next events
Analysts
Caledonia Mining is a research client of Edison Investment Research Limited |
|||||||||||||||||||||||||||||||||||||||||||||||
As Caledonia Mining (CMCL) continues to implement its investment plan (IP), logistical issues governing ore handling volumes and access to higher-grade ore bodies have affected gold production during Q2 and H117. Underground works to ameliorate material handling bottlenecks have taken place with successful completion, inter alia an underground tramming loop. However, grades are lower due to restricted access to the higher-grade Eroica and Lima ore bodies situated on the other side of the Central Shaft development area to the main surface haulage route – the No. 4 haulage shaft. We have adjusted our valuation to reflect this and the H117 financial results, leading to a valuation of 933p for successful implementation and operation of the Blanket IP.
Year end |
Revenue (US$m) |
PBT* |
EPS* |
DPS |
P/E |
Yield |
12/15 |
49.0 |
5.1 |
40.0 |
23.7 |
16.4 |
3.6 |
12/16 |
62.0 |
19.6 |
106.9 |
28.4 |
6.2 |
4.3 |
12/17e |
67.6 |
20.4 |
135.6 |
27.5 |
4.9 |
4.2 |
12/18e |
78.7 |
24.9 |
147.1 |
27.5 |
4.5 |
4.2 |
Note: *PBT and EPS are normalised, excluding amortisation of acquired intangibles, exceptional items, share based payments and deferred tax. Historical earnings reflect share consolidation.
FY17 cost and production guidance intact
We have revised our quarterly gold production forecasts to 14,174oz produced in each of Q317 and Q417, requiring 140kt of ore processed each quarter (Q217 saw 136kt processed) at a grade of 3.35g/t (the average of the company’s quarterly head grades since Q114). Based on previous cost guidance, we estimate that the company will finish 2017 with net cash of US$10.5m, a y-o-y decrease of 27%, before the effects of the company’s completed Central Shaft development drive cash generation higher in 2018. We estimate end-2018 net cash to nearly double to US$19.6m (from c 64koz Au produced and sold at a US$1,220/oz Au price and incurring cash costs of US$588/oz). 2017 gold production guidance is 52-57koz.
Valuation and earnings reflect share consolidation
We forecast FY17 earnings to be back-weighted to H2 with basic EPS of 28.9 cents per quarter. This follows Q1 and Q2 reported EPS of 25.1c and 6.1c respectively. H217 earnings potential reflects our relatively conservative view of gold production coming in at 54koz, the midpoint of CMCL’s 52-57koz revised FY17 guidance.
Valuation: Adjusted for a number of factors
We have adjusted our valuation for numerous changes, including revisions to H217 and H118 gold production values, a reduction in facilitation loan account interest rates, our in-house gold price assumption to reflect ytd gold price moves and a recalculation of Caledonia’s gold rebate. Details of each of our valuation changes can be found on page 5 of this report. These changes result in a new valuation of 933p/share (post-consolidation) using Edison gold price forecasts and a 10% discount rate to reflect general equity risk. Applying a flat US$1,300/oz gold price results in a valuation of 950p.
Investment plan implementation guides performance
Caledonia produced 12,521oz of gold in Q217, a slight increase over Q1’s 12,510oz. Second quarter cash costs were US$696/oz, 10% higher than Q117 (US$629/oz), resulting from the lower gold grades mined (3.08g/t vs a budgeted grade closer to 3.6g/t). All-in sustaining costs for Q217 were US$855/oz and 8% lower on a q-o-q basis. Q217 gold production resulted in a gross profit of US$5.0m, 16% lower than Q216 (US$5.9m). H117 gross profit was US$10.9m, up 11% from the same period a year ago, and net profit attributable to shareholders is US$3.0m, 27% lower on a l-f-l basis.
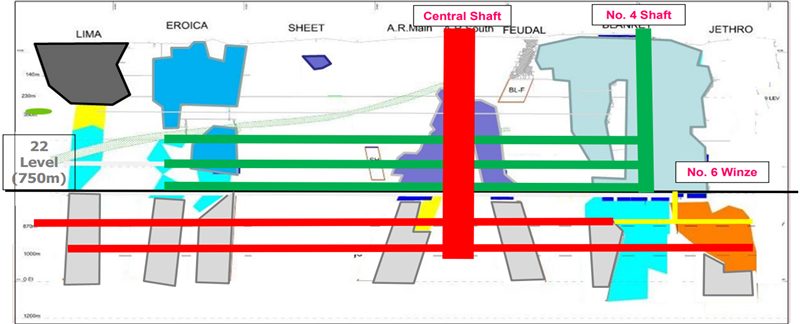
The second quarter of 2017 saw steady progress concerning implementation of the company’s investment plan. The Central Shaft is now completed to a depth of 870m, or 81% of its 1,080m initial design depth. During Q217, 202m was completed at the Central Shaft, 63% above the quarter’s budgeted development target of 124m. With Central Shaft development the most critical element of the company’s investment plan (started in late 2014), material, and importantly, ore, haulage capacity has been constrained on the 22 Level, 750m below surface (see below).
|
Exhibit 1: Long section of Blanket mine with ore bodies and main haulage development and shafts |
|
|
Source: Caledonia Mining |
This constraint on material handling around the Central Shaft development led the company to initiate a number of work programmes in an attempt to raise tonnes and thereby maintain gold production targets. For 2017, 60koz of gold were to be produced. However, as mentioned above, constraints on the 22 Level forced the company to revise this gold production target down to a range of 52-57koz. We have revised our model to reflect production of 54koz of gold, with 14.2koz produced in each of Q317 and Q417.
Production performance by quarter has seen a slight reduction in gold grades mined at Blanket, and this has been the overriding factor in the company’s decision to downgrade its production guidance.
|
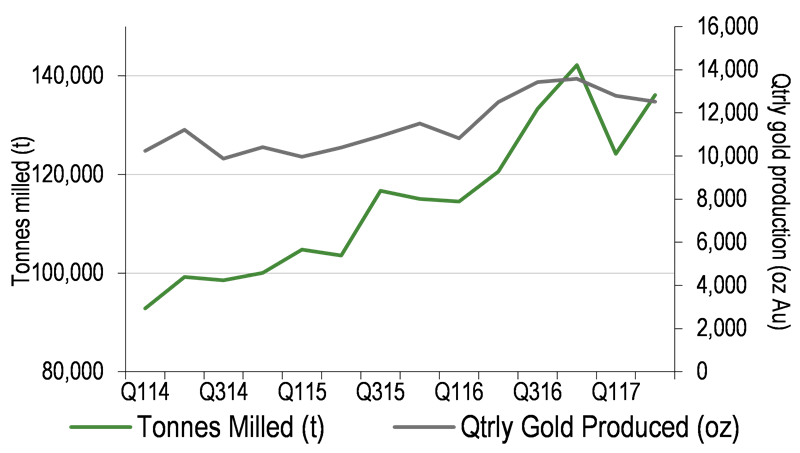
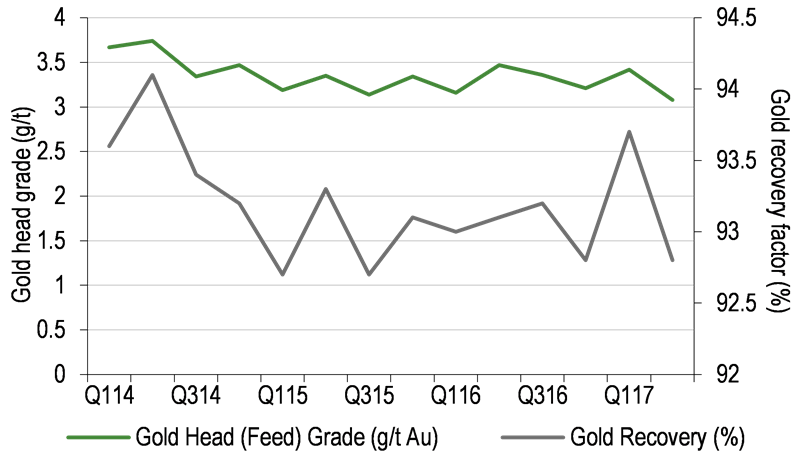
Exhibit 2: Quarterly gold production, tonnes milled, gold grade AND recovery data Q114-Q217 |
|
|
|
|
Source: Edison Investment Research, Caledonia Mining |
|
|
Exhibit 2: Quarterly gold production, tonnes milled, gold grade AND recovery data Q114-Q217 |
|
|
|
|
|
|
Source: Edison Investment Research, Caledonia Mining |
Since the implementation of Caledonia’s investment plan, gold grades have fluctuated between a high of 3.74g/t Au and a low reached Q217 of 3.08g/t Au, with an average of 3.35g/t Au. The major reason for this is the fact that the higher-grade Eroica and Lima ore bodies are unsympathetically located relative to the main No. 4 Shaft (used currently as the main haulage route to surface) relative to the Central Shaft development (see Exhibit 1). As a result, and to maintain the development schedule of the Central Shaft and associated lateral development below the 22 Level (horizontal red lines in Exhibit 1), the vast majority of gold ore had to be mined from the marginally lower-grade AR Main and AR South ore bodies.
As already stated by Caledonia, these production and gold grade issues are likely to persist until completion of the Central Shaft. We find it reassuring that this most critical of capital projects has seen above-budget development meterages achieved during the last quarter and that it is firmly on track to complete in mid-2018, with first production from the Central Shaft stated to come shortly before end 2018.
As can be seen from Exhibit 2 above (right-hand side), while the head grade at blanket has seen a gradual reduction over the past few quarters, tonnages trammed and hauled to surface (left-hand side) have seen a 300% increase since the tramming loop was completed.
Grade estimate revisions for H217 & H118 as Central Shaft completes
We have conservatively revised our gold grade forecasts downwards for the remainder of 2017 and the first half of 2018 to accommodate the haulage bottleneck on the 22 Level and the restricted access to higher-grade ore bodies while the Central Shaft development completes (due mid-2018).
Previously we had a grade of 3.66g/t mined during H217 and 3.71g/t Au mined during H118. We now anticipate that a gold grade reflecting the average of Blanket’s head grades since Q114 is mined through H217 to H118 – 3.35g/t Au. We maintain gold recovery at 94% efficiency. This revision results in 14.2koz produced in Q317 and Q417, and 15.1koz produced in Q118 and Q218.
Capital projects status
The following points give an outline summary of the capital project works completed during Q217.
■
AR South decline below 750m (22 Level): a conveyor belt was commissioned, the extraction haulage on 780m level was completed and work of the 785m extraction haulage level continues (these are represented as the two horizontal, red-shaded lines below 750m on Exhibit 1 above).
■
Development on a second decline at the AR Main ore body is planned from 750m to 780m and will allow accelerated access to gold resources situated below the 22 Level.
■
At the No. 6 Winze development, three haulages are being developed 870m below surface to link the Blanket section to the AR South and Blanket 2 and Blanket 4 ore bodies.
■
On 22 Level an extraction haulage is being developed towards the Eroica orebody.
■
Upgrade of electricity supply from the grid and the ring feed between the two standby generator farms at Central and four shafts. This is due to be completed by end 2017, with the purpose of stabilising the supply of Zimbabwean grid power.
■
An upgrade of the metallurgical plant, including the installation of a third Knelson concentrator and vibrating Gemini table (ie gold processing equipment using gravity as the means of gold separation from crushed waste rock).
H117 and forecasts: Earnings back-weighted to H217
Quarterly income statement and earnings forecasts
The following exhibit provides historical 2017 quarterly income statements, as well as our forecasts for the remainder of the year. Assuming gold production comes in at the levels we estimate based on our in-house assertion of gold grades mined and tonnes hauled and processed, H217 should provide a considerable increase in earnings potential over that achieved in H117. Overall, following the revision in our production assumptions, we have had to downgrade our revenue and profit estimates for FY17. Our updated revenue and normalised PBT estimates are US$67.6m (vs US$76.2m) and US$20.4m (vs US$26.0m) in FY17, and US$78.7m (vs US$81.9m) and US$24.9m (US$26.8m) in FY18.
Exhibit 3: 2017 PL quarterly results and forecasts
US$'000s |
Q117 |
Q217 |
H117 |
Q317e |
Q417e |
FY17e |
Revenue (incl of refining costs and rebate) |
16,449 |
15,484 |
31,933 |
17,813 |
17,813 |
67,560 |
Royalty |
(823) |
(776) |
(1,599) |
(834) |
(834) |
(3,267) |
Operating costs |
(9,098) |
(8,814) |
(17,912) |
(9,263) |
(9,263) |
(36,439) |
Depreciation |
(882) |
(859) |
(1,741) |
(953) |
(953) |
(3,647) |
Gross profit |
5,646 |
5,035 |
10,681 |
6,763 |
6,763 |
24,207 |
G&A |
(1,441) |
(1,493) |
(2,934) |
(1,183) |
(1,183) |
(5,300) |
Share-based payments |
(410) |
(959) |
(1,369) |
- |
- |
(1,369) |
Foreign exchange gain/(loss) |
(64) |
83 |
19 |
- |
- |
19 |
Other income |
644 |
557 |
1,201 |
- |
- |
1,201 |
Operating profit |
4,375 |
3,223 |
7,598 |
5,580 |
5,580 |
18,758 |
Net interest |
(7) |
(10) |
(17) |
135 |
135 |
253 |
PBT (FRS 3) |
4,368 |
3,213 |
7,581 |
5,715 |
5,715 |
19,011 |
Tax (excludes deferred tax charge) |
(1,460) |
(2,090) |
(3,550) |
(1,783) |
(1,783) |
(7,116) |
Deferred tax |
- |
- |
- |
- |
- |
- |
PAT (FRS 3) |
2,908 |
1,123 |
4,031 |
3,932 |
3,932 |
11,895 |
Minority interest |
(570) |
(429) |
(999) |
(891) |
(891) |
(2,781) |
Forex translation differences |
73 |
60 |
133 |
0 |
0 |
133 |
Attributable profit |
2,411 |
754 |
3,165 |
3,041 |
3,041 |
9,114 |
EPS (IFRS) |
21.5 |
6.1 |
27.6 |
28.9 |
28.9 |
86.4 |
Source: Caledonia Mining and Edison Investment Research
Share-based payment expense: a write-down has been made of the facilitation loan value linked to the reduction in interest paid by indigenous parties. Previously, the three loan accounts carried a Libor plus 10% interest rate. This has now reduced to Libor plus 7.5% and has incurred a US$1.0m write-down, accounted for as a share-based payment due to the company’s accounting treatment of its facilitation loans as share options.
Tax paid vs charged: the income statement has recorded high variable tax charges linked to Caledonia’s capital expenditure amounts. This results in the actual amount of tax paid being far lower. This is due to the timing effects of capital expenditure, with a gross tax amount charged to the income statement and the actual amount of tax paid reflecting the taxable capex during the given reporting period. The deferred tax liability is carried as a liability on Caledonia’s balance sheet, which we estimate for FY17 will total US$3.7m. The following exhibit provides an overview of the past three years of tax.
Exhibit 4: Comparison of P&L and cash flow tax values
2015 |
2015 |
2016 |
2017e |
|
P&L tax charge (US$ 000s) |
(5,982) |
(2,370) |
(7,717) |
(7,116) |
Tax paid (US$ 000s) |
(4,526) |
(1,462) |
(2,466) |
(3,750) |
Difference between P&L & CF tax (%) |
32% |
62% |
213% |
90% |
Source: Caledonia Mining, Edison Investment Research
Financials
Caledonia had cash at end June of US$10.9m, a q-o-q decrease of 7.2%. This was after capital expenditure of US$7.5m, US$1.4m in dividend payments and a US$0.8m repayment of Caledonia’s small term loan facility. Our full-year capital expenditure projection is for US$20m spent at Blanket, indicating that the majority of capex will be spent over H217. Alongside our production assumptions noted above and earnings potential back-weighted to H217, we estimate that this will result in the company finishing FY17 with a cash position of US$10.5m.
Exhibit 5: Financial summary
US$'000s |
2015 |
2016 |
2017e |
2018e |
||
Year end 31 December |
IFRS |
IFRS |
IFRS |
IFRS |
||
PROFIT & LOSS |
||||||
Revenue |
|
|
48,977 |
61,992 |
67,560 |
78,678 |
Cost of Sales |
(35,796) |
(38,500) |
(43,353) |
(47,484) |
||
Gross Profit |
13,181 |
23,492 |
24,207 |
31,194 |
||
EBITDA |
|
|
8,967 |
23,257 |
23,774 |
29,847 |
Operating Profit (before amort. and except.) |
5,645 |
19,766 |
20,127 |
24,647 |
||
Intangible Amortisation |
0 |
0 |
0 |
0 |
||
Exceptionals |
2,850 |
(788) |
(1,369) |
(1,000) |
||
Operating Profit |
8,495 |
18,978 |
18,758 |
23,647 |
||
Net Interest |
(535) |
(176) |
253 |
210 |
||
Other financial items |
0 |
|||||
Profit Before Tax (norm) |
|
|
5,110 |
19,590 |
20,380 |
24,856 |
Profit Before Tax (FRS 3) |
|
|
7,960 |
18,802 |
19,011 |
23,856 |
Tax |
(2,370) |
(7,717) |
(7,116) |
(6,121) |
||
Profit After Tax (norm) |
2,740 |
11,873 |
16,630 |
18,736 |
||
Profit After Tax (FRS 3) |
5,590 |
11,085 |
11,895 |
17,736 |
||
Minority interests |
(811) |
(2,797) |
(2,781) |
(3,217) |
||
Net income (norm) |
|
|
4,220 |
11,276 |
14,308 |
15,518 |
Net income (FRS3) |
|
|
4,779 |
8,288 |
9,114 |
14,518 |
Average Number of Shares Outstanding (m) |
10.6 |
10.6 |
10.6 |
10.6 |
||
EPS - normalised (c) |
|
|
40.0 |
106.9 |
135.6 |
147.1 |
EPS - normalised and fully diluted (c) |
|
34.6 |
92.4 |
134.4 |
145.7 |
|
EPS - (IFRS) (c) |
|
|
8.9 |
79.5 |
86.4 |
137.6 |
Dividend per share (c) |
23.7 |
28.4 |
27.5 |
27.5 |
||
Gross Margin (%) |
26.9 |
37.9 |
35.8 |
39.6 |
||
EBITDA Margin (%) |
18.3 |
37.5 |
35.2 |
37.9 |
||
Operating Margin (before GW and except.) (%) |
11.5 |
31.9 |
29.8 |
31.3 |
||
BALANCE SHEET |
||||||
Fixed Assets |
|
|
49,276 |
64,917 |
81,167 |
84,167 |
Intangible Assets |
0 |
0 |
0 |
0 |
||
Tangible Assets |
49,276 |
64,917 |
81,167 |
84,167 |
||
Investments |
0 |
0 |
0 |
0 |
||
Indigenisation receivable |
0 |
0 |
0 |
0 |
||
Current Assets |
|
|
23,562 |
25,792 |
21,360 |
34,286 |
Stocks |
6,091 |
7,222 |
4,492 |
4,623 |
||
Debtors |
4,236 |
3,425 |
2,776 |
6,467 |
||
Cash |
12,568 |
14,335 |
10,480 |
19,585 |
||
Other |
667 |
810 |
3,611 |
3,611 |
||
Current Liabilities |
|
|
(8,397) |
(9,832) |
(10,550) |
(13,312) |
Creditors |
(6,709) |
(9,832) |
(10,550) |
(13,312) |
||
Short term borrowings |
` |
(1,688) |
0 |
0 |
0 |
|
Long Term Liabilities |
|
|
(14,080) |
(19,365) |
(19,365) |
(19,365) |
Long term borrowings |
0 |
0 |
0 |
0 |
||
Other long term liabilities |
(14,080) |
(19,365) |
(19,365) |
(19,365) |
||
Net Assets |
|
|
50,361 |
61,512 |
72,612 |
85,776 |
Minority interests |
|
|
(1,504) |
(3,708) |
(6,020) |
(8,768) |
Shareholder equity |
|
|
48,857 |
57,804 |
66,592 |
77,008 |
CASH FLOW |
||||||
Operating Cash Flow |
|
|
8,331 |
25,631 |
22,539 |
26,113 |
Net Interest |
0 |
(194) |
253 |
210 |
||
Tax |
(1,462) |
(2,466) |
(3,750) |
(6,121) |
||
Capex |
(16,567) |
(19,885) |
(20,000) |
(8,200) |
||
Acquisitions/disposals |
0 |
3 |
0 |
0 |
||
Term loan facility and equity issuance |
0 |
3,360 |
0 |
0 |
||
Dividends |
(2,504) |
(2,994) |
(2,897) |
(2,897) |
||
Net Cash Flow |
(12,202) |
3,455 |
(3,855) |
9,105 |
||
Opening net debt/(cash) |
|
|
(23,082) |
(10,880) |
(14,335) |
(10,480) |
HP finance leases initiated |
0 |
0 |
0 |
0 |
||
Other |
0 |
0 |
(0) |
0 |
||
Closing net debt/(cash) |
|
|
(10,880) |
(14,335) |
(10,480) |
(19,585) |
Source: Caledonia Mining accounts, Edison Investment Research. Note: EPS is adjusted for deferred tax charge.
|
|
Research: Financials
Scherzer & Co (PZS) was able to leverage the favourable market conditions in H117, generating an EPS of €0.15 (vs €0.04/share loss in H116) and growing NAV by 13.5% to €2.55/share as at end-June. Realised capital gains, higher dividend income and a lower negative balance of value adjustments contributed to the solid result. Although there were no major favourable extra compensatory claim (ECS) rulings in H117, the company maintained an extensive ECS portfolio, which now amounts to €89m or €2.97 per share, providing potential future earnings upside. PZS’s NAV stands at €2.64 as at end-August, in line with its current share price.