Last close As at 05/08/2026
ZAR88.30
▲ −0.20 (−0.23%)
Market capitalisation
ZAR21,528m
Research: TMT
In H125, while revenue declined due to mix and net revenue accounting, Datatec grew gross profit by 3.5% y-o-y and adjusted EBITDA by 18.5%, resulting in a 56.2% increase in underlying EPS (uEPS). Both Westcon and Logicalis International delivered strong profit growth, while Logicalis Latin America managed to offset lower revenues with reductions in its cost base. Management continues to expect a better financial performance from all three businesses in FY25. We have upgraded our forecasts to reflect the strong H125 performance, lifting FY25 uEPS by 10% and reducing year-end net debt by 12%.
Datatec |
Operational focus drives H125 profit growth |
H125 results |
Software and comp services |
14 November 2024 |
Share price performance
Business description
Next events
Analyst
Datatec is a research client of Edison Investment Research Limited |
|||||||||||||||||||||||||||||||||||||||||||||
In H125, while revenue declined due to mix and net revenue accounting, Datatec grew gross profit by 3.5% y-o-y and adjusted EBITDA by 18.5%, resulting in a 56.2% increase in underlying EPS (uEPS). Both Westcon and Logicalis International delivered strong profit growth, while Logicalis Latin America managed to offset lower revenues with reductions in its cost base. Management continues to expect a better financial performance from all three businesses in FY25. We have upgraded our forecasts to reflect the strong H125 performance, lifting FY25 uEPS by 10% and reducing year-end net debt by 12%.
Year |
Revenue |
PBT* |
Diluted EPS* |
DPS |
P/E |
Yield |
02/23 |
5,143 |
86.5 |
24.1 |
77.7 |
9.0 |
35.9 |
02/24 |
5,458 |
76.5 |
19.7 |
7.0 |
11.0 |
3.3 |
02/25e |
5,304 |
122.8 |
30.5 |
9.3 |
7.1 |
4.3 |
02/26e |
5,509 |
141.5 |
35.3 |
11.2 |
6.1 |
5.2 |
Note: *PBT and EPS are normalised, excluding amortisation of acquired intangibles, exceptional items and share-based payments.
Gross profit and adjusted EBITDA growth in H125
With an increasing proportion of software and services sold on an agency basis and therefore reported on a net revenue basis, Datatec’s revenue performance is becoming uncoupled from profit performance. Westcon revenue was down 3% while adjusted EBITDA grew 14%. Logicalis International revenue declined 11% while adjusted EBITDA was 35% higher. Logicalis Latin America was down 18% yo-y, although actually grew 3% in constant currency, while adjusted EBITDA was essentially flat after a reduction in operating costs. A working capital inflow resulted in net debt of $108.4m at the end of H125, down from $123.1m at the end of FY24.
Upgrading forecasts on better profitability
Management confirmed that it expects all divisions to deliver improved financial performance in FY25. Markets in Europe are softer while the US and Asia-Pacific remain strong. In Latin America, after several years of difficult trading, the outlook is more promising. Based on the strong performance in H125, we upgrade our gross profit and adjusted EBITDA forecasts for Westcon and Logicalis International while trimming Logicalis Latin America, resulting in a 10% upgrade to uEPS in FY25.
Valuation: Self-help to unlock value
Datatec currently trades on an EV/adjusted EBITDA multiple of 2.7x FY25e and 2.5x FY26e, well below its peer group (average of 8.5x across for both years). On a conservative sumof-the-parts (SOTP) valuation using peer group averages, we estimate that Datatec could be worth 102% more than the current share price. Sustained recovery in trading in Logicalis LatAm, gross profit growth and improving conversion of gross profit to EBITDA across the group will be key to reducing the discount to peers. The ongoing strategic review continues to seek ways to address the persistent valuation gap. In the shorter term, management is focused on operational improvements while interest rates are high and M&A activity muted.
Review of H125 results
Exhibit 1 summarises H125 results.
Exhibit 1: H125 results highlights
$m |
H124 |
H125 |
y-o-y |
|
Revenue |
2,762.7 |
2,612.1 |
-5.5% |
|
Gross profit |
417.9 |
432.7 |
3.5% |
|
EBITDA |
80.6 |
102.5 |
27.2% |
|
Share-based payments |
7.1 |
6.1 |
-13.3% |
|
Restructuring charges and other adjustments |
1.8 |
(2.7) |
-247.9% |
|
Adjusted EBITDA |
89.4 |
106.0 |
18.5% |
|
Operating profit |
50.2 |
71.9 |
43.1% |
|
Profit after tax |
15.7 |
30.2 |
91.8% |
|
Minority interests |
(1.8) |
(4.3) |
145.5% |
|
Net income to equity holders |
14.0 |
25.9 |
85.0% |
|
Adjustments |
0.2 |
(1.8) |
N/A |
|
Headline earnings |
14.1 |
24.0 |
70.0% |
|
Adjustments |
2.0 |
1.9 |
-6.2% |
|
Underlying earnings |
16.2 |
25.9 |
60.4% |
|
Headline EPS (HEPS) - c |
6.3 |
10.5 |
66.7% |
|
Underlying EPS (uEPS) - c |
7.3 |
11.4 |
56.2% |
|
Net debt |
174.8 |
108.4 |
-38.0% |
|
Gross margin |
15.1% |
16.6% |
1.4pp |
|
EBITDA margin |
2.9% |
3.9% |
1.0pp |
|
Adjusted EBITDA margin |
3.2% |
4.1% |
0.8pp |
|
Operating margin |
1.8% |
2.8% |
0.9pp |
Source: Datatec, Edison Investment Research
Datatec reported a revenue decline of 5.5% y-o-y for H125, with an increasing proportion of net revenue-accounted software and services the main reason for the decline (we discuss divisional performance below). Conversely, gross profit increased 3.5% y-o-y resulting in a 1.4pp increase in group gross margin to 16.6%. Reflecting good cost control, EBITDA increased 27.2% y-o-y, resulting in a 1pp increase in the EBITDA margin to 3.9%. After adding back share-based payments of $6.1m and deducting a net one-off credit of $2.7m, adjusted EBITDA increased 18.5% y-o-y. The adjusted EBITDA margin increased 0.8pp to 4.1%. Net finance costs of $28.8m in H125 were 14.4% higher year-on-year due to higher rates and higher average utilisation of facilities. Headline EPS from continuing operations, which excludes the post-tax gains and losses from the disposal of fixed assets, increased 67% y-o-y. Underlying EPS from continuing operations (adjusts headline EPS by excluding impairment of intangible assets, amortisation of acquired intangibles, acquisition-related adjustments and fair value movements, restructuring costs, one-off tax items affecting EBITDA, and costs relating to acquisitions, integrations and corporate actions) increased 56% year-on-year.
Net debt at period-end was $108.4m, down from $123.1m at the end of FY24. The group generated an inflow from working capital of $3.6m, helped by the higher proportion of software in H125 compared to H124.
The company declared an interim dividend of ZAR0.75/US$0.04 available as cash or with a scrip alternative.
Divisional performance
Exhibits 2 and 3 show recurring revenue by division.
|
Exhibit 2: Recurring revenue and growth by division |
Exhibit 3: Recurring revenue share of total revenue |
|
|
|
Source: Datatec |
Source: Datatec |
|
Exhibit 2: Recurring revenue and growth by division |
|
|
Source: Datatec |
|
Exhibit 3: Recurring revenue share of total revenue |
|
|
Source: Datatec |
Exhibit 4 summarises divisional revenue and profitability.
Exhibit 4: Divisional performance
Revenue ($m) |
H125 |
H124 |
y-o-y |
H125 |
H124 |
|
Westcon |
1,801 |
1,854 |
-3% |
|||
Logicalis International |
575 |
645 |
-11% |
|||
Logicalis Latin America |
215 |
263 |
-18% |
|||
Corporate and management consulting |
21 |
0 |
N/A |
|||
2,612 |
2,763 |
-5% |
||||
Gross profit ($m) |
Gross margin (%) |
y-o-y pp |
||||
Westcon |
216 |
204 |
6% |
12.0 |
11.0 |
1.0 |
Logicalis International |
164 |
158 |
4% |
28.5 |
24.4 |
4.1 |
Logicalis Latin America |
48 |
57 |
-15% |
22.4 |
21.6 |
0.9 |
Corporate and management consulting |
4 |
0 |
N/A |
20.7 |
N/A |
|
433 |
418 |
4% |
16.6 |
15.1 |
1.4 |
|
EBITDA ($m) |
EBITDA margin (%) |
|||||
Westcon |
70 |
60 |
16% |
3.9 |
3.2 |
0.6 |
Logicalis International |
37 |
26 |
44% |
6.5 |
4.0 |
2.5 |
Logicalis Latin America |
8 |
6 |
38% |
3.7 |
2.2 |
1.5 |
Corporate and management consulting |
(12) |
(11) |
14% |
|||
102 |
81 |
27% |
3.9 |
2.9 |
1.0 |
|
Adjusted EBITDA ($m) |
Adjusted EBITDA margin |
|||||
Westcon |
71 |
62 |
14% |
4.0 |
3.4 |
0.6 |
Logicalis International |
38 |
28 |
35% |
6.7 |
4.4 |
2.3 |
Logicalis Latin America |
6 |
6 |
-6% |
2.6 |
2.3 |
0.3 |
Corporate and management consulting |
(9) |
(7) |
28% |
|||
106 |
89 |
18% |
4.1 |
3.2 |
0.8 |
|
Source: Datatec, Edison Investment Research
|
Exhibit 5: Adjusted EBITDA/gross profit by division, FY22–H125 |
|
|
Source: Datatec |
Westcon: Evolving product mix, strong margin progression
Westcon reported a revenue decline of 2.9% y-o-y in H125, while recurring revenue increased 16% y-o-y to make up 48% of revenue (40% in H124). The company noted that it saw continued good demand for cybersecurity products (+23% y-o-y) but saw softening demand for enterprise networking products (-23% y-o-y) while cloud infrastructure revenues increased 7% y-o-y. This was evident in the lower proportion of revenues contributed by Comstor at 38% in H125 versus 44% in H124. Software grew as a proportion of revenue, from 40% in H124 to 49% in H125 (Exhibit 7), even as the volume of software and services reported on a net revenue basis increased.
Despite the revenue decline, gross profit grew 6% y-o-y and the gross margin expanded 1pp to 12.0%, helped by a higher proportion of net revenue accounted products, which effectively have a 100% gross margin, as well as the contribution from financial services. Adjusted EBITDA grew 14% y-o-y with the adjusted EBITDA margin expanding 0.6pp to 4.0%. To exclude the effect of the increasing proportion of net revenue accounted products (which have the effect of boosting margins), we track the rate of conversion of gross profit into adjusted EBITDA in Exhibit 5. Westcon has made good progress in increasing the conversion rate and is close to the 35% target it has previously suggested.
|
Exhibit 6: Revenue by technology |
Exhibit 7: Revenue by segment |
|
|
|
Source: Datatec |
Source: Datatec |
|
Exhibit 6: Revenue by technology |
|
|
Source: Datatec |
|
Exhibit 7: Revenue by segment |
|
|
Source: Datatec |
Reduced working capital requirements helped Westcon net debt fall from $67.7m at the end of H124 and $88.9m at the end of FY24 to $25.6m at the end of H125. Inventory turns improved, at 10.8x (H124 9.7x, FY24 9.6x). Days sales outstanding fell from 69 in FY24 to 67 in H125 while days payables outstanding increased to 90 from 88 in H124 and 86 in FY24.
Logicalis International: Strong margin growth
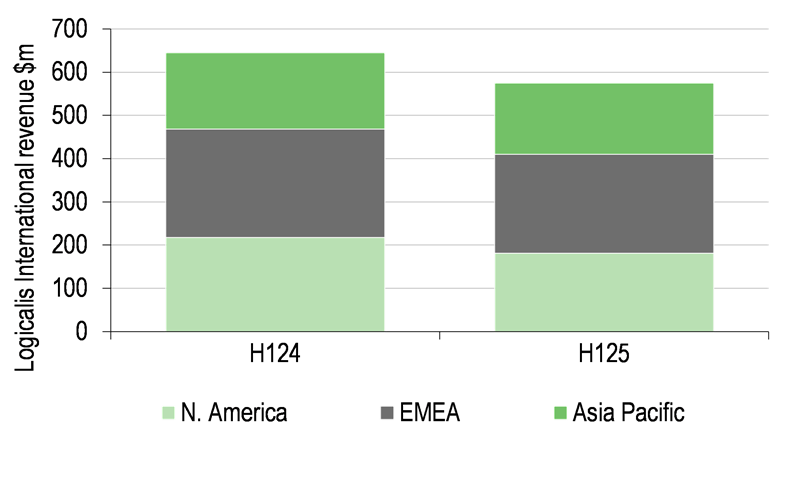
Logicalis International (LI) revenue declined 10.9% y-o-y in H125 (10.2% in constant currency), again affected by the increase in net revenue-accounted software and services. Recurring revenue declined 4% y-o-y to make up 41% of revenue, up from 38% in H124. The business has seen solid order intake and supplier lead times have stabilised. By geography (Exhibit 9), revenue declined 17% in North America, 8% in EMEA and 7% in Asia-Pacific. Cloud revenue was up 35% y-o-y and grew across all regions, making up 36% of revenue, up from 24% in H124. Hardware sales declined 19% y-o-y, software sales declined 22% (although they increased on a gross invoiced basis) and professional services declined 5%, while annuity managed services increased 9% (Exhibit 8).
|
Exhibit 8: Revenue by type |
Exhibit 9: Revenue by geography |
|
|
|
Source: Datatec |
Source: Datatec |
|
Exhibit 8: Revenue by type |
|
|
Source: Datatec |
|
Exhibit 9: Revenue by geography |
|
|
Source: Datatec |
Gross profit increased 4.1% y-o-y with gross margin expanding 4.1pp to 28.5%, helped by the increased contribution from annuity services. Adjusted EBITDA increased 35.0% y-o-y with the adjusted EBITDA margin increasing 2.3pp to 6.7%, as operating expenses declined 3.7% y-o-y, helped by headcount reductions in the US and Europe in H224. Adjusted EBITDA excluded share-based payments of $1.2m. Management noted a strong performance in the US and slight growth in EBITDA in Asia-Pacific. Performance in the UK improved from break-even in FY24 whereas Germany saw a weaker performance. South Africa reduced EBITDA losses.
Exhibit 5 shows that LI improved its conversion of gross profit to adjusted EBITDA in H125, increasing from 21.9% in FY24 to 23.4% in H125.
The company noted that net working capital was stable compared to FY24. LI net debt at the end of H125 of $96.3m was higher than the $79.3m at end of FY24 but reduced from the $113.4m reported at the end of H124.
Logicalis Latin America: Encouraging signs
Logicalis Latin America (LLA) revenue declined 18.1% y-o-y in H125 (growth of 2.7% in constant currency), mainly due to lower opening backlog, although the business saw a strong recovery in orders during H125. Revenue from Brazil declined 29% y-o-y, northern Latin America declined 6% and southern Latin America declined 8% (mainly driven by weakness in Chile). Recurring revenue declined 10% y-o-y to 47% of revenue (H124: 43%) mainly due to the cancellation of some multi-year contracts in the Brazilian telecom sector. Cloud revenue declined 16% y-o-y, making up 22% of revenue (flat y-o-y). Hardware revenue declined 29% y-o-y, software declined 7%, professional services declined 6% and annuity managed services declined 13% (Exhibit 11).
|
Exhibit 10: Revenue by geography |
Exhibit 11: Revenue by type |
|
|
|
Source: Datatec NOLA: northern Latin America SOLA: southern Latin America |
Source: Datatec |
|
Exhibit 10: Revenue by geography |
|
|
Source: Datatec NOLA: northern Latin America SOLA: southern Latin America |
|
Exhibit 11: Revenue by type |
|
|
Source: Datatec |
Gross profit declined 14.8% y-o-y while the gross margin increased 0.9pp to 22.4%. Operating costs fell by 20.9% y-o-y, mainly due to headcount reductions in Brazil, resulting in adjusted EBITDA falling by only 6.3% y-o-y and the adjusted EBITDA margin increasing by 0.3pp to 2.6%. Adjusted EBITDA excludes share-based payments of $0.3m (H124: $0.2m), restructuring charges of $0.6m and tax-related credits of $3.3m.
Looking at the business’s ability to convert gross profit to adjusted EBITDA, Exhibit 5 shows that this rate dropped from 26.1% in FY22 to 10.7% in FY24. This was in large part due to foreign exchange losses as the Argentine peso was devalued versus the US dollar. In H125 it increased to 11.6% and we would expect that as the business starts to recover, the conversion rate should rapidly increase back above 20%.
As the ability to make payments out of Argentina improved during H125, trade payables reduced and LLA net debt increased to $24.4m at the end of H125 from the $5.2m in net cash at end of FY24 and the net debt of $25.5m reported at the end of H124.
Outlook and changes to forecasts
Overall, the group continues to benefit from secular technology growth trends, including strong demand for cyber security and hybrid working, and the adoption of GenAI. As companies look to integrate GenAI into their internal and customer-facing processes, they will need help to build adequate hardware infrastructure and to integrate ChatGPT (or alternative) solutions into their existing IT estate, driving demand for both Westcon and Logicalis.
In Westcon, management noted that it has seen softening demand, particularly in Europe, against the uncertain geopolitical and economic backdrop. However, it continues to focus on operational improvement and using its digital platform to drive opportunities.
Logicalis Latin America has had three challenging years, but the outlook is now looking more encouraging, and good cost control positions the business well for the return of stronger demand. The Brazilian business had a large exposure to the telecoms sector, which has reduced, and is now more focused on enterprise and public sector customers.
All divisions are expected to deliver a better financial performance in FY25 compared to FY24.
We have revised our forecasts to reflect H125 results, factoring in lower revenue but increased gross profit and adjusted EBITDA for Westcon and Logicalis International. We have reduced our forecasts for Logicalis Latin America.
Overall, total adjusted EBITDA increases 4% in FY25, 5% in FY26 and 4% in FY27 and this translates to an increase in uEPS of 10% in FY25, 13% in FY26 and 10% in FY27. As the dividend is set at one-third of uEPS, our dividend forecasts increase by the same amount. Reflecting better than expected working capital control, we reduce our net debt forecasts for each year by 11–13%.
Exhibit 12: Changes in estimates
$m |
FY25e |
FY25e |
y-o-y |
FY26e |
FY26e |
y-o-y |
FY27e |
FY27e |
y-o-y |
|||
Old |
New |
growth |
Change |
Old |
New |
growth |
Change |
Old |
New |
growth |
Change |
|
Revenue |
5,731 |
5,304 |
(3%) |
(7%) |
5,991 |
5,509 |
4% |
(8%) |
6,264 |
5,704 |
4% |
(9%) |
Gross Profit |
909 |
900 |
4% |
(1%) |
947 |
933 |
4% |
(1%) |
987 |
966 |
3% |
(2%) |
Adj. EBITDA |
224 |
234 |
22% |
4% |
240 |
253 |
8% |
5% |
257 |
268 |
6% |
4% |
EBITDA |
214 |
226 |
27% |
6% |
230 |
243 |
7% |
6% |
247 |
258 |
6% |
4% |
Normalised operating profit |
164 |
177 |
35% |
8% |
178 |
191 |
8% |
7% |
194 |
205 |
7% |
6% |
Profit before tax (normalised) |
111.3 |
122.8 |
61% |
10% |
127 |
142 |
15% |
11% |
142 |
156 |
10% |
9% |
Net income (normalised) |
65.0 |
72.9 |
59% |
12% |
75 |
85 |
17% |
13% |
84 |
94 |
10% |
11% |
EPS - diluted normalised (c) |
27.4 |
30.5 |
55% |
11% |
31.6 |
35.3 |
16% |
12% |
35.6 |
38.9 |
10% |
9% |
EPS - basic reported (c) |
24.1 |
26.8 |
31% |
11% |
28.7 |
32.0 |
20% |
12% |
33.11 |
36.3 |
13% |
10% |
Headline EPS - basic (c) |
24.1 |
26.0 |
83% |
8% |
28.7 |
32.0 |
23% |
12% |
33.11 |
36.3 |
13% |
10% |
Company basic underlying uEPS (c) |
25.4 |
27.9 |
63% |
10% |
29.7 |
33.6 |
20% |
13% |
33.9 |
37.4 |
11% |
10% |
Dividend (c) |
8.5 |
9.3 |
32% |
10% |
9.9 |
11.2 |
20% |
13% |
11.3 |
12.5 |
11% |
10% |
Revenue growth (%) |
5.0 |
(2.8) |
-8.9pp |
-7.8pp |
4.6 |
3.9 |
6.7pp |
-0.7pp |
4.6 |
3.5 |
-0.3pp |
-1.0pp |
Gross Margin (%) |
15.9 |
17.0 |
1.2pp |
1.1pp |
15.8 |
16.9 |
0.0pp |
1.1pp |
15.8 |
16.9 |
0.0pp |
1.2pp |
Adj. EBITDA Margin (%) |
3.9 |
4.4 |
0.9pp |
0.5pp |
4.0 |
4.6 |
0.2pp |
0.6pp |
4.1 |
4.7 |
0.1pp |
0.6pp |
Normalised Operating Margin |
2.9 |
3.3 |
0.9pp |
0.5pp |
3.0 |
3.5 |
0.1pp |
0.5pp |
3.1 |
3.6 |
0.1pp |
0.5pp |
Net debt |
207 |
181 |
47% |
(12%) |
183 |
160 |
(12%) |
(13%) |
157 |
140 |
(13%) |
(11%) |
Revenue |
||||||||||||
Westcon |
3,869 |
3,630 |
-1% |
-6% |
4,063 |
3,775 |
4% |
-7% |
4,266 |
3,907 |
3% |
-8% |
Logicalis |
1,821 |
1,632 |
-7% |
-10% |
1,886 |
1,690 |
4% |
-10% |
1,954 |
1,750 |
4% |
-10% |
Logicalis International |
1,288 |
1,175 |
-6% |
-9% |
1,326 |
1,210 |
3% |
-9% |
1,366 |
1,247 |
3% |
-9% |
Logicalis Latam |
533 |
456 |
-11% |
-14% |
560 |
479 |
5% |
-14% |
588 |
503 |
5% |
-14% |
Corporate & Management Consulting |
40 |
42 |
N/A |
N/A |
42 |
44 |
N/A |
N/A |
44 |
46 |
N/A |
N/A |
Total |
5,731 |
5,304 |
-3% |
-7% |
5,991 |
5,509 |
4% |
-8% |
6,264 |
5,704 |
4% |
-9% |
EBITDA |
||||||||||||
Westcon |
132.3 |
143.5 |
19% |
9% |
140.4 |
153.7 |
7% |
9% |
148.9 |
162.1 |
5% |
9% |
Logicalis |
97.7 |
106.7 |
37% |
9% |
105.8 |
113.4 |
6% |
7% |
114.3 |
120.5 |
6% |
5% |
Logicalis International |
76.7 |
85.6 |
29% |
12% |
81.7 |
90.0 |
5% |
10% |
86.9 |
94.6 |
5% |
9% |
Logicalis Latam |
21.0 |
21.1 |
83% |
0% |
24.1 |
23.4 |
11% |
-3% |
27.4 |
25.9 |
10% |
-6% |
Corporate & Management Consulting |
(16.1) |
(24.0) |
12% |
49% |
(16.2) |
(24.4) |
2% |
50% |
(16.4) |
(24.8) |
2% |
51% |
Total |
213.9 |
226.3 |
27% |
6% |
229.9 |
242.7 |
7% |
6% |
0.2 |
257.8 |
6% |
4% |
Adjusted EBITDA |
||||||||||||
Westcon |
134.3 |
145.5 |
21% |
8% |
142.4 |
155.7 |
7% |
9% |
150.9 |
164.1 |
5% |
9% |
Logicalis |
100.4 |
106.8 |
23% |
6% |
108.5 |
116.2 |
9% |
7% |
117.1 |
123.2 |
6% |
5% |
Logicalis International |
79.1 |
88.0 |
19% |
11% |
84.1 |
92.4 |
5% |
10% |
89.3 |
97.0 |
5% |
9% |
Logicalis Latam |
21.4 |
18.8 |
49% |
-12% |
24.4 |
23.8 |
26% |
-3% |
27.7 |
26.2 |
10% |
-5% |
Corporate & Management Consulting |
(10.8) |
(18.7) |
24% |
73% |
(11.0) |
(19.1) |
2% |
74% |
(11.1) |
(19.5) |
2% |
75% |
Total |
223.9 |
233.6 |
22% |
4% |
239.9 |
252.7 |
8% |
5% |
256.9 |
267.8 |
6% |
4% |
Adjusted EBITDA margin |
||||||||||||
Westcon |
3.5% |
4.0% |
0.7pp |
0.5pp |
3.5% |
4.1% |
0.1pp |
0.6pp |
3.5% |
4.2% |
0.1pp |
0.7pp |
Logicalis International |
6.1% |
7.5% |
1.6pp |
1.3pp |
6.3% |
7.6% |
0.1pp |
1.3pp |
6.5% |
7.8% |
0.1pp |
1.2pp |
Logicalis Latam |
4.0% |
4.1% |
1.7pp |
0.1pp |
4.4% |
5.0% |
0.8pp |
0.6pp |
4.7% |
5.2% |
0.3pp |
0.5pp |
Source: Edison Investment Research
Valuation
On a group basis, Datatec is valued on a minority-adjusted EV/adjusted EBITDA multiple of 2.7x FY25e and 2.5x FY26e and on a normalised P/E basis of 7.1x FY25e and 6.1x FY26. To more accurately reflect the dynamics of the different divisions, we continue to value Datatec on a SOTP basis. We note that we have upgraded group adjusted EBITDA by 4% for FY25 and 5% for FY26.
Using the EV/EBITDA peer multiples in Exhibit 13, FY25e net debt (we add $150m to this as the group typically operates at a higher level of net debt across the year) and a 30% discount (South Africa sovereign risk and holding company discount), we arrive at a per-share valuation of ZAR78.68. This implies 102% upside from the current share price.
Exhibit 13: Sum-of-the-parts valuation
$m |
Revenues |
Adjusted EBITDA |
||||
FY25e |
FY26e |
FY25e |
FY26e |
|||
Logicalis International |
1,175 |
1,210 |
88 |
92 |
||
Logicalis Latin America |
456 |
479 |
19 |
24 |
||
Westcon |
3,630 |
3,775 |
146 |
156 |
||
Mason Advisory and central costs |
(19) |
(19) |
||||
Peer multiples (x) |
Revenues |
EBITDA |
||||
FY25e |
FY26e |
FY25e |
FY26e |
|||
Logicalis International |
0.8 |
0.8 |
9.2 |
8.5 |
||
Logicalis Latin America |
0.4 |
0.3 |
4.4 |
3.8 |
||
Westcon |
0.4 |
0.4 |
9.1 |
8.1 |
||
Mason Advisory and central costs |
8.0 |
8.0 |
||||
$m |
Implied EV based on |
|||||
Revenues |
EBITDA |
Economic interest |
Mean EV |
|||
FY25e |
FY26e |
FY25e |
FY26e |
|||
Logicalis International |
986 |
960 |
805 |
783 |
91% |
726 |
Logicalis Latin America |
173 |
162 |
83 |
90 |
68% |
59 |
Westcon |
1,595 |
1,508 |
1,323 |
1,254 |
89% |
1,150 |
Mason Advisory and central costs |
(150) |
(153) |
100% |
(150) |
||
Group EV |
1,786 |
|||||
Assumed average net debt |
(331) |
|||||
SOTP – Equity value |
1,454 |
|||||
Discount for: RSA sovereign risk, holding company risk |
30% |
|||||
Adjusted equity value |
1,018 |
|||||
Shares in issue (m) |
232.6 |
|||||
SOTP value per share (US$) |
4.38 |
|||||
SOTP value per share (ZAR) |
78.68 |
|||||
Latest share price (ZAR) |
38.87 |
|||||
Upside from latest share price |
102% |
|||||
Source: Edison Investment Research, LSEG Data & Analytics (as at 13 November)
The strategic review to close the valuation gap is ongoing. In the current higher interest rate environment, we believe that M&A transactions are less likely. Management is focused on operational improvements across the three divisions, as evidenced by the improving quality of earnings, and has brought senior management into the equity of the individual businesses. We believe further transactions may take place in the medium term when market conditions start to improve.
Exhibit 14: Financial summary
28-February |
$'000s |
2020 |
2021 |
2022 |
2023 |
2024 |
2025e |
2026e |
2027e |
|
INCOME STATEMENT |
IFRS |
IFRS |
IFRS |
IFRS |
IFRS |
IFRS |
IFRS |
IFRS |
||
Revenue |
|
|
4,214,421 |
4,109,463 |
4,546,398 |
5,143,125 |
5,457,947 |
5,303,600 |
5,508,977 |
5,703,590 |
Cost of Sales |
(3,472,843) |
(3,418,939) |
(3,816,630) |
(4,398,618) |
(4,595,711) |
(4,403,919) |
(4,575,674) |
(4,737,644) |
||
Gross Profit |
741,578 |
690,524 |
729,768 |
744,507 |
862,236 |
899,681 |
933,302 |
965,946 |
||
Adjusted EBITDA |
|
|
166,280 |
152,490 |
158,922 |
180,182 |
192,085 |
233,598 |
252,738 |
267,799 |
EBITDA |
158,657 |
118,619 |
143,457 |
98,246 |
177,589 |
226,254 |
242,738 |
257,799 |
||
Normalised operating profit |
|
|
105,157 |
97,859 |
100,540 |
123,677 |
131,186 |
177,396 |
191,237 |
205,207 |
Amortisation of acquired intangibles |
(11,297) |
(8,635) |
(10,100) |
(11,629) |
(3,599) |
(8,000) |
(5,500) |
(4,000) |
||
Exceptionals |
(3,700) |
(27,771) |
0 |
(40,915) |
(2,950) |
(607) |
0 |
0 |
||
Share-based payments |
(7,623) |
(11,493) |
(15,465) |
(52,641) |
(8,277) |
(10,000) |
(10,000) |
(10,000) |
||
Reported operating profit |
82,537 |
49,960 |
74,975 |
18,492 |
116,360 |
158,789 |
175,737 |
191,207 |
||
Net Interest |
(25,874) |
(25,692) |
(31,051) |
(38,090) |
(54,966) |
(54,610) |
(49,695) |
(49,695) |
||
Joint ventures & associates (post tax) |
(204) |
908 |
(427) |
882 |
251 |
0 |
0 |
0 |
||
Exceptionals |
2,029 |
59 |
540 |
(1,333) |
14,820 |
1,938 |
0 |
0 |
||
Profit Before Tax (norm) |
|
|
79,079 |
73,075 |
69,062 |
86,469 |
76,471 |
122,787 |
141,543 |
155,513 |
Profit Before Tax (reported) |
|
|
58,488 |
25,235 |
44,037 |
(20,049) |
76,465 |
106,118 |
126,043 |
141,513 |
Reported tax |
(31,809) |
(19,540) |
(9,470) |
(13,375) |
(25,527) |
(35,019) |
(41,594) |
(46,699) |
||
Profit After Tax (norm) |
34,615 |
30,034 |
36,179 |
56,205 |
50,942 |
82,267 |
94,834 |
104,194 |
||
Profit After Tax (reported) |
26,679 |
5,695 |
34,567 |
(33,424) |
50,938 |
71,099 |
84,449 |
94,814 |
||
Minority interests |
(13,772) |
(3,103) |
(6,431) |
(3,209) |
(5,137) |
(9,358) |
(9,888) |
(10,415) |
||
Discontinued operations |
1,332 |
0 |
5,766 |
116,967 |
0 |
0 |
0 |
0 |
||
Net income (normalised) |
20,843 |
26,938 |
29,748 |
52,996 |
45,805 |
72,909 |
84,946 |
93,779 |
||
Net income (reported) |
14,239 |
2,592 |
33,902 |
80,334 |
45,801 |
61,741 |
74,561 |
84,399 |
||
Average number of shares outstanding (m) |
210.5 |
198.8 |
203.2 |
218.0 |
224.8 |
230.8 |
232.6 |
232.6 |
||
EPS - diluted normalised (c) |
|
|
9.7 |
13.2 |
14.2 |
24.1 |
19.7 |
30.5 |
35.3 |
38.9 |
EPS - basic reported (c) |
|
|
6.8 |
1.3 |
16.7 |
36.9 |
20.4 |
26.8 |
32.0 |
36.3 |
EPS - Company underlying uEPS (c) |
|
|
9.9 |
13.5 |
16.0 |
6.1 |
17.1 |
27.9 |
33.6 |
37.4 |
Dividend (c) |
7.0 |
6.6 |
39.3 |
77.7 |
7.0 |
9.3 |
11.2 |
12.5 |
||
Revenue growth (%) |
(2.7) |
(2.5) |
10.6 |
13.1 |
6.1 |
(2.8) |
3.9 |
3.5 |
||
Gross Margin (%) |
17.6 |
16.8 |
16.1 |
14.5 |
15.8 |
17.0 |
16.9 |
16.9 |
||
Adj. EBITDA Margin (%) |
3.9 |
3.7 |
3.5 |
3.5 |
3.5 |
4.4 |
4.6 |
4.7 |
||
Normalised Operating Margin |
2.5 |
2.4 |
2.2 |
2.4 |
2.4 |
3.3 |
3.5 |
3.6 |
||
BALANCE SHEET |
||||||||||
Fixed Assets |
|
|
512,598 |
554,690 |
613,155 |
610,565 |
741,075 |
743,375 |
746,212 |
751,001 |
Intangible Assets |
291,279 |
314,486 |
320,089 |
293,184 |
335,621 |
333,611 |
332,047 |
331,789 |
||
Tangible Assets |
43,300 |
39,987 |
32,517 |
33,054 |
35,823 |
40,134 |
44,535 |
49,581 |
||
Right-of-use assets |
83,953 |
94,837 |
80,639 |
56,248 |
55,991 |
55,991 |
55,991 |
55,991 |
||
Investments & other |
94,066 |
105,380 |
179,910 |
228,079 |
313,640 |
313,640 |
313,640 |
313,640 |
||
Current Assets |
|
|
2,083,928 |
2,242,568 |
2,399,078 |
3,015,700 |
2,892,261 |
2,870,273 |
2,991,719 |
3,110,993 |
Stocks |
253,271 |
242,005 |
309,227 |
411,059 |
324,868 |
337,835 |
363,547 |
389,395 |
||
Debtors |
1,110,510 |
1,108,105 |
1,223,824 |
1,508,470 |
1,488,867 |
1,511,163 |
1,584,774 |
1,656,385 |
||
Cash & cash equivalents |
347,189 |
488,632 |
453,926 |
584,683 |
569,035 |
510,836 |
531,915 |
552,582 |
||
Other |
372,958 |
403,826 |
412,101 |
511,488 |
509,491 |
510,440 |
511,483 |
512,631 |
||
Current Liabilities |
|
|
(1,765,823) |
(1,980,013) |
(2,152,175) |
(2,869,641) |
(2,829,580) |
(2,750,361) |
(2,800,202) |
(2,843,949) |
Creditors |
(1,275,690) |
(1,401,804) |
(1,544,198) |
(2,088,899) |
(2,048,883) |
(1,974,129) |
(2,018,029) |
(2,056,146) |
||
Short term borrowings |
(338,945) |
(392,877) |
(433,176) |
(577,224) |
(581,233) |
(581,233) |
(581,233) |
(581,233) |
||
Lease liabilities |
(34,325) |
(36,398) |
(32,870) |
(27,005) |
(26,243) |
(26,243) |
(26,243) |
(26,243) |
||
Other |
(116,863) |
(148,934) |
(141,931) |
(176,513) |
(173,221) |
(168,756) |
(174,697) |
(180,328) |
||
Long Term Liabilities |
|
|
(187,610) |
(176,624) |
(229,112) |
(224,284) |
(234,612) |
(233,385) |
(235,018) |
(236,565) |
Long term borrowings |
(18,638) |
(42,371) |
(56,440) |
(41,624) |
(39,138) |
(39,138) |
(39,138) |
(39,138) |
||
Lease liabilities |
(95,148) |
(77,847) |
(61,523) |
(45,412) |
(45,548) |
(45,548) |
(45,548) |
(45,548) |
||
Other long term liabilities |
(73,824) |
(56,406) |
(111,149) |
(137,248) |
(149,926) |
(148,699) |
(150,332) |
(151,879) |
||
Net Assets |
|
|
643,093 |
640,621 |
630,946 |
532,340 |
569,144 |
629,903 |
702,712 |
781,480 |
Minority interests |
(70,778) |
(57,465) |
(67,516) |
(60,331) |
(67,911) |
(77,269) |
(87,156) |
(97,571) |
||
Shareholders equity |
|
|
572,315 |
583,156 |
563,430 |
472,009 |
501,233 |
552,634 |
615,555 |
683,909 |
CASH FLOW |
||||||||||
Op Cash Flow before WC and tax |
169,980 |
157,888 |
162,842 |
191,840 |
188,816 |
236,861 |
252,738 |
267,799 |
||
Working capital |
57,231 |
79,903 |
(76,807) |
(18,203) |
29,583 |
(115,709) |
(47,849) |
(52,166) |
||
Exceptional & other |
19,330 |
(3,453) |
10,677 |
(231) |
(42,829) |
382 |
(1,044) |
(1,148) |
||
Tax |
(36,941) |
(36,597) |
(26,282) |
(24,182) |
(27,108) |
(35,019) |
(41,594) |
(46,699) |
||
Operating cash flow |
|
|
209,600 |
197,741 |
70,430 |
149,224 |
148,462 |
86,516 |
162,251 |
167,787 |
Capex |
(28,036) |
(35,145) |
(24,841) |
(36,669) |
(39,511) |
(40,924) |
(42,400) |
(43,942) |
||
Acquisitions/disposals |
(9,179) |
(3,694) |
(16,424) |
114,821 |
(16,849) |
(1,403) |
0 |
0 |
||
Net interest |
(30,972) |
(25,745) |
(31,265) |
(38,596) |
(55,465) |
(54,610) |
(49,695) |
(49,695) |
||
Equity financing |
(51,683) |
(2,808) |
(6,150) |
(7,725) |
6,633 |
(4,208) |
0 |
0 |
||
Dividends |
(15,137) |
(4,905) |
(43,136) |
(154,399) |
(13,925) |
(16,132) |
(21,640) |
(26,045) |
||
Other |
20,019 |
1,880 |
(2,034) |
(2,914) |
(11,957) |
(27,438) |
(27,438) |
(27,438) |
||
Net Cash Flow |
94,612 |
127,324 |
(53,420) |
23,742 |
17,388 |
(58,199) |
21,079 |
20,667 |
||
Opening net debt/(cash) |
|
|
100,753 |
139,867 |
60,874 |
130,096 |
106,595 |
123,140 |
181,339 |
160,260 |
FX and non-cash movements |
(133,726) |
(48,331) |
(15,802) |
(241) |
(33,933) |
0 |
0 |
0 |
||
Closing net debt/(cash) |
|
|
139,867 |
60,874 |
130,096 |
106,595 |
123,140 |
181,339 |
160,260 |
139,593 |
Source: Datatec, Edison Investment Research
|
|
Research: Industrials
Braemar’s H125 results were in line with expectations, with modest revenue growth and some operational gearing evident in operating profit. The underlying activities continue to expand and diversify and Braemar remains well-positioned to drive its growth strategy. The trading outlook for FY25 is promising and we expect the company to be able to leverage its strong balance sheet in pursuit of strategic growth in a fragmented market. We maintain our underlying revenue and operating profit estimates for FY25 and FY26, as well as our 535p valuation, although EPS is affected by a reassessment of the number of shares in issue. Estimated end-FY25 net cash improves to £2.5m from a more modest net cash position.