Last close As at 05/08/2026
—
— 0.00 (0.00%)
Market capitalisation
—
Research: TMT
Doctor Care Anywhere Group’s (DOC) Q221 update highlights that underlying revenue has continued to increase, driven by its expanding internet hospital and subsequent growth in diagnostic referrals. Management remains confident that FY21 revenue will be at least 100% above FY20 levels, implying a total revenue of at least £23.2m. Its balance sheet remains strong with net cash of £31.5m. The expected Q421 launch of its digitally integrated virtual and in-person primary care service with Nuffield Health will be a UK first.
Written by
Doctor Care Anywhere Group |
On track to meet 100% growth target |
Q221 trading update |
Healthcare equipment & services |
29 July 2021 |
Share price performance
Business description
Next events
Analysts
Doctor Care Anywhere Group is a research client of Edison Investment Research Limited |
|||||||||||||||||||||||||||||||||||||||||||||||||||
Doctor Care Anywhere Group's (DOC) Q221 update highlights that underlying revenue has continued to increase, driven by its expanding internet hospital and subsequent growth in diagnostic referrals. Management remains confident that FY21 revenue will be at least 100% above FY20 levels, implying a total revenue of at least £23.2m. Its balance sheet remains strong with net cash of £31.5m. The expected Q421 launch of its digitally integrated virtual and in-person primary care service with Nuffield Health will be a UK first.
Year end |
Revenue (£m) |
PBT* |
EPS* |
DPS |
EV/Sales |
P/E |
12/19 |
5.7 |
(4.4) |
(3.7) |
0.0 |
18.1 |
N/A |
12/20 |
11.6 |
(13.5) |
(7.8) |
0.0 |
8.9 |
N/A |
12/21e |
23.4 |
(16.3) |
(5.1) |
0.0 |
4.5 |
N/A |
12/22e |
37.4 |
(9.0) |
(2.8) |
0.0 |
2.8 |
N/A |
Note: *PBT and EPS are normalised, excluding amortisation of acquired intangibles, exceptional items and share-based payments.
Strong demand evident in Q2
Underlying revenue increased to £4.8m in Q221, up 78% y-o-y and 8% q-o-q. Diagnostic referrals (+34.4% q-o-q) drove this increase, as consultations remained substantially flat q-o-q at 89.4k. Eligible lives also remained broadly flat q-o-q at 2.36m, but this is in line with our end-FY21 forecast of 2.39m. Activated lives were 558.7k, up 13% q-o-q and 90% y-o-y, signalling increased demand within its existing customer base. The group’s balance sheet at the end of the period was strong, with net cash of £31.5m (Q121: £35.1m).
Outlook maintained for FY21
Management has maintained guidance for FY21 and is expecting revenue of at least £23.2m (up at least 100% y-o-y). Constraints in GP availability, mainly due to roll-out of the UK’s vaccination programme, resulted in consultations remaining flat q-o-q during Q221. However, consultations should rise in H221 given the increase in activated lives during the quarter and pent-up demand from Q2. 71 new GPs were onboarded in Q221 and 100 more are in the pipeline for Q321, which should support this expected rise in demand. On 25 May, DOC announced a strengthened partnership with Nuffield Health to develop the UK’s first digitally integrated virtual and in-person primary care service. We understand that referrals to in-person primary care could be another potential revenue source, while the partnership could generate more subscription licences and activated lives after it launches in Q421. Our forecasts for FY21 and FY22 remain unchanged.
Valuation: Remaining at a discount to peer group
DOC trades on forecast EV/Sales multiples of 4.5x and 2.8x for FY21e and FY22e respectively, a significant discount to the 9.0x and 6.8x average respectively for our peer group of global telehealth companies. We maintain the view that this discount should reduce as DOC continues to build up a track record and execute on its growth strategy.
Review of Q221 trading update
DOC’s Q221 activity report showed that revenue is continuing to rise in 2021, in line with both Edison’s and management’s expectations. The rise in activated lives indicates a level of pent-up demand which, when met with a growth in supply of GPs on DOC’s platform, should result in further growth in revenue in H221.
Financial performance
Group underlying revenue increased by 78% y-o-y and 8% q-o-q to £4.8m in Q221, driven by growth in diagnostic referrals rather than in consultations, which remained flat q-o-q. Growth in diagnostic referrals shows that DOC is successfully expanding its internet hospital offering, which offers both primary and secondary care services. In line with our last update note, we expect growth in secondary care services to accelerate following the end of most of the COVID-19-related restrictions in the UK. Total revenue fell by 25.6% q-o-q due to £2m incentive payments and payments for technology development received in Q1.
Underlying gross profit for Q221 was £1.9m, down by 1.6% q-o-q but up 47.5% y-o-y. Underlying gross profit margin was 39.3%, down 3.9pp from the previous quarter. Both reductions are attributable to the additional financial incentives paid to doctors, as a result of both higher than expected demand and constraints on GP supply due to their reallocation of time to the UK’s vaccination roll-out. We expect this to normalise in H221 as the UK reaches the latter stages of its vaccination roll-out.
DOC’s balance sheet remains robust, ending Q221 with net cash of £31.5m versus £35.1m at the end of Q121. Net cash burn of £3.6m resulted from net operating cash outflows of £2.8m, net investing cash outflows of £0.6m and net financing cash outflows of £0.2m. Its net cash position by the half year was higher than our forecasts and we therefore anticipate that the group will finish 2021 comfortably within our estimate of £20.9m net cash.
Exhibit 1: DOC Q2 results summary
£m |
Q221 |
Q121 |
q-o-q change |
Q220 |
y-o-y change |
Revenue |
4.8 |
6.4 |
(25.6%) |
2.7 |
78.1% |
Gross profit |
1.9 |
3.9 |
(52.0%) |
1.3 |
47.5% |
Gross margin |
39.4% |
61.0% |
(21.6ppt) |
47.5% |
(8.2ppt) |
Contribution |
0.5 |
2.9 |
(81.3%) |
0.4 |
34.3% |
Contribution margin |
11.3% |
45.0% |
(33.7ppt) |
15.0% |
(3.7ppt) |
Underlying basis* |
|||||
Revenue |
4.8 |
4.4 |
8.1% |
2.7 |
78.1% |
Gross profit |
1.9 |
1.9 |
(1.6%) |
1.3 |
47.5% |
Gross margin |
39 3% |
43.2% |
(3.9ppt) |
47.5% |
(8.2ppt) |
Contribution |
0.5 |
0.9 |
(39.0%) |
0.4 |
34.1% |
Contribution margin |
11.3% |
20.0% |
(8.7ppt) |
15.0% |
(3.7ppt) |
Source: Company data. Note: *Excludes one-off revenue such as underwritten volume top-up payments, tech platform licensing fees and digital design service fees.
Operational performance
Eligible Lives (2.36m at end Q221; +0% q-o-q and +10% y-o-y)
Eligible Lives refers to the number of people that can use DOC’s platform across all its channel partners at the end of a given period. This figure remained broadly flat q-o-q at 2.36m, given that no new partnerships were formed. However, this is in line with our forecasts for 2.39m by the end of FY21.
Activated Lives (558.7k at end Q221; +13% q-o-q and +90% y-o-y)
Activated Lives refers to the number of eligible lives that are signed up to DOC’s platform in a given period. During Q221, activated lives grew by 90% y-o-y and by 13% q-o-q to 558.7k (Q121: 495.9k), highlighting that demand has continued to build during the period. The group remains comfortably on track to meet our end-FY21 forecast of 596k.
|
Exhibit 2: Activated lives (000’s) at period end |
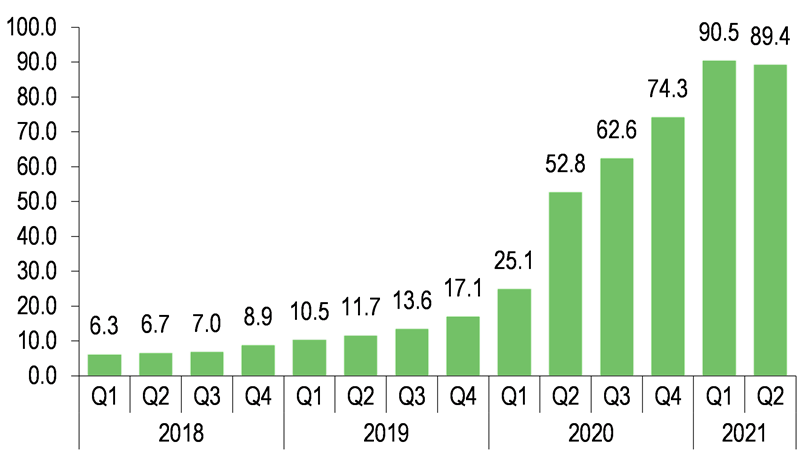
Exhibit 3: Consultations (000’s) at period end |
|
|
|
Source: Company data |
|
Exhibit 2: Activated lives (000’s) at period end |
|
|
Source: Company data |
|
Exhibit 3: Consultations (000’s) at period end |
|
|
Source: Company data |
Consultations (89.4k at end Q221; (1%) q-o-q and +69% y-o-y)
Consultations are the number of Virtual GP (VGP) appointments that are delivered over DOC’s platform during the period. Utilisation revenue, DOCS’s primary revenue source, is based on the number of consultations performed and so is a key performance indicator for the group. In Q221, DOC undertook 89.4k consultations, a 1% fall q-o-q or 69% increase y-o-y. Supply constraints were the primary reason for the slight decline, mainly due to GPs being recalled to conduct the roll-out of the UK’s vaccination programme. However, demand remains strong as illustrated by the growth in activated lives, which should drive consultation growth in H221. Confirmation of this growing demand was evidenced by DOC achieving a record 2,146 consultations conducted in a single day, up 33% on the previous highest number in a day. Record consultation volumes were also seen across all days of the week at quarter end.
Additional capacity will be key to supporting the expected growth in consultations, and so management has onboarded 71 GPs during Q221, bringing its panel total to 315; an additional 100 GPs are in the pipeline for H221. Management believes this recruitment drive will allow for 45,000 appointments per month by the end of Q3, significantly higher than what it currently achieves (although the exact number is not disclosed). Subsequently, we believe that growth will be H2 weighted and that the company is on track to meet our forecast of 432k consultations in 2021.
New contracts
DOC’s expanded partnership with Nuffield Health will create the UK’s first digitally integrated virtual and in-person primary care service, allowing for increased coverage of care. Its previous arrangement, which started in October 2016, provided access to DOC’s virtual GP service but did not include this extension of Nuffield Health’s nationwide network of face-to-face GPs via one digital platform. The ability to offer more services such as women’s health, travel and immunisation clinics and chronic disease management programmes diversifies potential streams and additional revenue will be achieved primarily through referrals to in-person care from DOC’s platform. Pre-marketing to Nuffield Health’s network of 1,600 corporate clients has already begun and the agreement should lead to an increase in activated lives and subscription licences.
In addition, DOC announced a partnership with Partners&, a business insurance broker, during the period and will provide its clients with both mental and physical healthcare services. This is DOC’s first partnership to include mental health, showing both the expanding scope of its platform and management’s execution of stated IPO commitments. In the same style as its VGP consultations, Partners&’s clients will be able to access 20- to 40-minute appointments all year round, while also having access to the mental wellbeing tools developed by DOC’s partners, Koa Foundations and Kooth.
Unchanged outlook and forecasts
After another robust quarter, management has reaffirmed guidance that revenue growth in 2021 will be at least 100% above 2020 levels (£11.6m), implying total revenue of at least £23.2m. For H221, performance will be driven by an anticipated increase in consultations, underpinned by the level of pent-up demand indicated by a sustained increase in activated lives in H121. Consultation supply constraints should also be eased by the increase in supply of GPs onboarded onto DOC’s platform. Additionally, its JV internet hospital offering with AXA Health should benefit following the end of most COVID-19-related restrictions, where growth in secondary care services is expected to accelerate, after being curtailed by lockdowns. To reach management’s guided figure of £23.2m for 2021, the group will need to achieve H221 revenues of £12.1m, 34% higher than the combined Q1 and Q2 underlying revenue of £9.2m but in line with our forecasts.
We have left our forecasts for FY21 and FY22 unchanged from our recent upgrades following DOC’s Q121 results, which accounted for the £2m one-off revenue earned in Q121.
Exhibit 4: Financial summary
£m |
2018 |
2019 |
2020 |
2021e |
2022e |
||
31-December |
IFRS |
IFRS |
IFRS |
IFRS |
IFRS |
||
INCOME STATEMENT |
|||||||
Total Revenue |
2.0 |
5.7 |
11.6 |
23.4 |
37.4 |
||
Underlying Revenue |
2.0 |
5.7 |
11.6 |
21.5 |
37.4 |
||
Cost of Sales |
(0.8) |
(1.4) |
(5.9) |
(12.2) |
(21.9) |
||
Gross Profit |
1.2 |
4.4 |
5.7 |
11.2 |
15.6 |
||
Normalised EBITDA |
(4.2) |
(3.7) |
(11.6) |
(15.5) |
(11.4) |
||
Normalised operating profit |
(5.1) |
(4.4) |
(12.6) |
(16.6) |
(12.6) |
||
Amortisation of acquired intangibles |
- |
- |
- |
- |
- |
||
Exceptionals |
- |
- |
6.0 |
- |
- |
||
Share-based payments |
- |
(0.1) |
(2.2) |
- |
- |
||
Reported EBITDA |
(4.1) |
(3.8) |
(7.8) |
(15.5) |
(11.4) |
||
Reported operating profit |
(5.1) |
(4.5) |
(8.7) |
(16.6) |
(12.6) |
||
Net Interest |
(0.0) |
(0.0) |
(0.1) |
- |
- |
||
Joint ventures & associates (post tax) |
- |
- |
(0.8) |
0.3 |
3.7 |
||
Exceptionals |
- |
(1.3) |
(21.7) |
- |
- |
||
Profit Before Tax (norm) |
(5.2) |
(4.4) |
(13.5) |
(16.3) |
(9.0) |
||
Profit Before Tax (reported) |
(5.1) |
(5.8) |
(31.4) |
(16.3) |
(9.0) |
||
Reported tax |
0.1 |
0.1 |
0.1 |
- |
- |
||
Profit After Tax (norm) |
(5.0) |
(4.4) |
(13.4) |
(16.2) |
(8.9) |
||
Profit After Tax (reported) |
(5.0) |
(5.7) |
(31.3) |
(16.2) |
(8.9) |
||
116.4 |
117.4 |
171.9 |
318.7 |
318.7 |
|||
Basic average number of shares outstanding (m) |
116.4 |
117.4 |
171.9 |
318.7 |
318.7 |
||
EPS - basic normalised (p) |
(4.31) |
(3.71) |
(7.81) |
(5.09) |
(2.80) |
||
EPS - diluted normalised (p) |
(4.31) |
(3.71) |
(7.81) |
(5.09) |
(2.80) |
||
EPS - basic reported (p) |
(4.28) |
(4.83) |
(18.20) |
(5.09) |
(2.80) |
||
Revenue growth (%) |
N/A |
184.2 |
102.1 |
102.2 |
59.9 |
||
Gross Margin (%) |
58.0 |
76.1 |
49.2 |
47.7 |
41.6 |
||
EBITDA Margin (%) |
(204.7) |
(66.0) |
(67.3) |
(66.3) |
(30.4) |
||
Normalised Operating Margin |
(255.3) |
(76.9) |
(108.5) |
(70.8) |
(33.7) |
||
BALANCE SHEET |
|||||||
Fixed Assets |
3.0 |
3.8 |
7.5 |
8.8 |
13.3 |
||
Intangible Assets |
2.8 |
3.6 |
3.6 |
4.5 |
5.3 |
||
Tangible Assets |
0.1 |
0.3 |
1.7 |
1.8 |
1.8 |
||
Investments & other |
0.0 |
0.0 |
2.2 |
2.5 |
6.2 |
||
Current Assets |
2.3 |
1.2 |
42.0 |
27.7 |
19.7 |
||
Stocks |
0.0 |
0.0 |
0.0 |
0.0 |
0.0 |
||
Debtors |
0.6 |
0.6 |
3.6 |
6.7 |
11.7 |
||
Cash & cash equivalents |
1.7 |
0.6 |
38.4 |
20.9 |
7.9 |
||
Other |
0.0 |
0.0 |
0.0 |
0.0 |
0.0 |
||
Current Liabilities |
(2.0) |
(2.1) |
(3.8) |
(7.0) |
(12.4) |
||
Creditors |
(2.0) |
(2.1) |
(3.8) |
(7.0) |
(12.4) |
||
Tax and social security |
0.0 |
0.0 |
0.0 |
0.0 |
0.0 |
||
Short term borrowings |
0.0 |
0.0 |
0.0 |
0.0 |
0.0 |
||
Other |
0.0 |
0.0 |
0.0 |
0.0 |
0.0 |
||
Long Term Liabilities |
(2.9) |
(8.2) |
(1.2) |
(1.2) |
(1.2) |
||
Long term borrowings |
0.0 |
0.0 |
0.0 |
0.0 |
0.0 |
||
Other long-term liabilities |
(2.9) |
(8.2) |
(1.2) |
(1.2) |
(1.2) |
||
Net Assets |
0.4 |
(5.4) |
44.5 |
28.3 |
19.4 |
||
Minority interests |
0.0 |
0.0 |
0.0 |
0.0 |
0.0 |
||
Shareholders' equity |
0.4 |
(5.4) |
44.5 |
28.3 |
19.4 |
||
CASH FLOW |
|||||||
Op Cash Flow before WC and tax |
(5.1) |
(4.4) |
(12.5) |
(16.6) |
(12.6) |
||
Working capital |
1.0 |
0.3 |
(1.2) |
0.1 |
0.4 |
||
Exceptional & other |
1.1 |
0.9 |
3.2 |
1.1 |
1.2 |
||
Tax |
0.1 |
(0.1) |
(0.0) |
0.0 |
0.0 |
||
Net operating cash flow |
(2.8) |
(3.3) |
(10.7) |
(15.4) |
(11.0) |
||
Capex |
(0.0) |
(0.1) |
(0.4) |
(0.5) |
(0.5) |
||
Acquisitions/disposals |
0.0 |
0.0 |
3.0 |
0.0 |
0.0 |
||
Net interest |
0.0 |
(0.3) |
(0.3) |
0.0 |
0.0 |
||
Equity financing |
0.0 |
0.2 |
31.2 |
0.0 |
0.0 |
||
Dividends |
0.0 |
0.0 |
0.0 |
0.0 |
0.0 |
||
Other |
1.8 |
2.3 |
14.9 |
(1.6) |
(1.6) |
||
Net Cash Flow |
(1.1) |
(1.1) |
37.8 |
(17.5) |
(13.1) |
||
Opening net debt/(cash) |
(2.8) |
(1.7) |
(0.6) |
(38.4) |
(21.0) |
||
FX |
0.0 |
0.0 |
0.0 |
0.0 |
0.0 |
||
Closing net debt/(cash) |
(1.7) |
(0.6) |
(38.4) |
(21.0) |
(7.9) |
Source: Company data, Edison Investment Research
|
|
Research: Consumer
musicMagpie’s (MMAG) maiden interim results following its admission to AIM demonstrated underlying revenue growth with expanding gross margins. There are encouraging results from new initiatives that aim to generate incremental revenue streams in new markets including recurring telephony subscriptions (versus historical one-off revenues), and new sources of product including corporate recycling and SMARTDrop kiosks. These have the potential to become important contributors to MMAG’s growth prospects.