Orexo has received a $2.5m (c SEK22m) milestone from AstraZeneca on the start of Phase I trials for respiratory programme, OX-CLI (also known as AZD9898). Orexo now has two clinical assets (the other being Phase III-ready acute pain programme OX-51) and three preclinical projects (OX-MPI [inflammation] plus two novel formulation technologies). This milestone does not impact FY17 guidance but indicates growing momentum in the early-stage development pipeline. We expect further news on new product opportunities this year; both pipeline project(s) and commercial product(s) for US promotion, in addition to potential EMA approval of Zubsolv (Q417).
Written by
Orexo |
More signs of pipeline promise |
Milestone receipt |
Pharma & biotech |
9 June 2017 |
Share price performance
Business description
Next events
Analysts
Orexo is a research client of Edison Investment Research Limited |
|||||||||||||||||||||||||||||||||||||||||||||||||||||
Orexo has received a $2.5m (c SEK22m) milestone from AstraZeneca on the start of Phase I trials for respiratory programme, OX-CLI (also known as AZD9898). Orexo now has two clinical assets (the other being Phase III-ready acute pain programme OX-51) and three preclinical projects (OX-MPI [inflammation] plus two novel formulation technologies). This milestone does not impact FY17 guidance but indicates growing momentum in the early-stage development pipeline. We expect further news on new product opportunities this year; both pipeline project(s) and commercial product(s) for US promotion, in addition to potential EMA approval of Zubsolv (Q417).
Year end |
Revenue (SEKm) |
PBT* |
EPS* |
DPS |
P/E |
Yield |
12/15** |
646.2 |
(203.6) |
(6.1) |
0.0 |
N/A |
N/A |
12/16 |
705.9 |
35.6 |
0.8 |
0.0 |
34.4 |
N/A |
12/17e |
696.5 |
29.3 |
0.4 |
0.0 |
68.8 |
N/A |
12/18e |
750.1 |
82.8 |
1.9 |
0.0 |
14.5 |
N/A |
Note: *PBT and EPS are normalised, excluding amortisation of acquired intangibles, exceptional items and share-based payments. ** Restated.
A growing pipeline beyond Zubsolv
Of Orexo’s five R&D stage assets OX-CLI is the only one partnered. Licensed to AstraZeneca in 2016, Orexo is eligible for success-based development/commercial milestones and a tiered single-digit net sales royalty. Partnering discussions are ongoing for OX-MPI and OX-51, but deal timing is unknown. Orexo is also applying its significant formulation technology expertise to generate an early-stage pipeline: two novel oral and second-generation sublingual formulations are being assessed. Subject to demonstrating proof of principle, more disclosure is expected in H217.
Zubsolv: Growth maintained in Q1
Changes in formulary status/market access position for opioid-dependence drugs from 1 January mean that the first quarter of the year is the most volatile. Against this background, in Q117 US Zubsolv net sales grew 16% vs Q116 to SEK114.1m. Volume, price and FX movement contributed to growth, although wholesaler inventory levels and higher gross-to-net deductions moderated this growth.
Financials: FY17 guidance unchanged
FY guidance was reiterated at the Q17 results and is unchanged post the AZ milestone receipt. Orexo expects y-o-y Zubsolv net revenue growth (market growth and share gains), operating expenses of SEK500-510m and positive EBITDA (on current FX rates), albeit with negative H117 EBITDA (reflecting Abstral royalties).
Valuation: SEK3.28bn or SEK95/share
Rolling forward and updating our model for the AZ milestone and prevailing FX rate modestly increases our valuation to SEK3.28bn or SEK95/share (vs SEK3.16bn; SEK91/share). Sensitivity analysis indicates that near-to-mid-term Zubsolv market share gains are the most important determinant of upside. We currently do not explicitly value R&D assets given limited visibility on development plans/timelines.
Valuation
Our Orexo valuation has increased to SEK3.28bn or SEK95/share (vs SEK3.16bn or SEK91/share previously) following tweaks to our forecasts (see financials section and Exhibit 1 below), inclusion of the AstraZeneca milestone, rolling forward our financial model and updating the prevailing FX rates (now SEK8.69/US$ from SEK8.82/US$; SEK9.76/€ from SEK9.46/€). All other assumptions as outlined in our February Outlook report are maintained.
Exhibit 1: Zubsolv revenue assumptions to 2022
Assumption |
2016 |
2017e |
2018e |
2019e |
2020e |
2021e |
2022e |
US current market |
|||||||
US Zubsolv sales (current) – pre-rebates ($m) |
115.9 |
129.1 |
148.3 |
167.6 |
199.3 |
230.9 |
263.0 |
US Zubsolv sales (current) – post-rebates ($m) |
54.5 |
59.4 |
73.8 |
89.7 |
109.6 |
127.0 |
144.6 |
US Zubsolv sales (current) – post-rebates (SEKm) |
481.8 |
518.2 |
641.2 |
779.7 |
952.7 |
1,103.9 |
1,257.2 |
US new patients |
|||||||
US Zubsolv sales (new) – pre-rebates ($m) |
4.6 |
6.3 |
8.3 |
13.0 |
22.8 |
33.5 |
|
US Zubsolv sales (new) – post-rebates ($m) |
2.1 |
3.0 |
4.0 |
6.4 |
11.4 |
16.8 |
|
US Zubsolv sales (new) – post-rebates (SEKm) |
18.4 |
26.3 |
34.9 |
55.5 |
99.1 |
145.7 |
|
Total US Zubsolv sales – post-rebates (SEKm) |
481.8 |
536.6 |
667.5 |
814.6 |
1,008.2 |
1,203.0 |
1,402.9 |
Europe |
|||||||
European Zubsolv sales – pre-rebates (€m) |
1.0 |
5.2 |
10.6 |
16.2 |
22.1 |
||
European Zubsolv sales – post-rebates (€m) |
0.6 |
3.4 |
7.4 |
12.2 |
17.7 |
||
European Zubsolv sales – post-rebates (SEKm) |
6.0 |
33.0 |
72.5 |
118.9 |
172.4 |
||
Total European Zubsolv net royalty (SEKm) |
0.6 |
3.3 |
7.3 |
11.9 |
17.2 |
||
Total Zubsolv revenues – post-rebates (SEKm) |
481.8 |
536.6 |
668.1 |
817.9 |
1015.4 |
1214.9 |
1420.2 |
Total product sales (SEKm) ** |
598.2 |
674.8 |
728.3 |
858.2 |
1031.3 |
1214.9 |
1420.2 |
Source: Edison Investment Research, Orexo. Note: In the US, assumes SEK8.69/$ FX rate, peak market share of 10% (current market) and 15% (new patients) with long-term rebate of 45% (current market) and 50% (new patients). In Europe, SEK9.76/€, peak market share of 20% and average 20% rebate. **Total product sales include revenues from products other than Zubsolv until 2020.
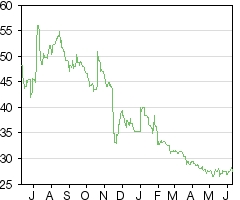
Orexo continues to trade at a significant discount to our per share valuation (current share price of SEK28.1 vs a 52-week low of SEK26) due to continued uncertainty about the generic threat, with the market pricing in limited Zubsolv prospects. Our model suggests that the current share price is supported in a scenario whereby Zubsolv does not improve its penetration from 6% overall market and 10% new patients, rebating remains high (50-55%) and it loses 80% of peak revenues in the first year post-genericisation (ie in 2020) assuming a worst case scenario of generic entry in 2019.
Exhibit 2: Scenario analysis – penetration/pricing
Scenario |
Assumptions* |
Per share valuation |
Company valuation |
|
Current market |
New patients |
(SEK) |
(SEKbn) |
|
Base case |
Rebate: 45% Penetration: 10% |
Rebate: 50% Penetration: 15% |
95 |
3.28 |
Higher rebate |
50% |
55% |
90 |
3.11 |
Lower penetration |
6% |
10% |
54 |
1.86 |
Higher rebate & lower penetration |
Rebate: 50% Penetration: 6% |
Rebate: 55% Penetration: 10% |
51 |
1.76 |
Source: Edison Investment Research. Note: *All other assumptions unchanged.
However, this scenario does not factor in a commensurate and likely significant decrease in sales costs as Orexo switches to a branded generic strategy. Additionally, it implies that Orexo loses its appeal on the ‘330 patent, is unable to defend other approved patents, and/or does not reach a settlement with Actavis. Separately, we note that Orexo has recently filed a ‘996 US IP infringement suit against Actavis in relation to its Suboxone and Subutex generics; if the court rules in Orexo’s favour, the company may be eligible for future (and backdated) royalties and potential damages.
The generic threat to Zubsolv is both direct and indirect (with earliest Suboxone Film generic entry from 2024), with the launch timing of the first lower-priced generics into the US opioid dependence market dependent on the outcome of ongoing IP infringement suits filed by Orexo (Zubsolv) and Suboxone Film (Indivior). Launch timing and continued pricing/rebating pressures are the main upside/downside risks to our forecasts; the latter factor is likely to influence ultimate Zubsolv market share which is the key determinant of upside/downside potential.
Upside scenarios for Zubsolv include greater certainty regarding the timelines for genericisation of the opioid dependence market, evidence of a growth step up/increased market share stimulated by improved market access (new contract wins with insurers) and also higher underlying market growth driven by implementation of new US legalisation to increase access to treatment.
Furthermore, we continue not to explicitly value Orexo’s R&D pipeline given limited disclosures, in particular related to development plans and timelines. Pipeline valuation upside would be unlocked by clinical progress of OX-CLI, securing partners for OX-MPI and OX-51 and defining the indication for the latter. Pipeline expansion (more detailed disclosure on Orexo’s novel formulations is anticipated later this year) and acquisition of new product(s) for commercialisation by the Zubsolv US sales infrastructure would also represent upside.
Sensitivities
Orexo is subject to various sensitivities common to speciality pharmaceutical companies, including commercialisation (pricing, reimbursement, uptake and competition), manufacturing and financing risks. Key sensitivities relate to Orexo’s main value driver, Zubsolv. The US market for opioid dependence treatment continues to evolve, and recent legislative changes are expected to steadily expand this market. Nevertheless, the pace of market share gains by Zubsolv and the long-term gross-to-net ratio will be affected by continued pricing/rebating pressures and increased competition as various players (including those with potential new generics or buprenorphine depot products) seek to maintain or win favourable commercial or public formulary status. Our model indicates that market share gains (penetration) in the next couple of years are the most important determinant of valuation - see our February Outlook report, which also contains a SWOT analysis.
Key sensitivities include the outcome of ongoing reimbursement discussions with payers, and ongoing patent litigation regarding Zubsolv and Suboxone Film, which will determine when the first lower-priced generics can enter the market. Both have a significant bearing on Zubsolv’s sales trajectory and peak sales potential in the US. We also note that Indivior has recently filed the NDA for its monthly buprenorphine depot RBP-6000 with the FDA, potential approval of which will also influence competitive dynamics.
Financials
Q117 revenues of SEK127.4m were 15.6% down on Q116 (SEK151m), although the prior period included a US$5m OX-CLI milestone from Astra Zeneca; stripping this out, revenue increased 15.6%. Zubsolv sales growth was the primary driver, with US revenue of SEK114.1m (up 15.9% on Q116: SEK98.4m). Exhibit 3 summarises the Q117 revenue breakdown and our FY17 forecasts.
Exhibit 3: Actual and forecast revenue breakdown per product (SEKm)
Actual Q117 |
Change on Q116* |
Old FY17e |
New FY17e |
Notes |
|
Zubsolv US |
114.1 |
+16% |
542.7 |
536.6 |
Tablet volumes vs Q416 affected by United Healthcare Group exiting ACA healthcare exchanges and decreased Wellcare Managed Medicaid market share (patients switching insurance companies). 6% price rise from 1 January and positive dosage mix change offset some of increased rebate. Main patent to 2032. |
Zubsolv ROW |
0.0 |
- |
0.0 |
0.0 |
No major milestones anticipated from Mundipharma in FY17. |
Abstral royalties |
8.7 |
+6% |
139.1 |
126.1 |
US generic entry (Actavis) from June 2018 (or earlier under certain undisclosed conditions), ahead of September 2019 patent expiry. Partnered with ProStrakan (Europe): 15% royalty on net sales >€42.5m; Sentynl (US): low double-digit royalty; Kyowa Hakko Kirin (Japan) single-digit royalty. |
Abstral milestones |
0.0 |
- |
- |
- |
|
Edluar royalties |
4.6 |
+28% |
11.7 |
12.0 |
Sold by Mylan (US, Canada and EU). Generic competition in N America in 2017. |
Total product revenue |
127.4 |
+16% |
693.4 |
674.8 |
|
Other revenue |
- |
- |
- |
21.7 |
$2.5m AstraZeneca milestone on OX-CLI Phase I start received in Q217 |
Total revenue |
127.4 |
-16% |
693.4 |
696.5 |
Source: Edison Investment Research, Orexo. Note: *Restated Q116 figures.
We update our model with the prevailing FX rates and tweak revenue forecasts for Abstral (lower US royalties due to slower sales ramp) and Edluar (stronger Q1 than our forecast), resulting in a lower FY17e product revenue forecast. At a total revenue level, these changes are offset by the $2.5m AstraZeneca OX-CLI milestone.
COGS increased 42% over Q116 (SEK46.2m vs SEK32.5) with SEK3.8m attributable to the Zubsolv re-packing project (now complete), and the rest of the rise largely driven by variability in indirect production costs (connected to periods in which production activity is low) with some contribution from a lower gross-to-net on account of the payer mix (higher Medicaid volumes). Gross to net levels continue to be under pressure; however, we expect increased manufacturing efficiencies and the implementation of a global supply chain to generate a further improvement in COGS. The effect of this will become more apparent from FY18 as existing inventories are consumed. For FY17, higher COGS is the key driver of our lower PBT forecast.
Operating costs for Q117 were SEK104.9m (Q116: SEK140.9m and Q416: SEK131.1m) reflecting ongoing cost management, the conclusion of Zubsolv-related R&D and lower legal spend. The ongoing impact of field force optimisation and targeting of investment into areas with favourable market access reduced sales costs to SEK48.3m (Q116: SEK60.8m and Q416: SEK66.1m). R&D investment also decreased compared with Q116 (SEK30.3m vs SEK45.0m) as the earlier period included study costs related to RESOLV and the regulatory bio-equivalence study for EU submission (the latter expense was subsequently reimbursed by Mundipharma). Admin expenses of SEK26.3m (Q116: SEK35.1m and Q416: SEK30.5m) were markedly lower following conclusion of the first round of Zubsolv patent infringement litigation vs Actavis in November. Future legal expenses (ie the appeal process and new litigation proceedings against Actavis’ Suboxone and Subutex generics) should be at a lower level, although there is less management visibility and control over these costs. Orexo has reiterated guidance of lower operating expenses of SEK500-510m for FY17; we expect total opex of SEK501m for FY17, comprising slightly higher sales expenses of SEK253.7m vs FY16, an increase in R&D spend to SEK140.1m, and lower admin costs of SEK107.4m due to the anticipated decrease in legal expenses.
Orexo delivered a Q117 operating loss of SEK23.2m with a loss before tax of SEK29.8m and EBITDA loss of SEK17.8m. For H117, EBITDA is expected to be negative due to the weighting of Abstral royalties to H2. Continued working capital improvements meant that Orexo delivered a sixth consecutive quarter of positive operating cash flow (SEK28.2m). This, coupled with the SEK59m February bond repurchase, further reduced net debt to SEK88.8m at end-March 2017, with SEK250.6m of cash and cash equivalents on balance sheet.
Exhibit 5 overleaf provides a detailed summary of our financial model, with key forecast changes presented in Exhibit 4.
Exhibit 4: Changes to estimates
Revenue (SEKm) |
PBT (SEKm) |
EPS (SEK) |
|||||||
Old |
New |
Change |
Old |
New |
Change |
Old |
New |
Change |
|
2017e |
693.4 |
696.5 |
NM |
42.3 |
29.3 |
-31% |
1.0 |
0.4 |
-60% |
2018e |
738.1 |
750.1 |
NM |
67.1 |
82.8 |
+23% |
1.6 |
1.9 |
+19% |
Source: Edison Investment Research. Note: SEK/US$ rate updated to 8.69 from 8.82; NM = not material.
Exhibit 5: Financial summary
SEK m |
2014 |
2015 |
2016 |
2017e |
2018e |
||
Year end 31 December |
IFRS |
IFRS |
IFRS |
IFRS |
IFRS |
||
PROFIT & LOSS |
|||||||
Revenue |
|
|
570.3 |
646.2 |
705.9 |
696.5 |
750.1 |
Cost of Sales |
(107.4) |
(150.2) |
(149.6) |
(145.0) |
(144.2) |
||
Gross Profit |
462.9 |
496.0 |
556.3 |
551.5 |
605.9 |
||
R&D Expenses |
(197.8) |
(172.6) |
(132.3) |
(140.1) |
(147.1) |
||
Sales Expenses |
(193.6) |
(297.5) |
(240.6) |
(253.7) |
(262.6) |
||
General and Administrative Expenses |
(113.0) |
(141.5) |
(161.6) |
(107.4) |
(110.6) |
||
EBITDA |
|
|
(12.5) |
(99.9) |
76.7 |
71.3 |
107.7 |
Operating Profit (before GW and except.) |
|
(25.0) |
(180.6) |
51.7 |
49.3 |
85.6 |
|
Intangible Amortisation |
(12.5) |
(80.7) |
(25.0) |
(20.5) |
(22.1) |
||
Other |
16.5 |
(65.0) |
29.9 |
0.5 |
0.0 |
||
Exceptionals |
0.0 |
0.0 |
0.0 |
0.0 |
0.0 |
||
Operating Profit |
(37.5) |
(261.3) |
26.7 |
28.9 |
63.5 |
||
Net Interest |
(27.6) |
(23.0) |
(16.1) |
(20.0) |
(2.9) |
||
Other |
0.0 |
0.0 |
0.0 |
0.0 |
0.0 |
||
Profit Before Tax (norm) |
|
|
(52.6) |
(203.6) |
35.6 |
29.3 |
82.8 |
Profit Before Tax (IFRS) |
|
|
(65.1) |
(284.3) |
10.6 |
8.9 |
60.7 |
Tax |
(4.0) |
(6.4) |
(6.5) |
(15.7) |
(16.6) |
||
Deferred tax |
0.0 |
0.0 |
0.0 |
0.0 |
0.0 |
||
Profit After Tax (norm) |
(56.6) |
(210.0) |
29.1 |
13.6 |
66.2 |
||
Profit After Tax (IFRS) |
(69.1) |
(290.7) |
4.1 |
(6.9) |
44.1 |
||
Average Number of Shares Outstanding (m) |
34.3 |
34.6 |
34.5 |
34.5 |
34.5 |
||
EPS - normalised (ore) |
|
|
(165) |
(607) |
84 |
39 |
192 |
EPS - IFRS (SEK) |
|
|
(1.6) |
(6.1) |
0.8 |
0.4 |
1.9 |
Dividend per share (SEK) |
0.0 |
0.0 |
0.0 |
0.0 |
0.0 |
||
Gross Margin (%) |
81.2 |
76.8 |
78.8 |
79.2 |
80.8 |
||
EBITDA Margin (%) |
(2.2) |
(15.5) |
10.9 |
10.2 |
14.4 |
||
Operating Margin (before GW and except.) (%) |
(4.4) |
(27.9) |
7.3 |
7.1 |
11.4 |
||
BALANCE SHEET |
|||||||
Fixed Assets |
|
|
289.5 |
200.3 |
185.1 |
167.1 |
146.2 |
Intangible Assets |
259.2 |
155.5 |
138.2 |
117.7 |
95.7 |
||
Tangible Assets |
29.1 |
24.7 |
22.1 |
24.5 |
25.8 |
||
Other |
1.2 |
20.1 |
24.8 |
24.8 |
24.8 |
||
Current Assets |
|
|
936.4 |
819.7 |
833.7 |
837.7 |
594.1 |
Stocks |
478.1 |
402.6 |
344.2 |
298.0 |
256.7 |
||
Debtors |
173.8 |
219.0 |
207.1 |
190.8 |
205.5 |
||
Cash |
284.5 |
198.1 |
282.4 |
348.9 |
131.9 |
||
Other |
0.0 |
0.0 |
0.0 |
0.0 |
0.0 |
||
Current Liabilities |
|
|
(268.1) |
(251.6) |
(309.5) |
(674.3) |
(339.9) |
Creditors |
(265.6) |
(251.6) |
(309.5) |
(334.9) |
(339.3) |
||
Short term borrowings |
(2.5) |
0.0 |
0.0 |
(339.4) |
(0.7) |
||
Long Term Liabilities |
|
|
(502.8) |
(498.3) |
(399.0) |
(0.8) |
(0.8) |
Long term borrowings |
(493.8) |
(494.4) |
(397.8) |
0.0 |
0.0 |
||
Other long term liabilities |
(9.0) |
(3.9) |
(1.3) |
(0.8) |
(0.8) |
||
Net Assets |
|
|
455.0 |
270.1 |
310.3 |
329.7 |
399.6 |
CASH FLOW |
|||||||
Operating Cash Flow |
|
|
(455.7) |
(84.1) |
184.5 |
150.7 |
138.0 |
Net Interest |
(31.6) |
(25.1) |
(28.3) |
(20.0) |
(2.9) |
||
Tax |
0.0 |
0.0 |
0.0 |
(3.5) |
(12.2) |
||
Capex |
(71.7) |
(4.1) |
(1.4) |
(0.9) |
(1.2) |
||
Acquisitions/disposals |
0.0 |
21.8 |
6.8 |
0.0 |
0.0 |
||
Financing |
341.7 |
3.8 |
2.2 |
0.0 |
0.0 |
||
Dividends |
0.0 |
0.0 |
0.0 |
0.0 |
0.0 |
||
Other |
0.0 |
0.0 |
0.0 |
0.0 |
0.0 |
||
Net Cash Flow |
(217.3) |
(87.7) |
163.8 |
126.2 |
121.7 |
||
Opening net debt/(cash) |
|
|
135.4 |
211.8 |
296.3 |
115.4 |
(9.5) |
HP finance leases initiated |
0.0 |
0.0 |
0.0 |
0.0 |
0.0 |
||
Exchange rate movements |
1.5 |
(2.5) |
(13.3) |
0.7 |
0.0 |
||
Other |
139.4 |
5.7 |
30.4 |
(2.1) |
0.0 |
||
Closing net debt/(cash) |
|
|
211.8 |
296.3 |
115.4 |
(9.5) |
(131.3) |
Source: Edison Investment Research, Orexo accounts. Note: FY15 figures restated at FY16 results.
|
|
Rockhopper Exploration (RKH) has announced the disposal of its Civita gas field (and a collection of other properties) to Northern Petroleum. The deal is good for RKH, as it reduces future abandonment liabilities on a number of licences in exchange for limited reduction in production cash flows (estimated gross profit of €0.7m in 2016) and a small consideration of $1.6m. It will likely reduce G&A costs going forward and allow RKH to concentrate on its three main assets in Italy (Monte Grosso, Ombrina Mare and Guendalina). The bulk of RKH’s value remains in its Sea Lion development and we hope progress is made in 2017 towards project sanction. We have adjusted our valuation for RKH to account for the deal, which reduces our NAV slightly to 72p/share.