Martin Currie Asia Unconstrained Trust
Martin Currie Asia Unconstrained Trust |
Unconstrained investment in Asian equities |
Investment trusts |
5 October 2016 |
Share price/discount performance
Three-year cumulative perf. graph
Gearing
Analysts
|
|||||||||||||||||||||||||||||||||||||||||||||||||||||||||||||||||||||||||||||||||||||
Martin Currie Asia Unconstrained Trust (MCP) was launched in 1985 and in July 2014 adopted Martin Currie’s Asia Long-Term Unconstrained (ALTU) strategy, aiming to generate returns in line with Asia-Pacific ex-Japan GDP growth, which generally has not been fully reflected in the region’s equity market returns. Since ALTU’s inception in 2008, it has demonstrated lower volatility than the market, capturing most of the upside in rising markets, while outperforming in falling markets. MCP has a wider discount than the peer group, which provides scope for it to narrow; its current dividend yield of 2.4% is attractive versus non income-mandated peers.
12 months ending |
Total share price return (%) |
Total NAV return (%) |
Blended |
MSCI AC Asia |
3Y GDP growth Asia ex-Japan (%) |
30/09/12 |
8.2 |
11.9 |
11.0 |
15.7 |
14.6 |
30/09/13 |
16.4 |
9.1 |
13.1 |
5.3 |
14.5 |
30/09/14 |
1.5 |
0.6 |
5.2 |
8.4 |
11.0 |
30/09/15 |
(9.3) |
(9.6) |
8.0 |
(6.0) |
8.0 |
30/09/16 |
32.4 |
36.1 |
6.1 |
36.6 |
6.1 |
Source: Thomson Datastream, IMF, Edison Investment Research. Note: 12-month rolling discrete total return performance, all in £ terms. *Blended benchmark is MSCI AC Asia Pacific Index (Japan fixed at 40%) until 30 June 2008, MSCI AC Asia Pacific Index from 1 July 2008 to 30 June 2011, MSCI AC Asia Pacific Index (Japan fixed at 25%) from 1 July 2011 to 10 July 2014, and three-year rolling nominal Asian GDP growth from 11 July 2014.
Investment strategy: Asia Long-Term Unconstrained
MCP adopted the ALTU strategy in July 2014, aiming to generate total returns in line with rolling three-year Asia-Pacific ex-Japan nominal GDP growth. The investment process is rigorous, involving screens, detailed fundamental analysis, a corporate governance assessment and a forensic accounting review. Stocks are only selected if the team’s assessment of the company’s intrinsic value is at a significant discount to the current share price. The resulting high-conviction portfolio typically has 20-30 positions and is held for the long term; hence portfolio turnover is relatively low.
Market outlook: Potential further upside
The Asia ex-Japan stock market has appreciated meaningfully in 2016, and its valuation discount versus the world market has narrowed from the lows experienced in 2015. However, its forward P/E multiple is still at a significant discount to developed world markets such as the US and UK. Therefore, there is potential for further re-rating given the outlook for higher economic growth in the Asia ex-Japan region; factors include positive demographics and growth in trade.
Valuation: Wider discount, above-average yield
Having widened following the result of the UK’s EU referendum, MCP’s current share price discount to cum-income NAV of 17.0% is wider than the 15.1% average of the last 12 months and is wider than the averages of the last three, five and 10 years. There is scope for the discount to narrow if positive investment performance is maintained or investor demand for Asian equities increases. MCP has a progressive dividend policy and its current yield of 2.4% ranks favourably versus its peers.
Exhibit 1: Trust at a glance
Investment objective and fund background |
Recent developments |
||||||||||||||||||||||||||||||||||||||||||||||||||||||||||||||||||||||
Martin Currie Asia Unconstrained Trust aims to achieve returns commensurate with Asia ex-Japan nominal GDP growth, unconstrained by an equity benchmark, over a long-term time horizon from a concentrated portfolio of 20-30 stocks. Before its change of investment objective in July 2014, it invested in a pan-Asian portfolio with a benchmark of MSCI AC Asia Pacific (Japan fixed at 25%). |
■ 24 May 2016: Annual report for 12 months to 31 March 2016. NAV TR -7.9%, share price TR -10.3%. ■ 12 November 2015: Half-yearly report for six months to 30 September 2015. NAV TR -19.2%, share price TR -19.7%. ■ 11 November 2015: Martin Shenfield appointed to the board as a non-executive director. |
||||||||||||||||||||||||||||||||||||||||||||||||||||||||||||||||||||||
Forthcoming |
Capital structure |
Fund details |
|||||||||||||||||||||||||||||||||||||||||||||||||||||||||||||||||||||
AGM |
July 2017 |
Ongoing charges |
FY16 1.2% (see page 7) |
Group |
Martin Currie Investment Management |
||||||||||||||||||||||||||||||||||||||||||||||||||||||||||||||||||
Interim results |
November 2016 |
Net gearing |
2.2% |
Managers |
Andrew Graham |
||||||||||||||||||||||||||||||||||||||||||||||||||||||||||||||||||
Year end |
31 March |
Annual mgmt fee |
Tiered, 0.60-0.75% of net assets |
Address |
Saltire Court, 20 Castle Terrace, Edinburgh EH1 2ES |
||||||||||||||||||||||||||||||||||||||||||||||||||||||||||||||||||
Dividend paid |
December and August |
Performance fee |
None |
||||||||||||||||||||||||||||||||||||||||||||||||||||||||||||||||||||
Launch date |
1985 |
Trust life |
Indefinite |
Phone |
0131 229 5252 |
||||||||||||||||||||||||||||||||||||||||||||||||||||||||||||||||||
Continuation vote |
Three-year, next in 2018 |
Loan facilities |
£10m (see page 7) |
Website |
|||||||||||||||||||||||||||||||||||||||||||||||||||||||||||||||||||
Dividend policy and history |
Share buyback policy and history |
||||||||||||||||||||||||||||||||||||||||||||||||||||||||||||||||||||||
MCP has a progressive dividend policy and has paid interim and final dividends since FY14.The compound annual growth in dividends since 2010 is 13.1%. |
MCP is authorised to repurchase up to 14.99% and allot up to 5% of its ordinary shares. A tender offer for 10% of the issued shares was made in July 2014. Financial years shown. |
||||||||||||||||||||||||||||||||||||||||||||||||||||||||||||||||||||||
|
|
||||||||||||||||||||||||||||||||||||||||||||||||||||||||||||||||||||||
Shareholder base (as at 20 September 2016) |
Portfolio exposure by sector (as at 31 August 2016) |
||||||||||||||||||||||||||||||||||||||||||||||||||||||||||||||||||||||
|
|
||||||||||||||||||||||||||||||||||||||||||||||||||||||||||||||||||||||
Top 10 holdings (as at 31 August 2016) |
|||||||||||||||||||||||||||||||||||||||||||||||||||||||||||||||||||||||
|
|||||||||||||||||||||||||||||||||||||||||||||||||||||||||||||||||||||||
Source: Martin Currie Asia Unconstrained Trust, Edison Investment Research, Bloomberg, Morningstar. Note: *N/A where not in August 2015 top 10.
Market outlook: Potential for further re-rating
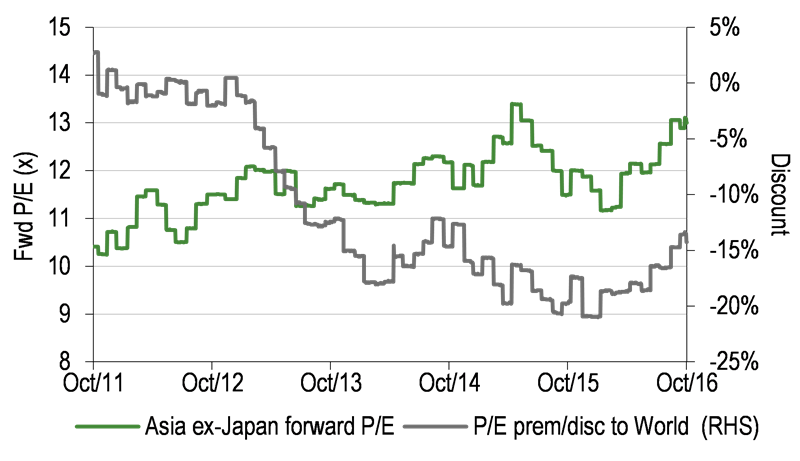
Exhibit 2 (left-hand side) shows GDP growth rates from the International Monetary Fund’s October 2016 World Economic Outlook. While forecast growth for emerging and developing Asia is lower than the 2006-15 rate; it is still appreciably higher than the forecast growth for advanced economies and the world as a whole. Factors for this include faster population growth, with a rapid expansion in the middle classes, low household debt and unemployment, and growth in trade. Although Asia ex-Japan equities have re-rated somewhat versus global equities – since January 2016 the forward P/E multiple discount to world markets has narrowed from 21% to c 14% – there is the potential for further re-rating on the back of higher relative earnings growth. Given macro uncertainties in developed markets – such as the outcome of the US election and the outlook for US interest rates, deflation in Japan, continued slow growth in Europe and the impact of Brexit on the UK economy – investors may be attracted to a fund with a well-defined investment approach investing in Asia ex-Japan equities.
|
Exhibit 2: Emerging Asia vs advanced and world markets – GDP growth and valuation metrics |
|
GDP growth rates – emerging Asia vs advanced economies and world |
DS Asia ex-Japan vs DS World valuation comparison |
|
|
|
Source: IMF WEO October 2016, Thomson Datastream, Edison Investment Research |
|
Fund profile: Rigorous fundamental analysis
MCP was launched in 1985 and, having changed its benchmark in 2008 and 2011 (see table note on page 1), adopted Martin Currie’s Asia Long-Term Unconstrained (ALTU) strategy on 11 July 2014. ALTU was launched in 2008, aiming to deliver returns that match Asia ex-Japan GDP growth (measured on a rolling three-year basis). Between 31 October 2008 and 30 June 2016, the strategy has returned 14.3% pa (net of fees and expenses). It is a high-conviction, long-only strategy that results in a concentrated portfolio of 20-30 stocks, which are held for the long term. Stocks are selected based on positive fundamentals and attractive valuations. In addition, potential investee companies’ corporate governance track records are assessed and their financial statements undergo a rigorous forensic accounting process. The portfolio is constructed without reference to an index and is diversified by sector and geography. A maximum 10% of the portfolio may be held in a single stock and a maximum 10% may be held in any one company; currency exposure is not hedged. MCP is managed by Andrew Graham and Martin Currie’s Asia investment team.
The fund managers: Andrew Graham and team
The manager’s view: On balance, conditions are improving
Manager Andrew Graham comments that over the last several months, since end-May 2016, business conditions globally, as well as in Asia, have improved; not universally, but the positives outweigh the negatives. This has been evidenced in forward-looking indicators such as purchasing managers’ new orders and export diffusion indices, while not very robust, are positive rather than negative. Inventories of finished goods and inventory-to-shipment ratios remain relatively elevated in most areas, but there is some destocking, which is evidence of a better environment; if new orders remain positive, it will lead to a more meaningful improvement in inventory data. The manager suggests that the economic environment is “a bit better”, but not more vibrant than this. This improving data is primarily to do with the manufacturing sector, which is a small part of many economies, but a good indicator of broader economic growth.
Considering messages from recent company meetings and Q216 earnings reports, the manager comments that, in general, operations that are performing well are getting stronger and those that have been problematic are showing signs of improvement, such as Siam Commercial Bank. Investors were concerned about the Thai economy and rising non-performing loans, which had increased during 2015. The manager thought that this was not a systemic problem and that by mid-2016 there should be signs of improvement. This view has been borne out by recent comments from the bank’s management; the stock has reacted positively and is now one of the best performing stocks in the MCP portfolio year-to-date.
Graham notes that earnings forecasts in the region have increased; the estimate revision ratio has been rising for most of 2016, from a very low base, having been negative in the last few years. The strongest revisions have primarily been in more cyclical parts of the market such as materials. Regionally, the strongest revisions have generally been in North Asia – China, Taiwan and Korea – and weakest in the ASEAN region. The manager suggests that because revisions tend to run ahead of hard data, the revision ratio may be close to a peak, but the earnings picture is certainly more positive.
Commenting on valuation, Graham notes that the Asia ex-Japan stock market has experienced quite a strong upward move and valuations have risen from a relatively low base. The MSCI AC Asia ex-Japan Index is trading at 13.5x 12-month forward earnings, which is one standard deviation above the five-year average, but roughly in line with the 10-year average. Given it is a size rather than a price-weighted index, the multiple does not fully reflect the outperformance and higher valuations of smaller-cap companies; on an equally weighted basis, the market multiple is more like 16.5x. The stock market is no longer very cheap versus history and earnings need to come through to support current valuations. However, it is also important to consider the valuation of Asian markets versus the rest of the world, as this paints quite a different picture. Asia ex-Japan stocks have de-rated meaningfully over the last five years relative to European and US stocks. This trend ceased in Q116, although the 12-month forward P/E multiple for Asian ex-Japan stocks is still 10-15% cheaper than Europe and 20-25% cheaper than the US. Looking back over the last 20 years, this is very low relative to history.
Asset allocation
Investment process: Asia Long-Term Unconstrained (ALTU)
The ALTU strategy involves an initial screen of c 1,100 Asian equities, looking for companies with stable returns above the cost of capital, which are generating positive cash flow. The resulting investable universe of c 200 companies undergoes an in-depth evaluation of their competitive positions and sustainable growth. Potential investee companies’ corporate governance records are reviewed and their financial statements are investigated, which leads to the generation of a 40-60 page comprehensive ‘accounting diagnostics report’. Long-term growth and cash returns are modelled and the assessed intrinsic value of a company is compared to the current share price. There are also regular reviews of existing portfolio holdings; the manager looks at a broad range of upside and downside outcomes and the assessment of these drives portfolio activity.
Current portfolio positioning
At end-August 2016, the top 10 holdings accounted for 56.7% of the portfolio – an increase in concentration versus 52.5% at end-August 2015. Seven names were common to both periods.
Changes in geographic or sector exposure over the last 12 months have occurred as a result of individual stock decisions. The manager has been taking profits in Indian companies Hero MotoCorp and Maruti Suzuki. Both companies have done well on the back of improving orders as a result of the launch of new models and a gradual increase in demand in India. Two positions have been sold completely. M1 is a Singaporean telecoms company. The manager took profits some time ago and had been progressively trimming. He is concerned about an increasingly competitive business environment; a fourth player may enter the market, which could be disruptive. However, if this company is ultimately unsuccessful, M1 could be repurchased at some time in the future. Tsingtao Brewery was sold on valuation grounds and as a result of a tougher competitive environment, given aggressive expansion into China by Anheuser-Busch InBev, which has negatively affected Tsingtao’s earnings.
In May 2016, Chinese technology company Tencent was added to the portfolio; the stock has been held in the past. Martin Currie has run forensic reports on the company for the last few years, but needed clarification regarding the structure of the business and the relationships between the listed and operating companies. The additional clarity was received after a long process of engagement with Tencent’s management. The Martin Currie team have been working for some time on analysing Tencent’s long-term prospects in gaming (PC/mobile games) and broader internet service (its ecosystem). It needed to ascertain what the current share price was implying about the value of these businesses and if a potential investment looked interesting from a risk/reward perspective. Analysis concluded that Tencent’s position in online games was strong and growing, the communication platform was strengthening, and cross-selling was increasing. The manager felt that a lot of investment had already been made to build out the ecosystem, which should lead to a stabilisation in margins going forward now there is better diversification of the revenue stream. Tencent is gradually rolling out advertising, but not so fast that it destroys the user experience; the manager suggests that it is “not grabbing for gold”, but acting in a measured way that will enhance the sustainability of growth. At the time of purchase, Tencent’s valuation was lower than history and Martin Currie’s own intrinsic valuation; it was viewed as having an attractive risk/reward profile. The manager purchased a large 5% position based on high conviction when the stock price was in the low HK$150s (it is now higher than HK$210).
|
Exhibit 3: Geographical exposure at 31 August 2016 |
Exhibit 4: Portfolio characteristics |
||||||||||||||||||||||||
|
|
||||||||||||||||||||||||
|
Source: Martin Currie Asia Unconstrained Trust, Edison Investment Research |
Source: Martin Currie and UBS PAS, 31 August 2016. Note: *Indicates consensus. |
|
Exhibit 3: Geographical exposure at 31 August 2016 |
||||||||||||||||||||||||
|
||||||||||||||||||||||||
|
Source: Martin Currie Asia Unconstrained Trust, Edison Investment Research |
||||||||||||||||||||||||
|
Exhibit 4: Portfolio characteristics |
||||||||||||||||||||||||
|
||||||||||||||||||||||||
|
Source: Martin Currie and UBS PAS, 31 August 2016. Note: *Indicates consensus. |
Looking at the portfolio characteristics in Exhibit 4, compared to our last note published in February 2016, the valuation metrics of the portfolio are broadly similar versus the MSCI AC Asia ex-Japan Index. There is a wider disparity between the price/earnings ratios; contributing to this is the purchase of Tencent, which has a relatively higher earnings multiple. Also, MCP’s portfolio now has a higher rather than a lower dividend yield than the index. Indicative of the quality nature of holdings in the portfolio, companies in aggregate hold net cash rather than net debt on their balance sheets.
Performance: Outperformance since change in strategy
MCP adopted the ALTU strategy in July 2014. As shown in Exhibit 5, this strategy has generated lower annual volatility versus the market. Between October 2008 and August 2016, annual volatility in the ALTU strategy has been 4.8pp lower than the MSCI AC Asia ex-Japan Index. Its average return in months when the market rallied was 1.3pp lower (73% of the upside), but in months when the market fell was 1.4pp higher (56% of the downside). Exhibit 6 shows MCP’s absolute share price and NAV total returns versus the benchmark’s. Over one year, returns have been particularly strong; MCP’s share price total return of 32.4% and NAV total return of 36.1% are considerably ahead of the GDP-based benchmark return of 6.1%. In recent months the relative outperformance has been magnified by sterling weakness following the UK’s decision to leave the European Union.
|
Exhibit 5: ALTU NAV volatility and upside/downside participation to 31 August 2016 |
Exhibit 6: Price, NAV and blended benchmark total return performance (%) |
|
|
|
Source: Martin Currie Asia Unconstrained Trust. Note: ALTU strategy inception date is 31 October 2008. |
Source: Thomson Datastream, Martin Currie Asia Unconstrained Trust. Note: Three- and five-year and since change of strategy (SC) performance is annualised. |
|
Exhibit 5: ALTU NAV volatility and upside/downside participation to 31 August 2016 |
|
|
Source: Martin Currie Asia Unconstrained Trust. Note: ALTU strategy inception date is 31 October 2008. |
|
Exhibit 6: Price, NAV and blended benchmark total return performance (%) |
|
|
Source: Thomson Datastream, Martin Currie Asia Unconstrained Trust. Note: Three- and five-year and since change of strategy (SC) performance is annualised. |
Looking at relative returns in Exhibit 7, MCP has outperformed its blended benchmark since the change to the ALTU strategy in July 2014 and has also outperformed over shorter time periods. Given the change in strategy, its relative performance over three and five years is of less relevance.
Exhibit 7: Share price and NAV total return performance, relative to index (%)
|
One month |
Three months |
Six months |
One year |
SC |
Three years |
Five years |
Price relative to blended benchmark |
0.8 |
13.6 |
15.3 |
24.8 |
7.2 |
1.0 |
1.4 |
NAV relative to blended benchmark |
0.9 |
10.8 |
16.2 |
28.3 |
10.0 |
2.6 |
(0.2) |
Price relative to MSCI AC Asia ex-Japan |
(1.2) |
1.5 |
(3.4) |
(3.1) |
(4.8) |
(12.5) |
(9.5) |
NAV relative to MSCI AC Asia ex-Japan |
(1.1) |
(1.0) |
(2.6) |
(0.4) |
(2.2) |
(11.2) |
(11.0) |
Price relative to MSCI World |
(0.2) |
6.6 |
0.8 |
1.3 |
(9.5) |
(18.9) |
(28.2) |
NAV relative to MSCI World |
(0.0) |
4.0 |
1.6 |
4.2 |
(7.1) |
(17.7) |
(29.4) |
Source: Thomson Datastream, Edison Investment Research. Note: Data to end-August 2016. Geometric calculation. SC = since change of investment objective on 11 July 2014.
Discount: Back in range since post-Brexit dip
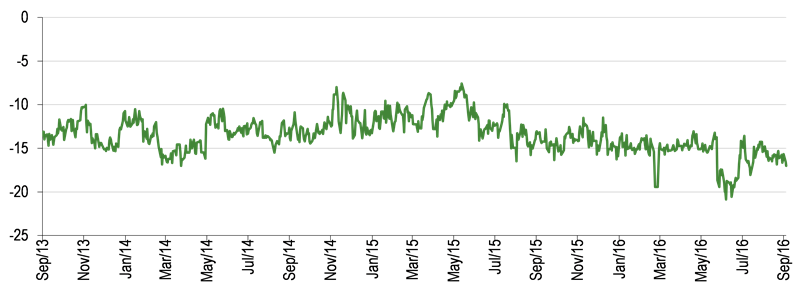
As shown in Exhibit 8, MCP’s share price discount to cum-income NAV widened following the result of the UK’s EU referendum, reaching a trough at 20.9% on 7 July 2016. The discount has narrowed to 17.0%, which is modestly wider than the 15.1% average of the last 12 months. It is also wider than the averages of the last three, five and 10 years of 13.5%, 14.5% and 15.1%, respectively. There is scope for the discount to narrow if MCP maintains its positive performance track record since adopting the ALTU strategy, or if there is higher investor demand for Asia ex-Japan equities.
|
Exhibit 8: Share price discount to NAV (including income) over three years (%) |
|
|
Source: Thomson Datastream, Edison Investment Research |
Capital structure and fees
MCP is a conventional investment trust with one class of share in issue; there are currently 36.1m ordinary shares outstanding, with a further 3.4m held in treasury. It has a £10m loan facility with the Royal Bank of Scotland, which expires on 31 August 2018; at 31 March 2016 (end of FY16), £5.1m was drawn down. The balance can be drawn down and invested at the discretion of the manager; gearing was increased to allow the purchase of the holding in Tencent, but has since been repaid following asset sales. At end-August 2016, gross gearing was 4.1%, or 2.2% net of cash.
A new fee structure was introduced in 2014. Martin Currie is paid a management fee, calculated quarterly at 0.75% pa of net assets up to £150m and 0.60% pa of net assets above £150m; there is no performance fee. For FY16, ongoing charges were 1.2%, which was in line with the prior year. Following the change to the ALTU strategy, the continuation vote is now every three rather than every five years; the next vote is due in 2018.
Dividend policy and record
Following the change to the ALTU strategy in July 2014, focusing on growth rather than income, shareholders were advised not to expect the level of dividend growth generated in prior years. The annual dividend was held steady in FY15 at 7.50p but increased by 3.3% to 7.75p in FY16 (since 2010 the compound annual growth in dividends is 13.1%). Based on the current share price the dividend yield is 2.4%; while not high in absolute terms, MCP’s yield compares favourably with both the low level of interest rates available and peer group yields.
Peer group comparison
Exhibit 9 shows trusts in the AIC Asia Pacific ex-Japan sector with track records longer than 10 years; MCP has a far more concentrated portfolio than all of the peers. Its NAV total returns have lagged the peer-group average over the periods shown, albeit only modestly over one year. In terms of risk-adjusted returns as measured by the Sharpe ratio, MCP’s are below average over one and three years. Most trusts in the sector are trading at a discount to NAV; MCP’s is currently the widest. This may be because it is the smallest trust in the group, or that investors are waiting until MCP has a longer performance track record following the July 2014 change to the ALTU strategy. Its gearing and ongoing charges are broadly in line with the peer-group average; no performance fee is payable. When the three trusts with an income mandate are excluded, MCP’s dividend yield of 2.4% is higher than the remainder of the peers; it is double the level of the remaining peer-group average.
Exhibit 9: Asia Pacific ex-Japan peer group (as at 4 October 2016)
% unless stated |
Market cap £m |
NAV TR 1 Year |
NAV TR 3 Year |
NAV TR 5 Year |
NAV TR 10 Year |
Sharpe 1y (NAV) |
Sharpe 3y (NAV) |
Discount (ex-par) |
Ongoing charge |
Perf. fee |
Net gearing |
Dividend yield (%) |
Martin Currie Asia Unconstrained |
118.6 |
39.2 |
26.5 |
63.3 |
99.2 |
1.1 |
0.0 |
(17.0) |
1.2 |
No |
102 |
2.4 |
Aberdeen Asian Income |
378.5 |
39.0 |
19.4 |
76.9 |
230.8 |
1.2 |
(0.2) |
(5.1) |
1.3 |
No |
109 |
4.2 |
Aberdeen Asian Smaller |
341.4 |
42.2 |
25.5 |
105.1 |
345.1 |
2.1 |
(0.1) |
(13.5) |
1.5 |
No |
107 |
1.1 |
Aberdeen New Dawn |
224.7 |
36.7 |
22.8 |
62.0 |
172.1 |
0.9 |
(0.1) |
(14.4) |
1.1 |
No |
110 |
2.1 |
Edinburgh Dragon |
583.0 |
39.7 |
27.5 |
69.4 |
190.4 |
1.2 |
0.1 |
(13.6) |
1.2 |
No |
107 |
1.0 |
Fidelity Asian Values |
226.9 |
53.7 |
61.8 |
120.4 |
254.5 |
2.4 |
0.8 |
(9.9) |
1.4 |
No |
101 |
0.6 |
Henderson Far East Income |
399.8 |
39.0 |
30.5 |
90.2 |
175.0 |
1.2 |
0.1 |
1.3 |
1.1 |
No |
104 |
5.7 |
Invesco Asia |
197.4 |
46.1 |
57.0 |
105.1 |
248.0 |
1.4 |
0.6 |
(11.5) |
1.0 |
No |
100 |
1.6 |
JPMorgan Asian |
267.1 |
43.9 |
46.4 |
90.2 |
144.6 |
1.3 |
0.4 |
(14.4) |
0.8 |
No |
105 |
0.9 |
Pacific Assets |
282.2 |
35.1 |
58.3 |
126.2 |
210.8 |
1.2 |
0.9 |
(3.7) |
1.3 |
No |
100 |
0.9 |
Pacific Horizon |
123.7 |
38.2 |
41.7 |
81.5 |
144.7 |
1.1 |
0.4 |
(13.9) |
1.0 |
No |
103 |
0.2 |
Schroder Asia Pacific |
587.3 |
44.1 |
52.8 |
113.8 |
230.3 |
1.4 |
0.6 |
(12.6) |
1.1 |
No |
100 |
1.2 |
Schroder Asian TR Inv. Co. |
186.0 |
41.0 |
52.9 |
98.8 |
174.9 |
1.7 |
0.7 |
(6.8) |
1.0 |
Yes |
108 |
1.5 |
Schroder Oriental Income |
563.5 |
42.1 |
45.1 |
118.1 |
262.8 |
1.4 |
0.5 |
1.8 |
0.9 |
Yes |
101 |
3.4 |
Scottish Oriental Smaller Cos |
284.1 |
37.1 |
41.1 |
118.1 |
386.6 |
1.3 |
0.4 |
(15.8) |
1.0 |
Yes |
92 |
1.3 |
Average |
317.6 |
41.1 |
40.6 |
95.9 |
218.0 |
1.4 |
0.3 |
(9.9) |
1.1 |
103 |
1.9 |
|
Trust rank in sector |
15 |
9 |
12 |
14 |
15 |
13 |
12 |
15 |
5 |
9 |
4 |
Source: Morningstar, Edison Investment Research. Note: TR=total return. Sharpe ratio is a measure of risk-adjusted return. The ratios shown are calculated by Morningstar for the past 12- and 36-month periods by dividing a fund’s annualised excess returns over the risk-free rate by its annualised standard deviation. Net gearing is total assets less cash and equivalents as a percentage of net assets.
The board
There are five members on the board of MCP; all are non-executive and independent of the manager. Chairman Harry Wells was appointed in 2003 and took on his current role in July 2014. Gregory Shenkman is the senior independent director; he was appointed in 2007. The other three board members and their years of appointment are Peter Edwards (2007), Anja Balfour (2012) and Martin Shenfield (2015). The board members have backgrounds in investment, finance and law.
|
|
Martin Currie Asia Unconstrained Trust