Last close As at 05/08/2026
AUD0.33
▲ 0.01 (1.54%)
Market capitalisation
AUD127m
Research: TMT
EML Payments reported good growth in revenue and underlying EBITDA in H124, mainly due to the benefit of higher interest income. Management’s focus has been on the underperforming PCSIL General Purpose Reloadable (GPR) business, now in liquidation, resulting in the cost cutting programme shifting to H224. With that obstacle removed, management can now shift its sights to growing the remaining Gifting and GPR businesses and rightsizing the cost base.
EML Payments |
Looking to a brighter future |
H124 results |
Software and comp services |
5 March 2024 |
Share price performance
Business description
Next events
Analyst
EML Payments is a research client of Edison Investment Research Limited |
|||||||||||||||||||||||||||||||||||||||||||||
EML Payments reported good growth in revenue and underlying EBITDA in H124, mainly due to the benefit of higher interest income. Management’s focus has been on the underperforming PCSIL General Purpose Reloadable (GPR) business, now in liquidation, resulting in the cost cutting programme shifting to H224. With that obstacle removed, management can now shift its sights to growing the remaining Gifting and GPR businesses and rightsizing the cost base.
Year end |
Revenue |
PBT* |
NPATA** (A$m) |
Diluted EPS* (c) |
DPS |
P/E |
EV/EBITDA*** |
06/22 |
232.4 |
16.0 |
19.3 |
3.4 |
0 |
27.8 |
7.3 |
06/23 |
254.2 |
(22.8) |
(27.0) |
(4.9) |
0 |
N/A |
10.1 |
06/24e |
262.1 |
27.5 |
26.6 |
5.7 |
0 |
16.5 |
6.7 |
06/25e |
238.0 |
39.8 |
31.8 |
8.3 |
0 |
11.4 |
6.0 |
Note: *PBT and EPS are normalised, excluding amortisation of acquired intangibles, exceptional items and share-based payments. **NPATA, net profit after tax, excluding acquisition-related costs. ***Based on underlying EBITDA.
Interest income boosts revenue and profitability
EML reported strong revenue growth in H124 (+30% y-o-y) as it benefited from higher interest rates on float. Interest income nearly quadrupled year-on-year to make up 23% of revenue. Gifting revenue increased 15% y-o-y, GPR 38% and Digital Payments 17%. Underlying EBITDA increased 119% y-o-y to A$29.3m (19.5% margin), mainly due to the higher interest income contribution. Underlying overheads increased year-on-year, reflecting investment in multiple areas of the business but management is focused on reducing costs in H224 and FY25. The group generated cash of A$7.3m in H124 to end the period with net debt excluding leases of A$13.7m.
Making good progress with strategic review
With PFS Card Services Ireland Limited (PCSIL) now in liquidation, management is focused on separating PFS Limited (UK) from PCSIL and working with the UK regulator to remove the growth cap. There has been interest from potential bidders for Sentenial and management is working through this process. For the remaining business, management is focused on building the sales pipeline, retaining staff and investing in technology to drive growth and profitability. We have revised our forecasts to reflect the H124 performance. Our underlying EBITDA forecast for FY24 increases by 2.2% to A$55.7m and for FY25 by 4.7% to A$62.5m.
Valuation: Operational performance now the key
Since the liquidation announcement on 17 January the stock has gained 26% but continues to trade at a material discount to global payment processor and prepaid card peers on an EV/sales and EV/underlying EBITDA basis. Evidence of positive progress with the UK regulator and growth in the remaining business will be key to reducing this discount, with the potential sale of Sentenial another possible trigger for upside.
Review of H124 results
Exhibit 1 summarises EML Payment’s performance in H124. Revenue increased 30% y-o-y and gross profit 58%, mainly due to the benefit of higher interest rates on float (group interest income was A$34.7m in H124 versus A$9.0m in H123). Underlying EBITDA increased 119% y-o-y to a profit of A$29.3m before one-off costs of A$1.2m for remediation and litigation and A$2.6m for restructuring. The company also took a A$9.3m impairment for PCSIL intangible assets (part of the A$25m in expected write-downs for FY24) and recognised a A$1.7m fair value gain on the contingent consideration for Sentenial. Net debt (excluding leases) at the end of H124 was A$13.7m, compared to A$20.4m at the end of FY23. The company generated cash of A$7.3m in H124, with A$20.8m of underlying operating cashflow offset by regulatory remediation and litigation payments of A$7.0m, capex of A$5.6m and lease payments of A$1.0m
Exhibit 1: H124 results highlights
A$m |
H124 |
H123 |
y-o-y |
Group revenue |
150.7 |
116.2 |
30% |
Gross profit |
110.8 |
70.0 |
58% |
Gross margin |
73.5% |
60.2% |
13.3pp |
Underlying gross profit |
110.8 |
78.9 |
40% |
Underlying gross margin |
73.5% |
67.9% |
5.6pp |
EBITDA |
25.5 |
(8.7) |
394% |
Underlying EBITDA |
29.3 |
13.4 |
119% |
Underlying EBITDA margin |
19.5% |
11.5% |
8.0pp |
Net debt |
13.7 |
6.8 |
101% |
Source: EML Payments
In January, the company extended the terms of the debt facility that was taken out to acquire Sentential. It was due to be repaid on 28 September 2024, but this has been extended to 31 March 2025. At the end of H124, A$48.8m was drawn on the facility with A$195m undrawn (A$145m acquisition facility and A$50m working capital facility). Also in January, the acquisition facility was cancelled as it is no longer required and the undrawn working capital facility was reduced to A$20m.
Divisional performance
The table below summarises the gross debit volume (GDV), revenue and gross profit of each division.
Exhibit 2: Half-yearly divisional performance
H124 |
H123 |
y-o-y |
H124 |
H123 |
y-o-y |
|||
GDV (A$bn) |
Gross profit (A$m) |
|||||||
Gifting |
1.17 |
1.06 |
10.6% |
Gifting |
30.4 |
27.2 |
12% |
|
GPR |
6.44 |
6.54 |
-1.6% |
GPR* |
70.2 |
42.6 |
65% |
|
Digital Payments |
67.78 |
41.79 |
62.2% |
Digital Payments* |
10.1 |
9.1 |
11% |
|
Group GDV |
75.39 |
49.39 |
52.6% |
Group |
110.8 |
78.9 |
41% |
|
Yield (bp) |
||||||||
Gifting |
334 |
321 |
13bp |
Gross margin |
||||
GPR |
154 |
110 |
44bp |
Gifting |
77.9% |
80.1% |
-2.2pp |
|
Digital Payments |
2 |
3 |
-1bp |
GPR* |
70.8% |
59.4% |
11.4pp |
|
Group yield |
20 |
24 |
-4bp |
Digital Payments* |
81.5% |
86.7% |
-5.2pp |
|
Revenue (A$m) |
Group |
73.5% |
67.9% |
5.6pp |
||||
Gifting |
39.1 |
34.0 |
15.1% |
|||||
GPR |
99.2 |
71.7 |
38.4% |
|||||
Digital Payments |
12.4 |
10.5 |
17.4% |
|||||
Group |
150.7 |
116.2 |
29.7% |
|||||
Source: EML Payments. Note: *Underlying gross profit excludes one-off fraud costs of A$2.4m (GPR) and A$6.1m (Digital Payments).
Gifting: Incentives growth outpaces malls
Gifting GDV increased 10.6% y-o-y, with strong growth in incentives partially offset by weaker demand from US malls. This translated to revenue growth of 15% y-o-y. Corporate incentive revenue increased 37% y-o-y, while North American mall revenue declined 4% y-o-y. The yield increased due to a higher contribution from interest income: A$3.1m in H124 versus A$1.1m in H123.
GPR: Growth excluding PCSIL
The GPR division reported a 2% decline in GDV stemming from the deterioration of the PCSIL business. Excluding this, GDV was modestly up despite growth restrictions for PFSL (UK). Salary packaging in Australia saw good demand with active benefit accounts increasing 12% y-o-y. Interest income increased significantly, from A$7.5m in H123 to A$31.0m in H124 (of which A$12.7m was from PCSIL), driving the step up in gross margin.
The company provided data on PCSIL’s performance during the period (Exhibit 3). Stripping this out, the remaining GPR business revenue of A$55.8m was up 43% y-o-y and gross profit was up 47% y-o-y (margin 73.8%).
Exhibit 3: PCSIL performance H124 versus H123
A$m |
H124 |
H123 |
Revenue |
43.4 |
32.6 |
Gross profit |
29.0 |
11.7 |
Gross margin |
67% |
36% |
Underlying overheads |
(20.5) |
(16.1) |
Underlying EBITDA |
8.5 |
(2.1) |
Net profit after tax (NPAT) |
2 |
(6.5) |
Cash burn |
(3.2) |
(12.2) |
Source: EML Payments
As a reminder, the PCSIL business is being wound down and will not be included in the GPR division from H224 onwards.
In the UK, the PFSL (UK) business has undergone a third-party review for the Financial Conduct Authority (FCA). The company will work with the FCA to seek the removal of the growth cap (this currently means that the business cannot sign up new customers).
Digital Payments: Sentenial 60% of revenue
GDV growth of 62% y-o-y was driven by Sentenial direct debit and open banking volumes, which increased by A$24.6bn y-o-y (+67%). Excluding Sentenial, digital payment volumes increased A$1.3bn or 26% y-o-y. Sentenial contributed A$7.5m of revenue, 60% of the total and up 34% y-o-y. The remaining business saw a 2% revenue decline to A$4.9m. Interest income makes up a much smaller proportion of revenue (4.7% in H124 versus 3.0% in H123).
The company is engaged in selling the Sentenial business. The deal will be subject to regulatory approval so is likely to take longer to complete than a non-regulated business.
Focus for H224
Management highlighted the four areas of focus for H224:
■
Remediation and separation: work with the FCA to lift the growth cap on PFSL (UK) and finalise the separation of PFSL (UK) from PCSIL.
■
Cost optimisation: cut costs in H2 and accelerate structural efficiency initiatives leading into FY25. See below for more detail.
■
Growth: building the sales pipeline for FY25; simplifying sales processes.
■
Strategic review: this includes the focus on selling Sentenial as well as strategic planning for the core business.
Outlook and changes to forecasts
Management maintained guidance for FY24 underlying EBITDA in the range of A$52–58m (+40–56% y-o-y).
Underlying overheads to reduce from H224
Underlying overheads in H124 totalled A$81.6m, up from A$72.1m in H223 and A$66m in H123. Cost increases on a year-on-year basis reflect investments in the leadership team, the ongoing strategic review, investment to strengthen risk and compliance, employee incentives for talent retention, one-off professional fees to stabilise and improve key operational areas and increased technology spend on new risk and compliance software and additional cloud-related costs. Management noted that the cost optimisation programme is behind schedule due to the focus on the PCSIL winddown and the ongoing strategic review. The company expects that underlying overheads excluding PCSIL will reduce by 5–10% h-o-h in H224 (ie to A$55.0–58.0m) as cost reduction activities accelerate. Further cost savings are expected in FY25, with net headcount expected to reduce by c 10% by year-end, less need for external professional services and a rationalisation of the ICT cost base.
Margin expansion for continuing operations
Our forecasts currently include PCSIL for H124 and exclude it from H224. We expect the company to report PCSIL as a discontinued operation for FY24, but do not have enough information to strip it out of our FY24 forecasts and FY23 actuals. We provide a pro forma table below that shows elements of our forecasts for FY24 and FY25 excluding PCSIL. The company expects costs for continuing operations to reduce by A$10–15m in FY25 versus FY24 and for continuing operations underlying EBITDA margins to increase by c 4–5% per annum for FY23–26. This assumes customer revenue growth of 5–8% per annum and interest yields moderating in the longer term (see below).
Exhibit 4: Pro forma metrics for FY24 and FY25
A$m |
Published forecasts |
Excluding PCSIL |
|||
FY23 |
FY24e |
FY25e |
FY24e |
FY25e |
|
Revenue |
254.2 |
262.1 |
238.0 |
218.7 |
238.0 |
Gross profit |
165.1 |
195.2 |
173.9 |
166.2 |
173.9 |
EBITDA |
-2.6 |
49.7 |
62.5 |
62.5 |
|
One-offs |
39.7 |
6.0 |
0.0 |
0.0 |
|
Underlying EBITDA |
37.1 |
55.7 |
62.5 |
47.2 |
62.5 |
Underlying EBITDA margin |
14.6% |
21.3% |
26.3% |
21.6% |
26.3% |
Source: Edison Investment Research
Interest income contributing a growing share of revenue
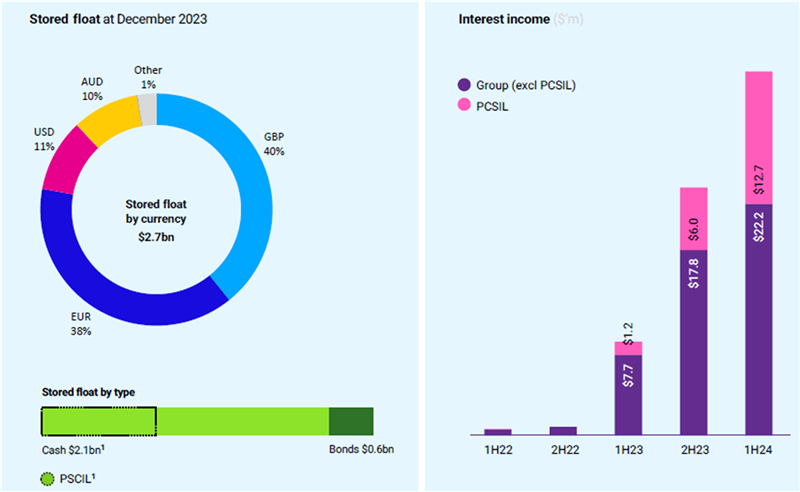
Interest income made up 23.0% of H124 revenue, up from 7.7% in H123 and 16.5% in H223, with an annualised yield of 2.54% compared to 1.27% for FY23. PCSIL contributed just over a third of interest income in H124 with the next largest contributor being PFSL (UK). The chart below shows the breakdown of stored float at the end of H124 and the progression of interest income since H122. Central bank rates continued to move up during H124, but have now been stable for several months, so H224 should see the full benefit of the higher rates.
Exhibit 5: Stored float and interest income
|
Source: EML Payments. Note: 1: A$0.8bn of A$2.1bn cash in the stored float is held by PCSIL.
The company has undertaken optimisation activities to improve earned yields and expects interest yields to moderate in the longer term by 50–75bp from current levels (taking into account improvements in the yield from optimisation activities).
Changes to forecasts
We have revised our forecasts to reflect the H124 performance. We have reduced the final payout of contingent consideration for Sentenial from A$7.0m to A$5.3m. We have removed the portion of float related to PCSIL. Our underlying EBITDA for FY24 increases by 2.2% to A$55.7m, in the middle of the guidance range.
Exhibit 6: Changes to forecasts
FY24e |
FY24e |
FY25e |
FY25e |
||||||
Old |
New |
Change |
y-o-y |
Old |
New |
Change |
y-o-y |
||
Revenues |
A$m |
251.0 |
262.1 |
4.4% |
3.1% |
242.9 |
238.0 |
-2.0% |
-9.2% |
Gross profit |
A$m |
176.2 |
195.2 |
10.8% |
18.3% |
172.9 |
173.9 |
0.6% |
-10.9% |
Gross margin |
70.2% |
74.5% |
4.3% |
9.6% |
71.2% |
73.1% |
1.9% |
-1.4% |
|
Underlying gross profit |
A$m |
176.2 |
195.2 |
10.8% |
12.0% |
172.9 |
173.9 |
0.6% |
-10.9% |
Underlying gross margin |
70.2% |
74.5% |
4.3% |
6.0% |
71.2% |
73.1% |
1.9% |
-1.4% |
|
EBITDA |
A$m |
46.5 |
49.7 |
6.9% |
-2016.3% |
59.7 |
62.5 |
4.7% |
25.7% |
EBITDA margin |
18.5% |
19.0% |
0.5% |
20.0% |
24.6% |
26.3% |
1.7% |
7.3% |
|
Add back one-off costs |
A$m |
8.0 |
6.0 |
N/A |
N/A |
0.0 |
0.0 |
N/A |
N/A |
Underlying EBITDA |
A$m |
54.5 |
55.7 |
2.2% |
50.3% |
59.7 |
62.5 |
4.7% |
12.2% |
Underlying EBITDA margin |
21.7% |
21.3% |
-0.4% |
6.7% |
24.6% |
26.3% |
1.7% |
5.0% |
|
Normalised operating profit |
A$m |
28.7 |
32.5 |
13.3% |
-269.7% |
40.9 |
44.8 |
9.6% |
37.7% |
Normalised operating margin |
11.4% |
12.4% |
1.0% |
20.0% |
16.8% |
18.8% |
2.0% |
6.4% |
|
Reported operating profit |
A$m |
(15.8) |
(8.3) |
-47.8% |
-97.3% |
21.4 |
32.3 |
51.1% |
-491.5% |
Reported operating margin |
-6.3% |
-3.1% |
3.1% |
115.7% |
8.8% |
13.6% |
4.8% |
16.7% |
|
Normalised PBT |
A$m |
25.1 |
27.5 |
9.6% |
-221.0% |
37.3 |
39.8 |
6.7% |
44.6% |
Reported PBT |
A$m |
(19.4) |
(11.5) |
-40.7% |
-95.9% |
17.8 |
27.3 |
53.4% |
-337.5% |
Normalised net income |
A$m |
20.1 |
22.0 |
9.6% |
-221.0% |
29.8 |
31.8 |
6.7% |
44.6% |
NPATA |
A$m |
26.5 |
26.6 |
0.3% |
-198.6% |
31.2 |
31.8 |
1.9% |
19.8% |
Add back one-off costs |
A$m |
6.4 |
4.8 |
0.0 |
0.0 |
||||
Underlying NPATA |
A$m |
32.9 |
31.4 |
-4.6% |
541.1% |
31.2 |
31.8 |
1.9% |
1.5% |
Reported net income |
A$m |
(15.5) |
(9.2) |
-40.7% |
-96.8% |
14.2 |
21.8 |
53.4% |
-337.5% |
Normalised basic EPS |
A$ |
0.05 |
0.06 |
9.6% |
-220.9% |
0.08 |
0.09 |
6.7% |
44.5% |
Normalised diluted EPS |
A$ |
0.05 |
0.06 |
9.6% |
-217.8% |
0.08 |
0.08 |
6.7% |
44.5% |
Reported basic EPS |
A$ |
(0.04) |
(0.02) |
-40.7% |
-96.8% |
0.04 |
0.06 |
53.4% |
-337.3% |
NPATA/share |
A$ |
0.07 |
0.07 |
0.3% |
-198.5% |
0.08 |
0.08 |
1.9% |
19.7% |
Dividend per share |
A$ |
0.00 |
0.00 |
N/A |
N/A |
0.00 |
0.00 |
N/A |
N/A |
Net debt/(cash) |
A$m |
28.1 |
22.6 |
-19.6% |
10.9% |
0.8 |
(3.8) |
-606.1% |
-116.8% |
GDV |
A$bn |
164.8 |
154.3 |
-6.4% |
19.1% |
174.8 |
174.2 |
-0.3% |
12.9% |
Yield |
bp |
15 |
17 |
2 |
-3 |
14 |
14 |
0 |
-3 |
Divisional data |
|||||||||
GDV |
|||||||||
Gifting |
A$bn |
1.8 |
1.8 |
0% |
10% |
2.0 |
2.0 |
0% |
10% |
GPR |
A$bn |
10.9 |
10.9 |
0% |
-15% |
9.5 |
9.5 |
0% |
-13% |
Digital Payments |
A$bn |
152.1 |
141.6 |
-7% |
23% |
163.3 |
162.7 |
0% |
15% |
Revenue |
|||||||||
Gifting |
A$m |
84.6 |
79.0 |
-7% |
6% |
91.0 |
87.0 |
-4% |
10% |
GPR |
A$m |
140.1 |
157.5 |
12% |
-1% |
121.9 |
121.9 |
0% |
-23% |
Digital Payments |
A$m |
26.1 |
25.4 |
-3% |
17% |
29.8 |
29.0 |
-3% |
14% |
Yield |
|||||||||
Gifting |
4.60% |
4.30% |
-0.3% |
-0.16% |
4.50% |
4.30% |
0% |
0.00% |
|
GPR |
1.29% |
1.45% |
0.2% |
0.21% |
1.29% |
1.29% |
0% |
-0.16% |
|
Digital Payments |
0.02% |
0.02% |
0.0% |
0.00% |
0.02% |
0.02% |
0% |
0.00% |
|
Gross profit |
|||||||||
Gifting |
A$m |
68.7 |
63.2 |
-8% |
4.6% |
73.9 |
70.0 |
-5% |
10.7% |
GPR |
A$m |
85.1 |
110.3 |
30% |
18.0% |
73.8 |
79.2 |
7% |
-28.1% |
Digital Payments |
A$m |
22.3 |
21.7 |
-3% |
83.3% |
25.2 |
24.6 |
-2% |
13.2% |
Gross margin |
|||||||||
Gifting |
81.3% |
80.0% |
-1.3% |
-1.1% |
81.2% |
80.5% |
-1% |
0.5% |
|
GPR |
60.8% |
70.0% |
9.2% |
11.0% |
60.5% |
65.0% |
5% |
-5.0% |
|
Digital Payments |
85.3% |
85.4% |
0.1% |
30.8% |
84.6% |
84.8% |
0% |
-0.7% |
Source: Edison Investment Research
Exhibit 7: Financial summary
A$'m |
2019 |
2020 |
2021 |
2022 |
2023 |
2024e |
2025e |
||
Year end 30 June |
IFRS |
IFRS |
IFRS |
IFRS |
IFRS |
IFRS |
IFRS |
||
INCOME STATEMENT |
|||||||||
Revenue |
|
|
97.2 |
121.0 |
192.2 |
232.4 |
254.2 |
262.1 |
238.0 |
Cost of Sales |
(24.2) |
(32.9) |
(63.8) |
(74.6) |
(89.1) |
(66.8) |
(64.1) |
||
Gross Profit |
73.0 |
88.1 |
128.4 |
157.8 |
165.1 |
195.2 |
173.9 |
||
EBITDA |
|
|
29.7 |
32.5 |
42.2 |
34.3 |
(2.6) |
49.7 |
62.5 |
Normalised operating profit |
|
|
25.6 |
22.4 |
31.6 |
18.4 |
(19.2) |
32.5 |
44.8 |
Amortisation of acquired intangibles |
(7.5) |
(11.1) |
(20.2) |
(16.5) |
(18.2) |
(10.0) |
(10.0) |
||
Exceptionals |
(3.0) |
(13.6) |
(11.2) |
1.4 |
(262.9) |
(25.8) |
0.0 |
||
Share-based payments |
(4.2) |
(6.1) |
(5.0) |
(3.0) |
(1.8) |
(5.0) |
(2.5) |
||
Reported operating profit |
10.9 |
(8.5) |
(4.8) |
0.3 |
(302.0) |
(8.3) |
32.3 |
||
Net Interest |
(0.0) |
(0.7) |
(1.4) |
(2.4) |
(3.6) |
(5.0) |
(5.0) |
||
Joint ventures & associates (post tax) |
0.0 |
0.0 |
0.0 |
0.0 |
0.0 |
0.0 |
0.0 |
||
Exceptionals |
(1.8) |
1.3 |
(17.1) |
1.8 |
23.9 |
1.8 |
0.0 |
||
Profit Before Tax (norm) |
|
|
25.6 |
21.6 |
30.2 |
16.0 |
(22.8) |
27.5 |
39.8 |
Profit Before Tax (reported) |
|
|
9.0 |
(7.9) |
(23.3) |
(0.3) |
(281.8) |
(11.5) |
27.3 |
Reported tax |
(0.6) |
0.7 |
(5.4) |
(4.5) |
(3.1) |
2.3 |
(5.5) |
||
Profit After Tax (norm) |
20.5 |
17.2 |
24.1 |
12.8 |
(18.2) |
22.0 |
31.8 |
||
Profit After Tax (reported) |
8.5 |
(7.1) |
(28.7) |
(4.8) |
(284.8) |
(9.2) |
21.8 |
||
Minority interests |
(0.2) |
0.0 |
0.0 |
0.0 |
0.0 |
0.0 |
0.0 |
||
Discontinued operations |
0.0 |
0.0 |
0.0 |
0.0 |
0.0 |
0.0 |
0.0 |
||
Net income (normalised) |
20.3 |
17.2 |
24.1 |
12.8 |
(18.2) |
22.0 |
31.8 |
||
Net income (reported) |
8.3 |
(7.1) |
(28.7) |
(4.8) |
(284.8) |
(9.2) |
21.8 |
||
Basic ave. number of shares outstanding (m) |
249 |
304 |
360 |
371 |
374 |
374 |
375 |
||
EPS - basic normalised (A$) |
|
|
0.081 |
0.056 |
0.067 |
0.035 |
(0.049) |
0.059 |
0.085 |
EPS - normalised fully diluted (c) |
|
|
7.812 |
5.489 |
6.579 |
3.398 |
(4.869) |
5.736 |
8.287 |
EPS - basic reported (A$) |
|
|
0.033 |
(0.023) |
(0.080) |
(0.013) |
(0.762) |
(0.025) |
0.058 |
Dividend (A$) |
0.00 |
0.00 |
0.00 |
0.00 |
0.00 |
0.00 |
0.00 |
||
Revenue growth (%) |
36.9 |
24.4 |
58.9 |
20.9 |
9.4 |
3.1 |
(-9.2) |
||
Gross Margin (%) |
75.1 |
72.8 |
66.8 |
67.9 |
64.9 |
74.5 |
73.1 |
||
EBITDA Margin (%) |
30.6 |
26.9 |
21.9 |
14.8 |
-1.0 |
19.0 |
26.3 |
||
Normalised Operating Margin |
26.4 |
18.5 |
16.4 |
7.9 |
-7.5 |
12.4 |
18.8 |
||
BALANCE SHEET |
|||||||||
Fixed Assets |
|
|
162.9 |
872.1 |
685.3 |
827.3 |
581.3 |
511.6 |
498.1 |
Intangible Assets |
104.6 |
371.7 |
350.1 |
448.5 |
192.5 |
153.8 |
140.0 |
||
Tangible Assets |
5.4 |
14.6 |
11.2 |
12.7 |
10.6 |
11.3 |
12.0 |
||
Investments & other |
53.0 |
485.8 |
323.9 |
366.1 |
378.3 |
346.6 |
346.0 |
||
Current Assets |
|
|
313.8 |
1,008.6 |
1,603.5 |
1,855.1 |
2,413.2 |
1,745.3 |
1,721.7 |
Stocks |
18.2 |
22.3 |
16.4 |
21.5 |
27.5 |
27.6 |
26.7 |
||
Debtors |
14.4 |
21.7 |
22.0 |
35.8 |
38.9 |
39.3 |
36.0 |
||
Cash & cash equivalents |
33.1 |
118.4 |
141.2 |
73.7 |
71.4 |
49.6 |
26.7 |
||
Other |
248.2 |
846.2 |
1,424.0 |
1,724.1 |
2,275.5 |
1,628.8 |
1,632.3 |
||
Current Liabilities |
|
|
(299.0) |
(1,357.8) |
(1,792.8) |
(2,100.1) |
(2,709.9) |
(2,044.9) |
(1,982.6) |
Creditors |
(33.9) |
(47.5) |
(62.9) |
(65.7) |
(82.3) |
(68.3) |
(56.2) |
||
Tax and social security |
(0.8) |
(2.6) |
(6.0) |
(2.8) |
(3.1) |
(3.1) |
(3.1) |
||
Short term borrowings |
(15.0) |
0.0 |
(1.4) |
(1.8) |
(23.0) |
(72.2) |
(22.9) |
||
Other |
(249.4) |
(1,307.7) |
(1,722.5) |
(2,029.8) |
(2,601.5) |
(1,901.3) |
(1,900.4) |
||
Long Term Liabilities |
|
|
(33.5) |
(82.6) |
(81.1) |
(145.2) |
(110.1) |
(41.7) |
(42.5) |
Long term borrowings |
0.0 |
(35.8) |
(36.9) |
(81.6) |
(68.8) |
0.0 |
0.0 |
||
Other long term liabilities |
(33.5) |
(46.8) |
(44.2) |
(63.6) |
(41.3) |
(41.7) |
(42.5) |
||
Net Assets |
|
|
144.2 |
440.2 |
414.9 |
437.1 |
174.6 |
170.4 |
194.7 |
Minority interests |
0.0 |
0.0 |
0.0 |
0.0 |
0.0 |
0.0 |
0.0 |
||
Shareholders' equity |
|
|
144.2 |
440.2 |
414.9 |
437.1 |
174.6 |
170.4 |
194.7 |
CASH FLOW |
|||||||||
Op Cash Flow before WC and tax |
28.4 |
31.2 |
41.2 |
33.3 |
(2.3) |
49.7 |
62.5 |
||
Working capital |
2.0 |
3.6 |
31.7 |
(68.4) |
9.0 |
(29.4) |
(11.7) |
||
Exceptional & other |
(0.7) |
(12.7) |
(17.3) |
0.4 |
(2.6) |
(0.7) |
0.0 |
||
Tax |
(0.6) |
0.7 |
(5.4) |
(4.5) |
(3.1) |
2.3 |
(5.5) |
||
Net operating cash flow |
|
|
29.2 |
22.8 |
50.2 |
(39.1) |
0.9 |
21.9 |
45.4 |
Capex |
(5.8) |
(11.0) |
(12.6) |
(14.1) |
(11.7) |
(11.2) |
(11.8) |
||
Acquisitions/disposals |
(44.0) |
(142.5) |
(3.5) |
(57.1) |
10.9 |
(5.3) |
0.0 |
||
Net interest |
(0.0) |
(0.7) |
(1.4) |
(2.4) |
(3.6) |
(5.0) |
(5.0) |
||
Equity financing |
0.4 |
240.8 |
0.6 |
0.0 |
0.0 |
0.0 |
0.0 |
||
Dividends |
0.0 |
0.0 |
0.0 |
0.0 |
0.0 |
0.0 |
0.0 |
||
Other |
(0.4) |
(7.0) |
(11.0) |
(1.9) |
(2.2) |
(2.2) |
(2.2) |
||
Net Cash Flow |
(20.6) |
102.3 |
22.2 |
(114.6) |
(5.7) |
(1.8) |
26.4 |
||
Opening net debt/(cash) |
|
|
(39.0) |
(18.1) |
(82.5) |
(103.0) |
9.7 |
20.4 |
22.6 |
FX |
(0.3) |
(2.0) |
0.6 |
(1.1) |
3.4 |
0.0 |
0.0 |
||
Other non-cash movements |
0.0 |
(35.8) |
(2.4) |
3.0 |
(8.4) |
(0.5) |
0.0 |
||
Closing net debt/(cash) |
|
|
(18.1) |
(82.5) |
(103.0) |
9.7 |
20.4 |
22.6 |
(3.8) |
Source: EML Payments, Edison Investment Research
|
|
Research: Healthcare
AFT continues to focus on expanding its product portfolio and broadening its geographical footprint (including increased investments in its affiliates), which we expect to translate into stronger market traction and an increased top-line for AFT over the medium term. The company has updated the market on its international growth efforts, announcing new manufacturing agreements for Maxigesic Rapid and Crystaderm (ahead of their expected launches in the US and Chinese markets, respectively) and partnership expansion with Hikma (its US licensee of Maxigesic IV) to commercialise Combogesic IV in Saudi Arabia, Iraq and Jordan. Concurrently, AFT has made inroads into the UK market through the recent launch of Combogesic tablets and IV.