Last close As at 05/08/2026
GBP1.87
— 0.00 (0.00%)
Market capitalisation
GBP409m
Research: Investment Companies
Lowland Investment Company (LWI) invests across the UK stock market with the aim of providing attractive capital and income returns for its investors. Managed by James Henderson and Laura Foll at Janus Henderson Investors, LWI’s portfolio is diversified over more than 100 stocks, allowing the managers to back undervalued and recovery situations over the long term by starting with small positions to limit downside risk. An example of such a stock is insurance company Hiscox, bought in the aftermath of the collapse of the Lloyd’s insurance syndicates, since when its market capitalisation has increased from £40m to c £4bn. Holdings such as this have helped LWI to outperform its FTSE All-Share Index benchmark (in NAV total return terms) over one, three, five and 10 years, and since James Henderson began managing the portfolio in 1990.
Lowland Investment Company |
Long-term recovery focus drives outperformance |
Investment trusts |
25 October 2017 |
Share price/discount performance
Three-year performance vs index
Gearing
Analysts
|
|||||||||||||||||||||||||||||||||||||||||||||||||||||||||||||||||||||||||||||||||||||||||||||
Lowland Investment Company (LWI) invests across the UK stock market with the aim of providing attractive capital and income returns for its investors. Managed by James Henderson and Laura Foll at Janus Henderson Investors, LWI’s portfolio is diversified over more than 100 stocks, allowing the managers to back undervalued and recovery situations over the long term by starting with small positions to limit downside risk. An example of such a stock is insurance company Hiscox, bought in the aftermath of the collapse of the Lloyd’s insurance syndicates, since when its market capitalisation has increased from £40m to c £4bn. Holdings such as this have helped LWI to outperform its FTSE All-Share Index benchmark (in NAV total return terms) over one, three, five and 10 years, and since James Henderson began managing the portfolio in 1990.
12 months ending |
Share price |
NAV |
FTSE All-Share (%) |
FTSE 350 HY (%) |
FTSE 250 |
30/09/13 |
37.6 |
33.7 |
18.9 |
16.8 |
30.5 |
30/09/14 |
4.9 |
5.6 |
6.1 |
6.7 |
5.9 |
30/09/15 |
(2.2) |
0.7 |
(2.3) |
(9.7) |
11.4 |
30/09/16 |
7.4 |
12.0 |
16.8 |
22.8 |
10.2 |
30/09/17 |
16.4 |
17.3 |
11.9 |
10.4 |
14.3 |
Source: Thomson Datastream. Note: All % on a total return basis in GBP.
Investment strategy: Multi-cap growth and income
LWI’s managers seek to construct a diversified portfolio of typically 100+ predominantly UK stocks, chosen from across the market capitalisation spectrum, with a tilt towards value and recovery situations. While wishing to retain exposure to index gains through holding heavyweight stocks such as Shell and HSBC, they favour small and mid-cap companies for their superior capital and dividend growth characteristics. As these stocks may be under-researched, the managers make use of valuation screens as well as meeting hundreds of companies each year. Positions are built and divested slowly in order to limit volatility.
Market outlook: More selective approach needed?
Investors may feel that the balance of risks is to the downside, given the FTSE All-Share index is trading close to an all-time high despite macroeconomic and political worries. However, earnings growth in 2017 has been positive in aggregate, providing some support to generally higher P/E valuations, and pockets of value arguably still exist for investors who are prepared to look beyond the index level and take a more selective approach.
Valuation: Discount stable; 3.2% dividend yield
At 23 October 2017, LWI’s shares traded at a 7.6% discount to cum-income NAV (with debt at market value). While this is wider than the averages over one, three, five and 10 years (a range of 2.2% to 5.9%), it has stabilised markedly in the past six months after a period of higher volatility, without the need for any discount management by the board. Based on the last four dividends, LWI currently has a dividend yield of 3.2%.
Exhibit 1: Company at a glance
Investment objective and fund background |
Recent developments |
|||||||||||||||||||||||||||||||||||||||||||||||||||||||||
Lowland Investment Company aims to give shareholders a higher-than-average return with growth of both capital and income over the medium to long term through a broad spread of predominantly UK companies. It measures its performance against the total return on the FTSE All-Share Index. |
■ 26 September 2017: Third interim dividend of 12.0p declared (Q316: 11.0p). ■ 30 May 2017: Results for the six months ended 31 March. NAV TR +10.5% and share price TR +10.0% versus +8.1% for the FTSE All-Share Index. Second interim dividend of 12.0p declared (Q216: 11.0p). ■ 30 May 2017: Amendment to fee arrangements. Management fee reduced from 0.5% to 0.4% on net chargeable assets above £375m. Total fee cap of 0.75% replaced with performance fee cap of 0.25%, meaning maximum fees of 0.75% on the first £375m and 0.65% thereafter. |
|||||||||||||||||||||||||||||||||||||||||||||||||||||||||
Forthcoming |
Capital structure |
Fund details |
||||||||||||||||||||||||||||||||||||||||||||||||||||||||
AGM |
January 2018 |
Ongoing charges |
0.63% |
Group |
Henderson Global Investors |
|||||||||||||||||||||||||||||||||||||||||||||||||||||
Annual results |
December 2017 |
Net gearing |
6.0% |
Managers |
James Henderson, Laura Foll |
|||||||||||||||||||||||||||||||||||||||||||||||||||||
Year end |
30 September |
Annual mgmt fee |
Tiered (see page 7) |
Address |
201 Bishopsgate, |
|||||||||||||||||||||||||||||||||||||||||||||||||||||
Dividend paid |
Quarterly |
Performance fee |
Yes (see page 7) |
|||||||||||||||||||||||||||||||||||||||||||||||||||||||
Launch date |
October 1963 |
Trust life |
Indefinite |
Phone |
+44 (0) 20 7818 1818 |
|||||||||||||||||||||||||||||||||||||||||||||||||||||
Continuation vote |
None |
Loan facilities |
Up to £90m (see page 7) |
Website |
||||||||||||||||||||||||||||||||||||||||||||||||||||||
Dividend policy and history (financial years) |
Share buyback policy and history (calendar years) |
|||||||||||||||||||||||||||||||||||||||||||||||||||||||||
Dividends are paid quarterly in April, July, October and January. LWI aims to achieve a growing income for investors and has maintained or increased its dividend each year for 40 years. |
LWI’s board has the authority to buy back up to 14.99% of shares, but in practice this is not used. It may also issue new shares at a premium in response to investor demand. |
|||||||||||||||||||||||||||||||||||||||||||||||||||||||||
|
|
|||||||||||||||||||||||||||||||||||||||||||||||||||||||||
Shareholder base (as at 30 September 2017) |
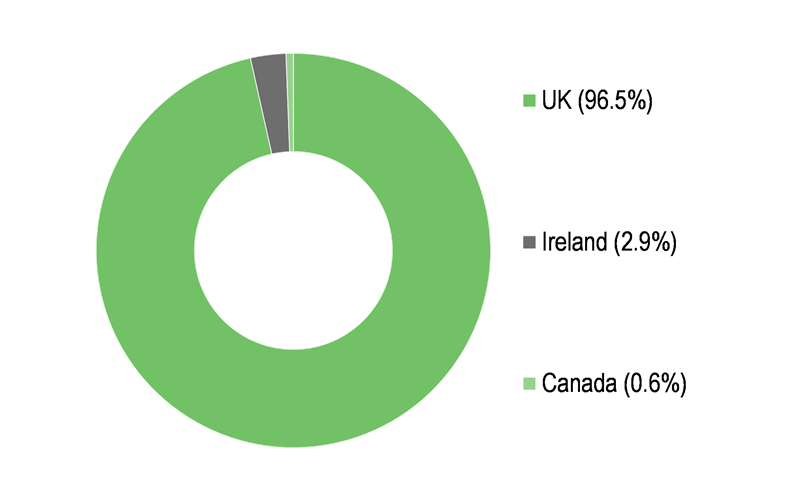
Portfolio exposure by geography (as at 30 September 2017) |
|||||||||||||||||||||||||||||||||||||||||||||||||||||||||
|
|
|||||||||||||||||||||||||||||||||||||||||||||||||||||||||
Top 10 holdings (as at 30 September 2017) |
||||||||||||||||||||||||||||||||||||||||||||||||||||||||||
|
||||||||||||||||||||||||||||||||||||||||||||||||||||||||||
Source: Lowland Investment Company, Edison Investment Research, Bloomberg, Morningstar. Note: *N/A where not in September 2016 top 10.
Market outlook: Look beyond the headlines
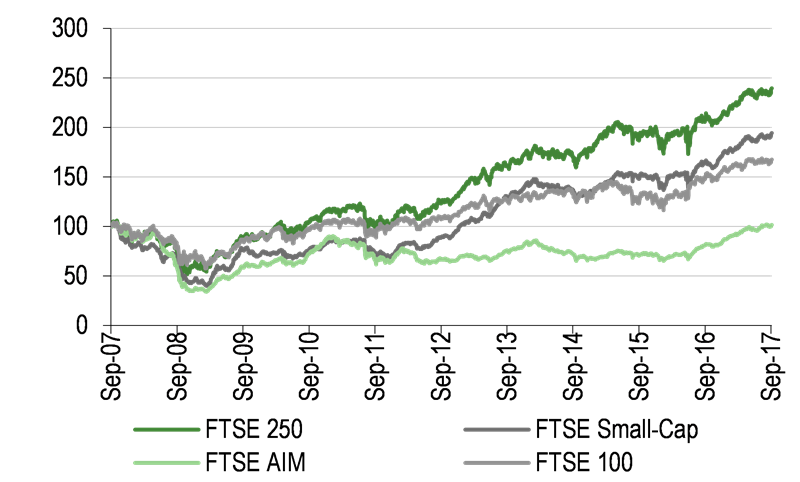
With the UK’s FTSE All-Share Index reaching new all-time highs in recent weeks, despite worries over the rate of inflation, stagnating wages, the pace and timing of interest rate rises and a lack of progress in negotiations over Britain’s exit from the European Union, investors might feel that the balance of risks is to the downside. However, as shown in Exhibit 2 below (left-hand chart), some areas of the market have come further than others over the past decade, with the mid-cap FTSE 250 (total return of 138.6%) almost doubling the 75% total return on the All-Share, while the FTSE AIM Index has risen by just 1% (albeit up c 50% over the past five years). The outperformance of the FTSE 250 and the FTSE Small-Cap underlines the superior growth record of small and mid-cap companies, while also demonstrating the potential value of a more selective approach to investment than simply following a broad market index. Concerns are also emerging over high P/E valuations in many areas of the market, although these have been supported to an extent by broad-based earnings growth and positive estimate revisions. The right-hand chart shows the 12-month forward P/E by sector for the FTSE All-Share Index. While the extremes of valuation tend to be structural – that is, technology stocks trade on high P/E ratios, while basic materials are ‘cheap’ – the chart suggests that areas such as financials may still offer value opportunities for stockpickers.
|
Exhibit 2: Market performance and valuation |
|
UK index performance over 10 years |
Forward P/E valuations by FTSE All-Share Index sector |
|
|
|
Source: Thomson Datastream, Bloomberg, Edison Investment Research. Data to 30 September 2017. |
|
Fund profile: Income and growth with a value slant
LWI was launched in 1963, aiming to achieve above-average returns with growth in both capital and income, by investing mainly in UK-listed companies. It is a member of the AIC’s UK Equity Income sector, although its focus is on total returns and dividend growth potential, rather than a high starting yield. The trust has been managed since launch by Janus Henderson Investors and its predecessor companies. James Henderson has been fund manager since 1990, assisted since 2013 by Laura Foll, who was appointed joint manager in 2016.
The managers run a diversified portfolio of stocks with a focus on value and recovery situations. They seek to invest in companies whose quality and growth prospects are under-appreciated by the market, and are prepared to hold positions for the long term: for example, insurance company Hiscox was purchased at a market capitalisation of c £40m following the collapse of the Lloyd’s syndicates in the early 1990s; it is now a constituent of the FTSE 250 with a market cap of £3.9bn.
LWI uses the FTSE All-Share Index as a performance benchmark, but may invest up to 20% of assets overseas in cases where the managers find attractive stocks with no UK-listed equivalents. The trust tends to have a much higher weighting in smaller stocks than the benchmark index, and the largest FTSE 100 stocks are not expected to make up more than 50% of the portfolio, whereas they account for 80% of the FTSE All-Share Index. The trust has structural gearing through a £30m issue of 20-year loan notes (c 6.9% of NAV), as well as a tactical gearing facility of up to £60m. Gearing is deployed on a stock-specific basis rather than pro rata across the whole portfolio.
The fund managers: James Henderson and Laura Foll
The managers’ view: Seeking compelling new ideas
Managers Henderson and Foll admit that it has become harder to find compelling value ideas, particularly in the mid-cap area, where many stocks look expensive. While they have benefited from dramatic reratings in companies such as specialist healthcare and industrial tape maker Scapa, and insurance company Hiscox – where they have made many times their original investment – Henderson says the challenge is to refresh the portfolio with new ideas of the same calibre.
One consequence of the lack of value in mid-caps has been an increase in LWI’s large-cap weighting (c 40% in FTSE 100 stocks compared with a longer-term average of c 33%). Recovery stocks in the FTSE 100, such as Rolls-Royce, Standard Chartered and International Airlines Group, which owns British Airways, have all done well for the portfolio over FY17. While LWI is run very much with a long-term view, Henderson comments that he and Foll tend to be more active in trading FTSE 100 stocks, which may go in and out of favour more quickly because of the breadth of research coverage and the tendency of analysts to form a consensus.
The managers’ value slant means they are acutely aware of the greater risks presented by stocks trading at particularly high earnings multiples, especially when high valuations are accompanied by historically high margins, where any reversion to the mean could lead to significant pressure on earnings. Because of this risk-awareness, says Henderson, he and Foll tend to sell positions “too early”, although this is preferable to trying to time the market, as corrections can be swift and unpredictable. “You never know when the correction will come,” he adds. “In hindsight, the Japanese market was overvalued for seven years before it fell in 1989.”
Asset allocation
Investment process: Focus on recovery and growth potential
Four key tenets underpin LWI’s investment approach, essentially unchanged since launch in 1963.
■
Small and mid-cap companies should make better long-term investments, because of their superior growth potential.
■
Given that long-term investment returns have tended to exceed the cost of borrowing, it is appropriate to employ gearing within the portfolio.
■
Dividend growth goes hand-in-hand with capital growth as a driver of investment performance.
■
The UK is home to many world-class companies that can grow sustainably over the long term.
To identify those companies that can generate capital growth and a growing income, Henderson and Foll filter the investment universe of c 1,500 companies using a range of valuation criteria. Their preference is for companies whose prospects are undervalued by the market, that have the potential to recover and grow. Ideas may come from interactions with the wider UK and global equity teams at Janus Henderson, and the managers meet several hundred companies each year.
Henderson and Foll seek to build a diversified portfolio of household-name blue-chips, fast-growing mid-caps and under-researched, earlier-stage smaller companies, along with recovery stocks of all sizes. Historically, broadly one-third of the portfolio has been invested in each size segment; however, more recently the number of mid-cap holdings has fallen, as strong performance from FTSE 250 companies has made it harder to find compelling value. While benchmarked against the FTSE All-Share, portfolio construction is largely unconstrained. However, the managers will tend always to have holdings in each industry sector, particularly the larger ones, where the relative risk of having no exposure in a period of strong sector performance is deemed unacceptable.
The managers say they will only buy stocks that have real potential for sales and earnings growth. Although LWI sits in the UK Equity Income sector, Henderson and Foll are willing to invest in companies that are not currently paying a dividend, as long as there is potential for them to do so.
The trust has a longer stock list than many peers, which the managers say is appropriate given the recovery focus and the relatively high weighting in smaller companies, including those listed on the Alternative Investment Market (AIM). Positions are built gradually, usually starting at around 30bp, and also exited in stages. This allows the managers to take a bold view on a stock whose prospects may still be deemed extremely negative by the majority of investors. Henderson cites the example of Scapa, bought at a share price of 20p when there was a real possibility that the company could fail, and finally exited (having been reducing for some time) earlier this year at a share price approaching £5 and a P/E ratio in the high 20s.
Current portfolio positioning
At 30 September 2017, there were 122 holdings in the LWI portfolio, compared with 114 a year earlier. While the great majority of positions are below 1% of the portfolio, the top 10 stocks made up 28.1% of the total (27.0% at 30 September 2016). The two largest holdings, Royal Dutch Shell and HSBC, are significant underweights as together they make up 14% of the FTSE All-Share.
Having been net buyers of stocks through H117, funded by gearing which stood at 12.6% at 31 March, Henderson and Foll had reduced net gearing to 6% by 30 September 2017, mainly as a result of taking profits in holdings that had begun to look fully or overvalued, such as Conviviality (still held, but trimmed several times) and Scapa (fully exited in H217). The managers report that they have not found sufficient buy ideas of similar quality to replace the holdings sold; in particular, they feel it is too early to add to cheap UK domestic stocks, which are still subject to significant share price falls if results do not match up to expectations.
Exhibit 3: Portfolio sector exposure vs FTSE All-Share (% unless stated)
Portfolio end- Sept 2017* |
Portfolio end- Sept 2016* |
Change (pp) |
Index weight |
Active weight vs index (pp) |
Trust weight/ index weight (x) |
|
Financials |
32.8 |
27.9 |
4.9 |
26.4 |
6.3 |
1.2 |
Industrials |
28.8 |
26.7 |
2.1 |
11.3 |
17.5 |
2.6 |
Consumer services |
11.1 |
10.9 |
0.2 |
11.0 |
0.1 |
1.0 |
Oil & gas |
8.5 |
9.7 |
(1.1) |
12.2 |
(3.7) |
0.7 |
Basic materials |
5.7 |
10.3 |
(4.6) |
7.2 |
(1.5) |
0.8 |
Consumer goods |
5.7 |
6.1 |
(0.4) |
15.7 |
(10.0) |
0.4 |
Healthcare |
4.3 |
4.8 |
(0.6) |
8.5 |
(4.3) |
0.5 |
Telecommunications |
1.4 |
2.2 |
(0.8) |
3.6 |
(2.1) |
0.4 |
Utilities |
1.4 |
1.2 |
0.2 |
3.0 |
(1.6) |
0.5 |
Technology |
0.3 |
0.2 |
0.0 |
1.1 |
(0.9) |
0.2 |
100.0 |
100.0 |
100.0 |
Source: Lowland Investment Company, Edison Investment Research. Note: *Portfolio weights are approximate.
On a sector level, the biggest overweight is industrials, where the managers have historically found many out-of-favour stocks with good growth potential, although even here, companies such as top 10 position Senior are trading at high valuations relative to history. The most significant underweight is consumer goods, where stocks perceived to have defensive characteristics are very highly valued, and those that are cheaper may have structural, rather than short-term problems.
New holdings in H217 include AIM-listed bowling alley operator Ten Entertainment, trading on a P/E of c 10x and with a 7% dividend yield, which Henderson and Foll bought at IPO in April; and Strix, another recent AIM IPO, which is the leading listed global manufacturer of kettle safety components, and also offered a c 7% dividend yield at purchase in August.
Performance: Short- and long-term outperformance
|
Exhibit 4: Investment trust performance to 30 September 2017 |
|
Price, NAV and benchmark total return performance, one-year rebased |
Price, NAV and benchmark total return performance (%) |
|
|
|
Source: Thomson Datastream, Edison Investment Research. Note: Three, five and 10-year performance figures and performance under James Henderson (JH, since 30 October 1990) annualised. |
|
LWI performed strongly over 12 months to 30 September 2017 (Exhibit 4), beating the benchmark FTSE All-Share Index and producing NAV and share price total returns of 17.3% and 16.4%, respectively. Positive performance contributors included off-licence and drinks distributor Conviviality, specialist tape manufacturer Scapa (sold after a substantial rerating), and insurance company Hiscox. Returns held up well despite exposure to some of the year’s highest-profile share price setbacks, including contractors Carillion and Interserve, and Provident Financial. LWI’s managers point to the broad diversification of the portfolio as an important factor in limiting the impact of these detractors. Long-term performance versus the benchmark has also been positive, with NAV total returns outperforming the FTSE All-Share Index over three, five and 10 years and across the 27-year tenure of manager James Henderson (Exhibits 5 and 6).
|
Exhibit 5: Share price and NAV total return performance, relative to indices (%) |
|||||||||
|
One month |
Three months |
Six months |
One year |
Three years |
Five years |
10 years |
JH* |
|
Price relative to FTSE All-Share |
(0.3) |
(0.2) |
2.2 |
3.9 |
(4.3) |
9.4 |
11.9 |
142.2 |
|
NAV relative to FTSE All-Share |
0.5 |
(0.2) |
1.7 |
4.8 |
3.8 |
16.2 |
25.0 |
136.2 |
|
Price relative to FTSE 350 HY |
(0.7) |
0.6 |
4.0 |
5.4 |
(0.2) |
15.5 |
25.9 |
102.2 |
|
NAV relative to FTSE 350 HY |
0.1 |
0.7 |
3.6 |
6.3 |
8.3 |
22.7 |
40.6 |
97.3 |
|
Price relative to FTSE 250 |
(1.4) |
(1.5) |
(0.7) |
1.8 |
(12.8) |
(8.9) |
(17.8) |
14.7 |
|
NAV relative to FTSE 250 |
(0.6) |
(1.5) |
(1.1) |
2.7 |
(5.4) |
(3.3) |
(8.2) |
11.9 |
|
Price relative to FTSE Small Cap |
(1.8) |
(1.5) |
(0.6) |
(1.2) |
(13.8) |
(18.7) |
1.3 |
169.5 |
|
NAV relative to FTSE Small Cap |
(1.0) |
(1.4) |
(1.0) |
(0.3) |
(6.5) |
(13.7) |
13.2 |
163.0 |
|
|
Source: Thomson Datastream, Edison Investment Research. Note: *JH is performance under James Henderson, since 30 October 1990. Data to end-September 2017. Geometric calculation. |
|||||||||
|
Exhibit 6: NAV total return performance relative to benchmark over 10 years |
|||||||||
|
|||||||||
|
Source: Thomson Datastream, Edison Investment Research |
|||||||||
Discount: Broadly stable over past six months
At 23 October 2017, LWI’s shares traded at a 7.6% discount to cum-income NAV (with debt at fair value). This was somewhat wider than the one-year average discount of 5.9%, itself wider than the three-, five- and 10-year averages of 4.4%, 2.2% and 3.8% respectively. However, the discount has been broadly stable over the past six months, in contrast to the more volatile picture over the preceding two years (Exhibit 7). While LWI’s board has authority to buy back up to 14.99% of shares each year to manage a discount, in practice no repurchases have been made, and in spite of short-term discount volatility, over time the shares have tended to trade relatively close to NAV.
|
Exhibit 7: Share price premium/discount to NAV (including income) over three years (%) |
|
|
Source: Thomson Datastream, Edison Investment Research |
Capital structure and fees
A conventional investment trust, LWI had 27.0m ordinary shares in issue at 23 October 2017, unchanged over 12 months. Following the issue of £30m of 20-year loan notes in January 2017 at a fixed coupon of 3.15%, the trust now has a mix of short- and longer-term borrowings, with up to £90m of available gearing (c 20% of net assets). Net gearing stood at 6.0% at 30 September 2017.
A recent change to LWI’s fee arrangements means Janus Henderson is now paid a management fee of 0.5% of the first £375m of net assets (excluding any Henderson-managed funds) and 0.4% thereafter (previously a flat 0.5%). A performance fee may be paid if the NAV total return is more than 10% ahead of the FTSE All-Share Index return (see our initiation note for a full explanation). This is now capped at 0.25% of net chargeable assets, so the previous cap on total fees of 0.75% is now 0.75% of assets up to £375m and 0.65% thereafter. Ongoing charges for FY16 were 0.63%.
Dividend policy and record
LWI has paid dividends quarterly since 2013. Interim dividends are paid in April, July and October, with a final dividend paid in January that has tended to set the level for the next three quarters. So far in FY17, three dividends of 12p each have been paid or declared, and the board has stated its intention that the final dividend should be 13p barring any unforeseen circumstances. This suggests total dividends for the year of 49p, an 8.9% increase on the 45p paid in respect of FY16.The total dividend has been increased every year since 1975 with one exception (2009, when it was held), with a compound annual growth rate of 7.1% over the 25 years to 30 September 2016, compared with 2.7% for RPI inflation. Dividends have been fully covered by income in eight of the last 10 financial years, and at end-H117, LWI had a revenue reserve of 41p per share. Based on the 23 October share price and the last four dividends, LWI currently yields 3.2%.
Peer group comparison
LWI is a member of the Association of Investment Companies’ UK Equity Income sector, a large peer group of 23 funds, of which the largest 11 (with market cap above £350m) are shown below in Exhibit 8. In NAV total return terms, LWI is above the weighted average over one, three, five and 10 years, ranking either sixth or fifth in the whole sector of 23 funds. Ongoing charges are below average, although LWI is the only one of the larger peers to levy a performance fee. Gearing is broadly in line with the average, and the discount to NAV is wider than average. The dividend yield is towards the lower end of the group range, in line with LWI’s focus on capital and income growth rather than a high starting yield.
Exhibit 8: AIC UK Equity Income investment trusts with market cap over £350m as at 18 October 2017
% unless stated |
Market cap £m |
NAV TR |
NAV TR |
NAV TR |
NAV TR |
Ongoing charge |
Perf. |
Discount (ex-par) |
Net |
Dividend yield (%) |
Lowland |
410.3 |
17.3 |
42.9 |
86.1 |
115.0 |
0.6 |
Yes |
(6.1) |
106 |
3.2 |
City of London |
1,497.1 |
11.8 |
37.0 |
69.5 |
94.6 |
0.4 |
No |
1.5 |
108 |
4.0 |
Diverse Income Trust |
385.4 |
14.2 |
49.2 |
112.2 |
|
1.2 |
No |
(0.3) |
100 |
3.2 |
Dunedin Income Growth |
392.5 |
9.0 |
30.2 |
51.6 |
56.1 |
0.7 |
No |
(9.9) |
112 |
4.5 |
Edinburgh Investment |
1,385.3 |
9.2 |
41.0 |
83.1 |
108.4 |
0.6 |
No |
(8.1) |
112 |
3.6 |
Finsbury Growth & Income |
1,212.4 |
18.0 |
65.5 |
121.5 |
212.2 |
0.7 |
No |
0.8 |
102 |
2.0 |
JPMorgan Claverhouse |
381.9 |
17.8 |
42.8 |
84.7 |
83.9 |
0.8 |
No |
(7.7) |
111 |
3.5 |
Merchants Trust |
527.3 |
14.7 |
32.9 |
58.0 |
59.7 |
0.6 |
No |
(8.7) |
117 |
5.1 |
Murray Income Trust |
529.8 |
12.1 |
33.9 |
58.0 |
72.5 |
0.7 |
No |
(7.9) |
102 |
4.2 |
Perpetual Income & Growth |
931.6 |
8.6 |
29.8 |
80.6 |
122.3 |
0.7 |
No |
(8.5) |
113 |
3.6 |
Temple Bar |
875.4 |
15.5 |
34.0 |
66.7 |
128.1 |
0.5 |
No |
(5.2) |
98 |
3.2 |
Sector weighted average |
13.4 |
41.1 |
80.3 |
110.0 |
0.7 |
(4.3) |
107 |
3.5 |
||
LWI rank in sector (23 funds) |
8 |
6 |
5 |
5 |
6 |
19 |
13 |
11 |
18 |
Source: Morningstar, Edison Investment Research. Note: *Performance to 17 October 2017. TR = total return. Net gearing is total assets less cash and equivalents as a percentage of net assets (100 = ungeared).
The board
There are five directors on LWI’s board, all non-executive and independent of the manager. Robert Robertson became a director in 2011 and was appointed chairman in January 2017 on the retirement of Peter Troughton. Karl Sternberg and Kevin Carter have both served on the board since 2009. Duncan Budge became a director in 2014 and the newest director, Gaynor Coley, was appointed in November 2016. She has taken over from Robertson as chairman of the audit committee. The directors have backgrounds in industry, investment management and accountancy.
|
|
Research: Healthcare
Pixium has received clearance from the French regulatory agency (Agence Nationale de Sécurité du Médicament et des Produits de Santé, or ANSM) to start a feasibility study of its Prima sub-retinal bionic vision system (BVS) on up to five patients with advanced Dry-ARMD. It plans to complete the first implantation before YE17, and obtain six-month study data in H218. If results are positive, Pixium expects to start an EU pivotal study in H119. We have reinstated our Prima probability of success estimate in our model to 12.5% (from 10%), leading to an increase in our pipeline rNPV to €82.6m (from €63.0m, previously).