Last close As at 05/08/2026
GBP5.28
▲ 4.00 (0.76%)
Market capitalisation
GBP232m
Research: Investment Companies
Standard Life UK Smaller Companies Trust (SLS) has been managed by Harry Nimmo since 2003. He aims to generate long-term capital growth from a diversified portfolio of smaller-cap UK equites. While a little more cautious on the near-term outlook for small caps given, their strong start to the year and Brexit-related uncertainty, Nimmo remains very positive on the longer-term outlook. He suggests that the portfolio’s companies have potential earnings growth of 10-15% pa, which bodes well for SLS’s dividend growth. The trust has a very strong performance track record; it has outperformed its Numis Smaller Companies ex-Investment Companies Index benchmark over one, three, five and 10 years. Over the last 10 years, SLS’s dividend has compounded at an annual rate of 23.5%; its current yield is 1.5%.
Standard Life UK Smaller Companies |
Long-term positive performance track record |
Investment trusts |
7 August 2017 |
Share price/discount performance
Three-year performance vs index
Gearing
Analysts
|
|||||||||||||||||||||||||||||||||||||||||||||||||||||||||||||||||||||||||||||||||||||||||||||
Standard Life UK Smaller Companies Trust (SLS) has been managed by Harry Nimmo since 2003. He aims to generate long-term capital growth from a diversified portfolio of smaller-cap UK equites. While a little more cautious on the near-term outlook for small caps given, their strong start to the year and Brexit-related uncertainty, Nimmo remains very positive on the longer-term outlook. He suggests that the portfolio’s companies have potential earnings growth of 10-15% pa, which bodes well for SLS’s dividend growth. The trust has a very strong performance track record; it has outperformed its Numis Smaller Companies ex-Investment Companies Index benchmark over one, three, five and 10 years. Over the last 10 years, SLS’s dividend has compounded at an annual rate of 23.5%; its current yield is 1.5%.
12 months ending |
Share price |
NAV |
Numis Smaller Cos ex-ICs (%) |
FTSE AIM |
FTSE All-Share (%) |
FTSE 250 |
31/07/13 |
39.8 |
38.1 |
40.4 |
8.4 |
24.3 |
37.3 |
31/07/14 |
(7.6) |
1.7 |
10.2 |
8.0 |
5.6 |
6.9 |
31/07/15 |
21.6 |
22.9 |
13.3 |
(1.0) |
5.4 |
17.1 |
31/07/16 |
5.8 |
4.1 |
(1.3) |
2.1 |
3.8 |
0.5 |
31/07/17 |
29.4 |
30.6 |
23.8 |
32.1 |
14.9 |
17.6 |
Source: Thomson Datastream. Note: All % on a total return basis in pounds sterling.
Investment strategy: Six principles for investing
Nimmo has six principles for successful investing in small-cap equities: look for sustainable growth; go for quality; run your winners; concentrate your efforts; management longevity; and value is not everything. He uses Standard Life Investment’s proprietary stock selection Matrix to screen the investible universe, seeking high-quality companies with the potential to become the larger companies of tomorrow. Potential investee companies then undergo thorough fundamental analysis. As a result of the bottom-up stock selection process, SLS’s sector exposures may vary significantly from the benchmark. Gearing is permitted in a range of 5% cash to 25% debt as a percentage of net assets and is made up of convertible unsecured loan stock (CULS), which will expire in March 2018; at end-June 2017, net gearing was 2.5%.
Market outlook: Importance of stock selection
Following strong share price performance over the last 12 months, the valuation of UK equities is looking less attractive. Smaller-cap UK companies have seen a higher rerating than larger companies, which means investors seeking exposure to the asset class may find appeal in choosing a fund with a clearly defined, bottom-up stock selection process.
Valuation: Targeted maximum discount of 8%
SLS’s current 6.3% share price discount to cum-income NAV is only slightly lower than its 12-month average of 6.6%, but has narrowed meaningfully from its five-year high of 11.8% in July 2016. The board has an active discount management policy, aiming to keep the discount at or below 8%. Share repurchases are the preferred method and are supplemented with discretionary six-month tender offers.
Exhibit 1: Trust at a glance
Investment objective and fund background |
Recent developments |
|||||||||||||||||||||||||||||||||||||||||||||||||||||||||
Standard Life UK Smaller Companies Trust (SLS) aims to achieve long-term capital growth through investment in a diversified portfolio mainly consisting of UK-quoted smaller companies. SLS started life as Edinburgh Smaller Companies in 1993 and Standard Life Investments assumed management from 2003. |
■ 13 April 2017: 0.9m shares issued from treasury following the conversion of £2.1m nominal CULS. ■ 27 February 2017: Interim report for six months ending 31 December 2016. NAV TR +16.7% versus benchmark TR +17.7%. Share price TR +16.5%. Announcement of 1.5p interim dividend. ■ 20 February 2017: Appointment of Tim Scholefield as independent non-executive director. |
|||||||||||||||||||||||||||||||||||||||||||||||||||||||||
Forthcoming |
Capital structure |
Fund details |
||||||||||||||||||||||||||||||||||||||||||||||||||||||||
AGM |
October 2017 |
Ongoing charges |
1.16% (as at H117) |
Group |
Standard Life Investments |
|||||||||||||||||||||||||||||||||||||||||||||||||||||
Final results |
September 2017 |
Net gearing |
2.5% |
Manager |
Harry Nimmo |
|||||||||||||||||||||||||||||||||||||||||||||||||||||
Year end |
30 June |
Annual mgmt fee |
0.85% to £250m, then 0.65% |
Address |
1 George Street, Edinburgh, EH2 2LL |
|||||||||||||||||||||||||||||||||||||||||||||||||||||
Dividend paid |
Apr and Oct/Nov |
Performance fee |
None |
|||||||||||||||||||||||||||||||||||||||||||||||||||||||
Launch date |
1993 |
Trust life |
Indefinite |
Phone |
+44 (0)345 6002268 |
|||||||||||||||||||||||||||||||||||||||||||||||||||||
Continuation vote |
N/A |
Convertible loan stock |
£13.3m nominal |
Website |
||||||||||||||||||||||||||||||||||||||||||||||||||||||
Dividend policy and history (financial years) |
Share buyback policy and history (financial years) |
|||||||||||||||||||||||||||||||||||||||||||||||||||||||||
While focused on SLS’s long-term capital growth objective, the manager pays close attention to the potential for dividend growth and SLS’s ordinary dividends have compounded at more than 20% pa over 10 years. |
The board is focused on managing the discount such that the share price discount to cum-income NAV is less than 8%. This is managed via share buybacks and periodic tender offers when required. Allotments since March 2014 relate to exercise of CULS. |
|||||||||||||||||||||||||||||||||||||||||||||||||||||||||
|
|
|||||||||||||||||||||||||||||||||||||||||||||||||||||||||
Shareholder base (as at 26 June 2017) |
Portfolio exposure by sector (as at 30 June 2017) |
|||||||||||||||||||||||||||||||||||||||||||||||||||||||||
|
|
|||||||||||||||||||||||||||||||||||||||||||||||||||||||||
Top 10 holdings (as at 30 June 2017) |
||||||||||||||||||||||||||||||||||||||||||||||||||||||||||
|
||||||||||||||||||||||||||||||||||||||||||||||||||||||||||
Source: Standard Life UK Smaller Companies Trust, Edison Investment Research, Bloomberg, Morningstar. Note: *N/A where not in June 2016 top 10.
Market outlook: Stock selection now more important
Over the last 10 years, the mid- and small-cap Numis Smaller Companies ex-ICs (NSCI XIC) Index has performed significantly better than the FTSE All-Share and FTSE AIM indices (Exhibit 2, left-hand side). Indeed the FTSE AIM Index, despite rallying over the last year, remains below the level at the start of the global financial crisis. The UK stock market, along with other global markets, has rerated upwards in recent months (Exhibit 2 right-hand side). On a forward P/E basis, over the last six months, smaller-cap stocks have had a larger rerating than larger-cap stocks (the NSCI XIC has risen from 13.8x to 16.0x versus the FTSE 100, which has risen from 14.7x to 15.5x). As a result, for investors seeking exposure to UK smaller-cap companies, a fund selecting stocks on a bottom-up basis that also has a positive long-term relative performance track record, may hold appeal.
|
Exhibit 2: Market performance and valuation metrics |
||||||||||||||||||||||||||||||||||||
NSCI XIC index performance vs FTSE AIM and FTSE ALL-Share indices |
Index valuation metrics (as at 3 August 2017) |
|||||||||||||||||||||||||||||||||||
|
|
|||||||||||||||||||||||||||||||||||
|
Source: Thomson Datastream, Edison Investment Research, Bloomberg |
||||||||||||||||||||||||||||||||||||
Fund profile: Disciplined small-cap investment
SLS was launched in 1993 as Edinburgh Smaller Companies Trust, originally managed by Edinburgh Fund Managers. After a period of sustained weak performance, Standard Life Investments was appointed as manager on 1 September 2003. Since then, the lead manager has been Harry Nimmo, who employs Standard Life Investment’s proprietary stock-selection Matrix system and undertakes thorough fundamental analysis to construct a diversified portfolio of c 60 high-quality stocks, aiming to generate long-term capital growth. Performance is measured against the Numis Smaller Companies ex-Investment Companies Index, although SLS has broad exposure to UK smaller companies (Exhibit 3, page 4). Income growth has also been a key feature of the trust; the 10-year compound annual growth in dividends is 23.5%. Gearing is permitted in a range of 5% cash to 25% of net assets; at end-June 2017, net gearing was 2.5%.
The fund manager: Harry Nimmo
The manager’s view: A little more cautious over the near term
Nimmo comments that earnings reports in Q117 were broadly supportive for small caps across a wide range of sectors and that the trading environment was pretty decent, evidenced by positive outlook statements. However, more recently he notes a more difficult environment for some of the consumer-facing companies. Concerns started before the snap UK general election and relate to the uncertain outlook arising from Brexit negotiations. The manager says that UK small caps have had a particularly buoyant start to the year; the benchmark was up 12% to end-May 2017 and SLS’s NAV was up 21%. On a seasonal basis, he suggests that UK small-cap investors tend to be well served by observing ‘sell in May and go away’. Hence Nimmo has reduced SLS’s gearing by raising cash; the current percentage of net gearing has roughly halved compared to six months ago. While he is positive on the outlook for small caps for the balance of the year as a whole, given their year-to-date performance, current valuations and the somewhat uncertain current macro environment, the manager is a little more cautious in the shorter term. However, his longer-term outlook remains extremely positive. He believes that smaller-cap companies can generate higher returns over the long term compared to larger, more mature companies.
Asset allocation
Investment process: Adherence to six principles
The manager has six principles for successful small-cap investing: look for sustainable growth; go for quality; run your winners; concentrate your efforts (use of the Matrix, see below); management longevity; and value is not everything.
Nimmo seeks to buy the larger companies of tomorrow by investing in quality growth companies with strong management teams. He uses Standard Life Investment’s proprietary stock selection Matrix system to screen the investible universe of c 650 companies, with market caps up to £1.5bn. Factors include earnings growth and estimate revisions, share price momentum, valuation, the level of director dealing, and the Altman Z-score (bankruptcy test). Companies have a Matrix score between -35 and +35; those with a score of -10 to -35 are considered a sell, while those with a score of +10 to +35 are considered a potential buy and undergo rigorous fundamental analysis. The resulting portfolio typically comprises c 60 names and, as a result of bottom-up stock selection, sector weightings can deviate materially from the benchmark. Existing holdings are continually assessed to ensure that their Matrix scores remain attractive. Stocks are sold or reduced if their investment thesis is brought into question, the position size is larger than 5% of the portfolio or if there is a deterioration in the Matrix score. As noted in one of the manager’s six principles, valuation is a secondary consideration; he tends to avoid deep value and ‘blue sky’ investments, which are limited to 5% of the portfolio in aggregate.
Current portfolio positioning
As shown in Exhibit 3, over the last 12 months the manager has increased exposure to relatively smaller-cap companies, although their percentage weighting has also increased due to outperformance. (In recent weeks, the permitted limit in AIM stocks has been increased from 40% to 50%.) Nimmo notes that portfolio turnover over the last year of c 16% is lower than more normal annual levels of 20-22%.
Exhibit 3: Portfolio exposure by market cap (ex-cash and gearing, % unless stated)
Portfolio end-June 2017 |
Portfolio end-June 2016 |
Change (pp) |
|
FTSE 250* |
11.6 |
23.0 |
(11.4) |
Numis Smaller Companies |
45.1 |
39.4 |
5.7 |
AIM |
41.8 |
33.6 |
8.2 |
Non-index |
1.5 |
4.0 |
(2.5) |
100.0 |
100.0 |
Source: Standard Life UK Smaller Companies Trust, Edison Investment Research. Note: *FTSE 250 is mid-cap holdings that are above the threshold for Numis Smaller Companies index.
In terms of sector weightings, over the last 12 months the largest changes are higher exposure in industrials (+7.0pp) and lower exposure in consumer services (-6.0pp). There is still no exposure to the basic materials, oil & gas or the utility sectors. All changes are a result of stock-specific considerations; the manager does not make investment decisions based on macro events. He notes that, for the first time in many years, he is overweight support services. This is a broad sector and the manager tends to focus on the more stable growth, rather than cyclical companies; holdings include Sanne (fund administration), Midwich (a distributor of audio-visual displays) and Diploma (an industrial and healthcare distributor).
Exhibit 4: Portfolio sector exposure (ex-cash and gearing, % unless stated)
Portfolio end-June 2017 |
Portfolio end-June 2016 |
Change (pp) |
|
Industrials |
23.1 |
16.1 |
7.0 |
Consumer services |
21.3 |
27.3 |
(6.0) |
Consumer goods |
16.9 |
12.6 |
4.3 |
Healthcare |
13.5 |
9.9 |
3.6 |
Information technology |
12.7 |
16.4 |
(3.7) |
Financials |
7.3 |
11.5 |
(4.1) |
Telecommunications |
5.2 |
5.2 |
(0.1) |
Basic materials |
0.0 |
1.0 |
(1.0) |
100.0 |
100.0 |
Source: Standard Life UK Smaller Companies Trust, Edison Investment Research
Recent purchases include Eco Animal Health, Gear4music and RWS. Eco Animal Health is an AIM-listed growth stock and one of SLS’s riskier positions, as c 70% of sales are generated from a single product, Aivlosin, which is an antibiotic used in pigs and chickens; growth is being partly driven by increased legislation in the US, which is already in place in Europe and the UK. The product has a very short half-life, breaking down in just one day, which is an important differentiating feature; farmers using traditional antibiotics cannot slaughter an animal if an antibiotic has been used in the past month. Recent sales of Aivlosin beat analysts’ estimates by a large margin. The manager considers that Gear4music, which is the UK’s largest dedicated online retailer of musical instruments and equipment, is very profitable and successful. It sells to customers across a wide age spectrum, has an information-rich website and is making headway in growing its European operations. The manager believes that Amazon would struggle to compete with Gear4music. RWS provides patent translations, intellectual property support services, technical and commercial translations and linguistic validation services. The manager says that due to the high levels of expertise involved, the business would not be easy to replicate. RWS has recently acquired US company LUZ, which strengthens its competitive position in the US; LUZ is one of the largest pure-play life sciences language service providers. RWS is benefiting from an increasing number of patents being registered and from China taking more account of intellectual property rights. Nimmo says RWS has rising earnings estimates and a strong Matrix score.
Over the last six months, SLS has occasionally participated in IPOs, including Alpha Financial Software, which provides software to facilitate trade settlements to asset managers and banks, and Medica, which is a provider of radiologists and radiological services to both the NHS and the private sector. Medica is currently a small, but rapidly growing business driven by the increased use of magnetic resonance imaging (MRI) scans.
Recent sales include Dunelm, EMIS Health and Rightmove. Soft furnishing retailer Dunelm had been in SLS’s portfolio for many years; however, the company now has a poor Matrix score. The manager is concerned that the company is ‘running out of steam’ and he is underwhelmed by its online business. Patient record systems and software provider EMIS Health also has a poor Matrix score. Although the manager believes that it remains a high-quality company, he is concerned that it is no longer beating earnings expectations. He suggests that EMIS is an example of a company diversifying into operations that are not as successful as its core business. Rightmove had been a very successful holding; purchased in 2009, the manager made c 9x his original purchase price. However, the company grew too large to warrant its position in SLS’s smaller company portfolio.
Performance: Very strong performance record
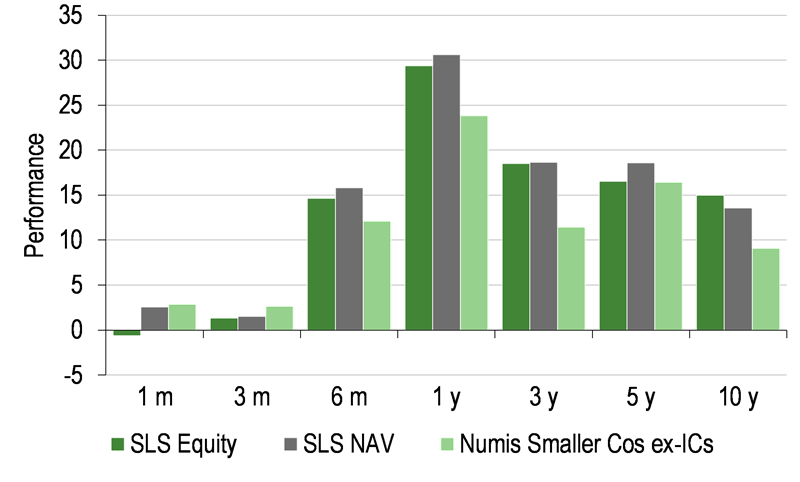
Over one year, UK smaller companies have delivered above-average investment returns. SLS has performed well over this period; its share price and NAV total returns of 29.4% and 30.6% are comfortably ahead of the benchmark’s 23.8% total return. The relative weakness over three months is primarily due to JD Sports, which was SLS’s largest holding. Typically, at its AGM, the company announces an upgraded earnings outlook. This did not happen at the June 2017 AGM; JD Sports’ comments regarding gross margin pressure and the timing of Eid led to significant share price weakness, down by more than 20% during the month. The manager has been in contact with the company, and he believes that its fundamentals remain intact. He considers that the share price fall is an overreaction and is partly as a result of a near-term rotation in the stock market from growth and momentum towards more cyclical stocks. The manager notes that there have been some strong contributors to performance over one year, such as Fevertree Drinks, First Derivatives and Gamma Communications, which reported notably strong results, ahead of expectations.
|
Exhibit 5: Investment trust performance to 31 July 2017 |
|
Price, NAV and benchmark total return performance, one-year rebased |
Price, NAV and benchmark total return performance (%) |
|
|
|
Source: Thomson Datastream, Edison Investment Research. Note: Three, five and 10-year performance figures annualised. |
|
SLS’s relative returns are shown in Exhibit 6; its share price and NAV total returns have outperformed the benchmark in all periods shown of six months or longer. The trust has significantly outperformed the FTSE AIM Index over three, five and 10 years and the FTSE All-Share Index over one, three, five and 10 years.
|
Exhibit 6: Share price and NAV total return performance, relative to indices (%) |
||||||||
|
One month |
Three months |
Six months |
One year |
Three years |
Five years |
10 years |
|
Price relative to Numis Smaller Cos ex-ICs |
(3.4) |
(1.3) |
2.2 |
4.5 |
20.2 |
0.3 |
69.1 |
|
NAV relative to Numis Smaller Cos ex-ICs |
(0.3) |
(1.1) |
3.3 |
5.5 |
20.7 |
9.5 |
49.5 |
|
Price relative to FTSE AIM |
(2.5) |
(1.0) |
2.2 |
(2.0) |
24.6 |
37.6 |
337.4 |
|
NAV relative to FTSE AIM |
0.7 |
(0.9) |
3.3 |
(1.1) |
25.1 |
50.2 |
286.6 |
|
Price relative to FTSE All-Share |
(1.8) |
(1.6) |
7.0 |
12.6 |
32.4 |
30.4 |
129.5 |
|
NAV relative to FTSE All-Share |
1.4 |
(1.4) |
8.2 |
13.7 |
32.9 |
42.3 |
102.9 |
|
|
Source: Thomson Datastream, Edison Investment Research. Note: Data to end-July 2017. Geometric calculation. |
||||||||
|
Exhibit 7: NAV total return performance relative to benchmark over 10 years |
||||||||
|
||||||||
|
Source: Thomson Datastream, Edison Investment Research |
||||||||
Discount: Narrowing trend in recent months
After narrowing for several months, SLS’s discount has widened since mid-July; its current 6.3% share price discount to cum-income NAV is only slightly narrower than the 6.6% average of the last 12 months but remains considerably lower than the average of its peers. Over the past year, the discount has ranged from 2.6% to 11.3%, having registered a five-year high of 11.8% shortly after the result of the UK’s EU referendum in a short period characterised by widespread selling of risk assets. The board actively manages the discount, aiming to keep the discount at or below 8% in normal market conditions. Share repurchases are the preferred method and are supplemented with discretionary six-month tender offers.
|
Exhibit 8: Share price premium/discount to NAV (including income) over three years (%) |
|
|
Source: Thomson Datastream, Edison Investment Research |
Capital structure and fees
SLS currently has 68.3m ordinary shares outstanding following the issue of 0.9m shares in April 2017 on conversion of loan stock. This leaves £13.3m nominal 3.5% convertible unsecured loan stock outstanding. The last conversion date is 31 March 2018; it is expected that all the remaining stock will be converted, as SLS’s share price is comfortably above the 237.2542p conversion price. The board is exploring both long- and short-term debt options, which will allow the manager to continue using gearing to potentially increase investment returns. He is responsible for deciding the level of gearing within a permitted range of 5% net cash to 25% net debt (at the time of drawdown). At end-June 2017, SLS had a net debt position of 2.5%, which compares to a range over the last 10 years of 4.6% net cash to 8.8% net gearing.
Since December 2015, SLS has a tiered management fee structure of 0.85% of gross assets up to £250m and 0.65% above £250m. Its performance fee was removed in 2012. In H117, the ongoing charges were 1.16%, modestly higher than 1.13% in H116.
Dividend policy and record
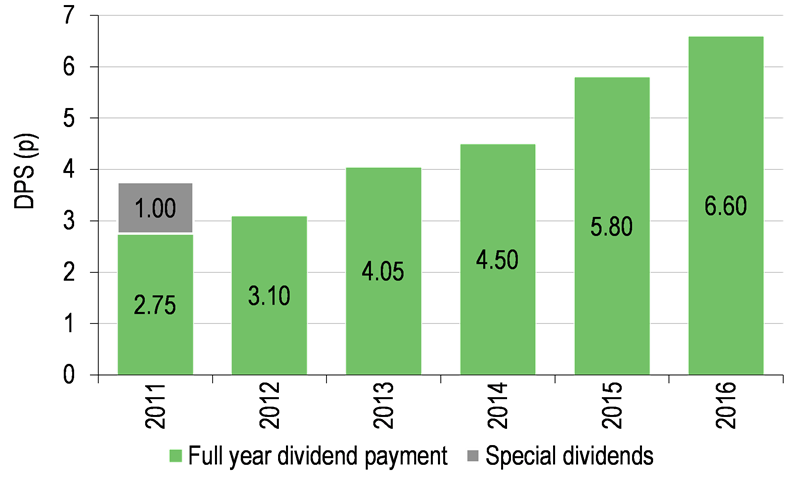
While aiming for long-term capital growth, SLS pays regular dividends twice a year in April and October or November. Over the last 10 years, the annual dividend has compounded at an average annual rate of 23.5%. Given that the annual dividend has grown from a very low base over this period, the manager suggests that the rate of growth in the annual dividend is likely to slow (the FY16 dividend of 6.6p was 13.8% higher than the prior financial year). He cautions that so far in 2017, the value of special dividends paid by SLS’s portfolio companies is significantly lower than the comparable period in 2016 and he has been reducing exposure to some of the higher-yielding companies in the portfolio. However, it should be noted that the 1.5p interim dividend paid in April 2017 was 7.1% higher year-on-year. At end-H117, SLS had revenue reserves of £6.5m (9.5p per share, 1.4x the FY16 annual dividend); its current dividend yield is 1.6%.
Peer group comparison
SLS is a member of the AIC UK Smaller Companies sector. In Exhibit 9 we show the largest 10 funds, which all have a market cap greater than £150m. SLS’s NAV total return is ahead of the peer group weighted average over three and 10 years, ranking third and first out of 10, respectively, while lagging over one and five years. Its discount is the second narrowest in the group, where some of the peers trade at significantly wider discounts. SLS has one of the higher ongoing charges, although no performance fee is payable. It has a below-average level of gearing and its dividend yield is below average, which would be expected for an investment trust with a primary aim of capital growth.
Exhibit 9: Selected peer group as at 3 August 2017*
% unless stated |
Market cap £m |
NAV TR |
NAV TR |
NAV TR |
NAV TR |
Discount (ex-par) |
Ongoing charge |
Perf. |
Net gearing |
Dividend yield (%) |
Standard Life UK Smaller |
294.8 |
30.5 |
66.8 |
127.9 |
261.3 |
(5.5) |
1.2 |
No |
103 |
1.5 |
Aberforth Smaller Companies |
1,225.7 |
33.3 |
38.1 |
136.6 |
129.0 |
(11.4) |
0.8 |
No |
100 |
2.1 |
BlackRock Smaller Companies |
580.6 |
40.5 |
66.6 |
164.4 |
247.9 |
(13.3) |
0.7 |
Yes |
109 |
1.7 |
BlackRock Throgmorton Trust |
320.6 |
40.3 |
71.3 |
158.0 |
179.0 |
(15.4) |
1.1 |
Yes |
126 |
1.9 |
Henderson Smaller Companies |
587.3 |
37.7 |
63.3 |
156.1 |
198.1 |
(13.7) |
0.4 |
Yes |
109 |
2.0 |
Invesco Perpetual UK Smaller |
160.0 |
37.4 |
65.1 |
146.0 |
186.4 |
(5.3) |
0.8 |
Yes |
100 |
3.5 |
JPMorgan Smaller Companies |
164.2 |
31.6 |
40.8 |
121.8 |
109.6 |
(20.0) |
1.2 |
No |
110 |
1.9 |
Montanaro UK Smaller Companies |
180.5 |
24.6 |
35.6 |
69.6 |
124.9 |
(20.3) |
1.2 |
No |
109 |
2.0 |
Rights & Issues Investment Trust |
185.1 |
45.6 |
101.5 |
223.9 |
250.4 |
(10.8) |
0.6 |
No |
100 |
1.4 |
Strategic Equity Capital |
151.0 |
18.9 |
48.5 |
159.2 |
140.7 |
(13.4) |
1.4 |
Yes |
100 |
0.4 |
Weighted average |
35.1 |
55.8 |
146.6 |
179.4 |
(12.5) |
0.8 |
106 |
1.9 |
||
Rank (out of 10 funds) |
5 |
8 |
3 |
8 |
1 |
2 |
3 |
6 |
8 |
Source: Morningstar, Edison Investment Research. Note: *Performance data as at 2 August 2017. TR=total return. Net gearing is total assets less cash and equivalents as a percentage of net assets.
The board
There are currently five directors on the board of SLS; all are non-executive and independent of the manager. Chairman David Woods has announced his intention to retire at the October 2017 AGM, at which time he will have served for more than 12 years; he assumed his current role in February 2014. Woods will be replaced as chairman by Allister Langlands, who was appointed in July 2014. Carol Ferguson was appointed in February 2009 and Caroline Ramsay in August 2016. The newest member of the board is Tim Scholefield, who was appointed in February 2017. He has a background in asset management, most recently as head of equities at Baring Asset Management.
|
|
Investment Companies
Since listing in August 2016 with the issue of £78m in equity, APQ Global has moved quickly but cautiously to deploy the funds. It has initially assembled a highly diversified liquid markets portfolio of predominantly bonds and equities in global emerging markets, including a number of strategic positions, while working on the sourcing of direct investments. APQ is managed by an experienced and incentivised team aiming to deliver a sustainable, progressive dividend with the potential for capital growth from investments in emerging markets.