Is Yatirim Menkul Degerler
Written by
Is Yatirim Menkul Degerler |
Making progress in challenging conditions |
H116 results |
Financial services |
19 September 2016 |
Share price performance
Business description
Next event
Analysts
Is Yatirim Menkul Degerler is a research client of Edison Investment Research Limited |
|||||||||||||||||||||||||||||||||||||||||||||||||||||||||||||||||
The political and economic background in Turkey has been challenging this year but some areas of Is Yatirim Menkul Degerler’s (ISY) investment banking business have seen large increases in activity in the first half and ISY has maintained its leading market positions. The current valuation seems reasonable, but a modest increase in assumed returns would increase the indicated value significantly, suggesting an opportunity for investors looking beyond near-term uncertainties.
Year |
Revenue (TRYm) |
PBT* |
EPS* |
DPS |
P/E |
Yield |
12/14 |
372.4 |
100.5 |
17.7 |
13.2 |
5.8 |
12.9 |
12/15 |
377.5 |
33.7 |
11.4 |
10.0 |
9.0 |
9.7 |
12/16e |
400.5 |
54.3 |
15.8 |
10.0 |
6.5 |
9.7 |
12/17e |
425.1 |
68.1 |
16.8 |
10.0 |
6.1 |
9.7 |
Note: *PBT and EPS are normalised, excluding amortisation of acquired intangibles, exceptional items and share-based payments.
H1 results
ISY’s H116 figures showed strong growth in commission revenues (+31%) but a reduction in interest and trading income (-11%), leaving a net increase in revenue of 5.5%. Commission income was particularly strong in foreign exchange and derivative trading. At the consolidated net profit level, there was an increase of 13% versus H115 to TRY26.2m. Segmentally, the main investment banking activity was 40% ahead of the same period last year and asset management recorded an increase of 23%. Losses in the private equity and non-performing loan management businesses reflected weaker trading in investee companies and a delay in collections, respectively.
Market environment and outlook
The geopolitical background in Turkey has not been easy in recent periods with two general elections in 2015, conflict in neighbouring Syria and Iraq, an influx of refugees, trade restrictions imposed by Russia and, most recently, the attempted coup in July this year. While this is likely to have some continuing effect on the economy, growth has proved resilient and market trading volumes have been strong in some areas. Primary debt issuance has continued to grow although equity IPOs have been muted. Forecasters such as the IMF look for longer-term GDP growth well above the G7 countries at around 3.5%. A period of stability would provide the basis for increased market confidence, increasing the potential for further estimate upgrades for ISY (see page 5 for our estimate changes).
Valuation: Balancing risk and reward
In a comparison with European investment banks ISY scores well in terms of P/E and return on equity (ROE) and is on a par on price to book value (P/BV). However, using a ROE/COE model, including an assumed ROE of 10%, the current share price appears close to a central value. Positively, increasing the ROE assumption by 1%, easily supported in a more favourable economic climate, would raise the indicated value by 19%.
Company description
Established in 1996, Is Yatirim Menkul Degerler (ISY) is part of the Isbank group which is the largest private bank in Turkey; with its affiliates, it owns just over 70% of ISY shares. ISY benefits from Isbank’s distribution network and standing among the Turkish business community. ISY’s core investment banking division has leading market shares in many aspects of investment banking in Turkey. It is also active in equity IPOs, bond issue, asset management, non-performing loan management and private equity.
Turkish financial markets this year
The background for Turkish financial markets has been challenging, with political uncertainty including a coup attempt (mid-July) and the presence of regional risks, including troubled neighbours Syria and Iraq. While these have been unhelpful influences for the economy there was positive news at the end of June when Russia announced the progressive removal of its sanctions (following the shooting down of a Russian military jet by Turkish forces in November 2015). In the circumstances, Turkey’s Borsa Istanbul 100 index (BIST 100) has been surprisingly resilient; it is up nearly 9% year to date and down less than 6% since the coup attempt (Exhibit 1).
|
Exhibit 1: BIST 100 index, year to date |
Exhibit 2: BIST 100 index, last 10 years |
|
|
|
Source: Bloomberg. Note: to 7 September. |
Source: Bloomberg |
|
Exhibit 1: BIST 100 index, year to date |
|
|
Source: Bloomberg. Note: to 7 September. |
|
Exhibit 2: BIST 100 index, last 10 years |
|
|
Source: Bloomberg |
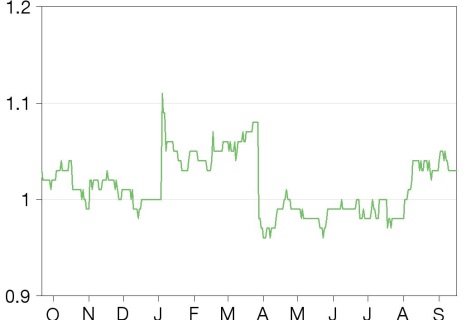
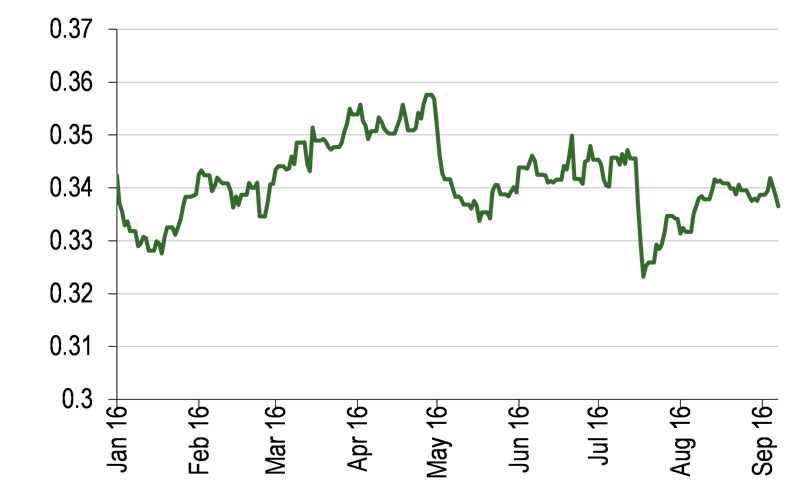
Similarly, the exchange rate (Exhibit 3) has displayed relative stability and the two-year government bond yield (Exhibit 4) has fallen since the beginning of the year despite a spike up following the attempted coup.
|
Exhibit 3: Turkish lira vs US$, ytd |
Exhibit 4: Two-year Turkish govt. bond yield, ytd (%) |
|
|
|
Source: Bloomberg. Note: to 7 September. |
|
Exhibit 3: Turkish lira vs US$, ytd |
|
|
Source: Bloomberg. Note: to 7 September. |
|
Exhibit 4: Two-year Turkish govt. bond yield, ytd (%) |
|
|
Source: Bloomberg. Note: to 7 September. |
While central bank measures to ease liquidity and support the economy have played a role, these market indicators can also be seen as demonstrating a degree of confidence in the longer-term prospects for the economy and market despite continuing challenges.
In terms of the economy it is worth recalling that Turkey recorded compound annual growth of 3.8% between 2006 and 2015 compared with 1.1% for G7 economies, while prospectively the IMF has been looking for GDP growth of approximately 3.5% for the years to 2021. Near-term estimates may be trimmed, but longer-term growth expectations seem likely to be broadly maintained.
Next we look at trading and issuance activity levels. Exhibit 5 shows the evolution of daily values traded on the equity and derivative markets. While both have shown considerable variation, levels have increased over the period shown; equity trading is marginally ahead and derivative trading is up 7% in the first eight months of this year compared with the same period last year.
|
Exhibit 5: Equity and derivative markets value traded |
|
|
Source: Borsa Istanbul, Edison Investment Research. Note: Indices are based on average daily TRY values. |
The final two charts in this section show the level of equity and debt issuance since 2006 and 2010 respectively. Equity issuance has been trending down in recent years with increasing economic and political uncertainty following a post-crisis surge. In contrast, there has been no slackening in the growth in debt issues with the run rate year to date ahead of the same period in 2015.
|
Exhibit 6: Turkish equity IPOs (number) |
Exhibit 7: Turkish debt instrument issuance (number) |
|
|
|
Source: Borsa Istanbul |
|
Exhibit 6: Turkish equity IPOs (number) |
|
|
Source: Borsa Istanbul |
|
Exhibit 7: Turkish debt instrument issuance (number) |
|
|
Source: Borsa Istanbul |
Looking ahead, a period of greater political stability and a normalisation of conditions in the wake of the coup attempt would create more favourable conditions for foreign investment and longer-term economic growth. This would in turn potentially provide an increasingly favourable background for ISY’s investment banking activities.
H116 results
We start with the performance data by market area for IS Investment (Exhibit 8); here, the largest percentage change between H115 and H116 was in the volume of foreign exchange (FX) margin trading where strong market growth was magnified by an increase in IS Investment’s market share from 6.2% to 7.2%. Within primary issuance, debt securities issuance was up 23% and IS Investment retains a leading market share, also at 23%. The number of M&A deals completed remained muted at five versus four last year, reflecting a difficult economic background. While the level of lending for equity margin trading declined 15%, the company reports that profitability here improved. Finally, in asset management overall assets under management (AUM) increased 17% including a particularly strong increase in pension funds (+35%).
Exhibit 8: Performance by market area
H115 |
H116 |
% change |
% market share |
Rank |
|
FX margin trading (TRY bn) |
466.2 |
715.7 |
+53.5 |
7.2 |
6 |
Debt securities issuance (TRY bn) |
8.2 |
10.1 |
+23.2 |
23.0 |
1 |
M&A deals closed (number) |
4 |
5 |
+25.0 |
||
Equity margin trading (TRY m) |
306 |
259 |
-15.4 |
||
Assets under management (TRY bn) |
19.8 |
23.2 |
+17.2 |
||
of which: |
|||||
Mutual funds |
9 |
9.5 |
+5.6 |
23.0 |
|
Pension funds |
7.4 |
10 |
+35.1 |
18.3 |
|
Other funds |
3.4 |
3.7 |
+8.8 |
Source: IS Investment, Edison Investment Research
An analysis of revenues is shown in Exhibit 9. Commission revenues were notably strong (+31% YoY), while there was a decline in interest and trading income. Within commission revenues brokerage saw an increase of over 40% including marked strength in derivative, equity and FX commissions. Corporate finance also showed robust growth with M&A reported as a good contributor despite the still small number of transactions completed, as noted above. Overall revenues increased by 5.5%.
Exhibit 9: Revenue analysis
TRYm except where stated |
H115 |
H116 |
% change |
% of total |
Interest and trading income |
119.6 |
106.0 |
-11.3 |
50.5 |
Commission revenues |
79.5 |
104.0 |
+30.9 |
49.5 |
of which: |
||||
Brokerage |
51.1 |
72.0 |
+40.8 |
34.3 |
Corporate finance |
10.0 |
12.9 |
+29.3 |
6.1 |
Asset management |
17.4 |
17.7 |
+1.7 |
8.4 |
Other commissions |
1.0 |
1.5 |
+42.4 |
0.7 |
Total revenue |
199.1 |
210.0 |
+5.5 |
100.0 |
Source: IS Investment, Edison Investment Research
Costs increased by nearly 17%, with volume-related costs, higher exchange transaction fees and costs denominated in foreign currencies all contributing to the increase. As a result, the cost income ratio increased from 73% to 81%.
Exhibit 10: Cost analysis
TRYm |
H115 |
H116 |
% change |
% of total |
Marketing sales and distribution |
35.8 |
47.7 |
+33.4 |
28.0 |
General administration |
108.2 |
121.0 |
+11.8 |
71.1 |
Other operating expenses |
1.9 |
1.6 |
-18.7 |
0.9 |
Operating expenses |
145.9 |
170.2 |
+16.7 |
100.0 |
% of revenue |
73 |
81 |
Source: IS Investment, Edison Investment Research
In Exhibit 11 we show the contribution to net profit by segment, summing to consolidated net profits of TRY26.2m, up 13% on H115.
Exhibit 11: Segmental analysis of consolidated net profit
TRYm |
H115 |
H116 |
Year-on-year % change |
IS Investment (100%)* |
34.2 |
47.8 |
40 |
IS Investment Trust (28.9%) |
0.8 |
2.8 |
|
IS Private Equity (29.1%) |
(1.8) |
(4.9) |
|
IS Asset Management (70%) |
4.3 |
5.2 |
23 |
Efes NPL Asset Management (74%) |
4.2 |
(5.7) |
|
Elimination Adjustments |
(18.5) |
(19.0) |
|
Consolidated net profits |
23.2 |
26.2 |
13 |
Source: Is Investment. Note: *Parent company only, percentages in brackets show ISY ownership at 30 June 2016.
The main business, IS Investment, recorded a 40% increase in net profit from the same period last year and achieved an ROE of 12.5% (group ROE was 8.0% compared with 10.1%). This result would have been significantly higher without a TRY17m corporate bond write-off. IS Private Equity saw an increase in the net loss as a result of weak results from its investee companies (which are consolidated by ISY), reflecting the tough trading background and the fact that these companies are mainly in the investment phase. IS Asset Management’s profit increased by 23%. At Efes NPL Asset Management there has been a pause in collections pending the outcome of court proceedings: once resolved, the result for this business is expected to improve. The elimination items largely relate to the investment trust and asset management businesses.
Changes to estimates
We show the changes in our estimates below reflecting the performance in the first half together with updated assumptions. These include the company’s expectation of continued improvement in Asset Management profitability and a higher estimated loss for IS Private Equity than previously. An increase in the expected minority loss within our estimates (increasing equity shareholders’ earnings all else equal) contributes to a greater attributable profit and EPS increase than we had estimated previously.
Exhibit 12: Estimate revisions
|
Revenue (TRYm) |
Attributable profit (TRYm) |
EPS (Kr) |
DPS (Kr) |
||||||||
|
Old |
New |
% chg |
Old |
New |
% chg |
Old |
New |
% chg |
Old |
New |
% chg |
12/16e |
401.7 |
400.5 |
0% |
45.8 |
56.1 |
22% |
12.9 |
15.8 |
22% |
10.0 |
10.0 |
0% |
12/17e |
428.6 |
425.1 |
-1% |
53.9 |
59.6 |
11% |
15.2 |
16.8 |
10% |
10.0 |
10.0 |
0% |
Source: Edison Investment Research
Valuation
While there are no directly comparable quoted investment banks given ISY’s business and geographical profile, we put the company in the context of a group of European banks that have significant investment banking businesses (Exhibit 13). ISY has a considerably higher yield, trades on much lower P/E, and on a comparable P/B multiple despite earning a much higher ROE (c 10% on our estimates). This suggests ISY is relatively undervalued, although currency risk should be borne in mind.
We can examine this comparison further by using a rearranged ROE/COE model to calculate an estimate of the risk premium investors ascribe to ISY, assuming a ROE of approximately 10% and growth of 5%. This gives a COE of 12.7% for ISY, versus 6.7% for the European banks on average (using a 4% growth assumption). While the ISY COE derived in this way appears relatively high, it is consistent with the market level of the Turkish 10-year government bond (9.76%), a calculation of the equity risk premium for Turkey (6.8%) and the beta for ISY of 0.48 (both from Bloomberg). This suggests the current share price is close to a central valuation based on a ROE/COE model. However, we note the sensitivity of the valuation to changing assumptions for the ROE, growth rate or risk free rate. Positive moves could arise from internal measures at ISY or an improvement in the economic environment prompting a higher sustainable ROE input: increasing the ROE assumption to 11%, for example, would give a warranted price to book multiple of 0.75 and an indicated value 19% above the current share price (TRY1.23).
Exhibit 13: Peer valuation
P/E |
P/BV |
Dividend yield (%) |
Return on equity (%) |
Return on assets (%) |
||||||
2016e |
2017e |
2016e |
2017e |
2016e |
2017e |
2016e |
2017e |
2016e |
2017e |
|
Is Yatirim |
6.5 |
6.1 |
0.6 |
0.6 |
9.7 |
9.7 |
9.7 |
9.9 |
1.0 |
1.0 |
Average |
18.9 |
9.3 |
0.6 |
0.5 |
3.9 |
4.3 |
3.8 |
5.6 |
0.2 |
0.3 |
BNP Paribas |
7.8 |
7.8 |
0.6 |
0.6 |
5.8 |
5.8 |
8.1 |
7.9 |
0.4 |
0.4 |
UBS |
12.4 |
10.3 |
0.9 |
0.9 |
4.4 |
5.2 |
7.0 |
8.4 |
0.4 |
0.5 |
Credit Suisse Group |
36.7 |
12.8 |
0.6 |
0.6 |
4.9 |
4.6 |
0.0 |
3.9 |
0.1 |
0.2 |
Société Générale |
7.7 |
7.5 |
0.5 |
0.5 |
6.7 |
6.3 |
6.1 |
6.2 |
0.2 |
0.2 |
Barclays |
15.1 |
9.9 |
0.5 |
0.5 |
1.8 |
1.8 |
2.6 |
4.4 |
0.1 |
0.5 |
Deutsche Bank |
33.8 |
7.6 |
0.3 |
0.3 |
0.0 |
2.2 |
-1.2 |
2.8 |
0.0 |
0.1 |
Source: ISY, Bloomberg. Note: Prices as at 16 September 2016.
Exhibit 14: Financial summary
TRY'm |
2014 |
2015 |
2016e |
2017e |
||
Year end 31 December |
IFRS |
IFRS |
IFRS |
IFRS |
||
PROFIT & LOSS |
||||||
Total revenue |
|
|
372.4 |
377.5 |
400.5 |
425.1 |
Operating expenses |
(-266.5) |
(-314.5) |
(329.2) |
(333.6) |
||
Other income/expense (net) |
(-2.1) |
(-8.5) |
(12.4) |
(6.9) |
||
Operating profit |
|
|
103.8 |
54.6 |
58.9 |
84.6 |
Share of profit of equity accounted investees |
(-0.3) |
(-0.7) |
(6.0) |
(6.0) |
||
Net financials |
(-3.0) |
(-20.1) |
1.4 |
(10.5) |
||
Exceptionals |
0.0 |
0.0 |
0.0 |
0.0 |
||
Profit Before Tax (norm) |
|
|
100.5 |
33.7 |
54.3 |
68.1 |
Profit Before Tax (FRS) |
|
|
100.5 |
33.7 |
54.3 |
68.1 |
Tax |
(-7.9) |
(-11.3) |
(13.6) |
(13.9) |
||
Profit After Tax (norm) |
|
|
92.6 |
22.4 |
40.7 |
54.2 |
Profit After Tax (FRS) |
|
|
92.6 |
22.4 |
40.7 |
54.2 |
Minority interest |
29.7 |
(-18.1) |
(-15.4) |
(-5.4) |
||
Net income (norm) |
|
|
62.9 |
40.5 |
56.1 |
59.6 |
Net income (FRS) |
|
|
62.9 |
40.5 |
56.1 |
59.6 |
Average Number of Shares Outstanding (m) |
355.0 |
355.0 |
355 |
355 |
||
EPS - normalised fully diluted (kr) |
|
|
17.7 |
11.4 |
15.8 |
16.8 |
EPS - IFRS (kr) |
|
|
17.7 |
11.4 |
15.8 |
16.8 |
Dividend per share (Kr) |
13.24 |
10.00 |
10.00 |
10.00 |
||
By Operating entity |
|
|
|
|
|
|
IS Investment Only |
44.7 |
48.3 |
71.8 |
58.2 |
||
IS Investment Trust (28.9%) |
7.6 |
1.7 |
5.7 |
7.0 |
||
IS Private Equity (29.1%) |
2.2 |
(7.3) |
(8.6) |
(8.1) |
||
IS Asset Management (70.0%) |
7.9 |
9.2 |
11.9 |
12.9 |
||
Efes NPL Asset Management (74%) |
16.6 |
12.9 |
(5.7) |
8.4 |
||
Elimination Adjustments (B) |
(15.5) |
(18.6) |
(19.0) |
(18.8) |
||
Foreign based subsidiaries |
(0.6) |
(5.7) |
0.0 |
0.0 |
||
Net income |
|
|
62.9 |
40.5 |
56.1 |
59.6 |
BALANCE SHEET |
||||||
Fixed Assets |
|
|
168.8 |
194.8 |
195.0 |
195.0 |
Intangible Assets |
61.2 |
61.4 |
61.0 |
61.0 |
||
Tangible Assets |
34.8 |
32.8 |
33.0 |
33.0 |
||
Other |
72.7 |
100.6 |
101.0 |
101.0 |
||
Current Assets |
|
|
5,186.4 |
5,586.4 |
5,620.0 |
5,620.0 |
Investments |
708.6 |
768.4 |
750.0 |
750.0 |
||
Trade receivables |
1,380.8 |
1,815.0 |
1,850.0 |
1,850.0 |
||
Cash and equivalents |
2,907.0 |
2,733.8 |
2,750.0 |
2,750.0 |
||
Other |
189.9 |
269.2 |
270.0 |
270.0 |
||
Total Assets |
|
|
5,355.1 |
5,781.2 |
5,815.0 |
5,815.0 |
Current Liabilities |
|
|
(4,295.0) |
(4,697.5) |
(4,725.6) |
(4,706.9) |
Short term borrowings |
(3,140.1) |
(3,177.6) |
(3,200.0) |
(3,200.0) |
||
Trade payables |
(981.2) |
(1,337.3) |
(1,350.0) |
(1,350.0) |
||
Other |
(173.7) |
(182.7) |
(175.6) |
(156.9) |
||
Long Term Liabilities |
|
|
(102.2) |
(175.5) |
(176.0) |
(176.0) |
Long term borrowings |
(90.1) |
(140.6) |
(141.0) |
(141.0) |
||
Other long term liabilities |
(12.1) |
(34.9) |
(35.0) |
(35.0) |
||
Total Liabilities |
|
|
(4,397.2) |
(4,873.0) |
(4,901.6) |
(4,882.9) |
Equity attributable to ordinary shareholders |
|
|
557.3 |
558.2 |
578.7 |
602.8 |
Minority interest |
|
|
400.6 |
350.0 |
334.7 |
329.3 |
Total shareholders' equity |
|
|
958.0 |
908.2 |
913.4 |
932.1 |
Number of shares at year end (m) |
|
|
355 |
355 |
355 |
355 |
NAV per share |
|
|
1.57 |
1.57 |
1.63 |
1.70 |
ROE |
|
|
11.3% |
7.3% |
9.7% |
9.9% |
ROA |
1.2% |
0.7% |
1.0% |
1.0% |
||
Cost/income ratio |
71.6% |
83.3% |
82.2% |
78.5% |
||
Tangible Equity/Assets |
17% |
15% |
15% |
15% |
||
Tax rate |
8% |
34% |
25% |
20% |
Source: ISY, Edison Investment Research
|
|