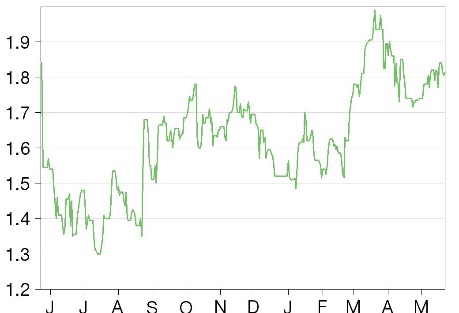
The recent investor day confirmed the opportunities we see for ERM Power from an evolving energy market, which we expect will create medium-term growth potential especially for the Energy Solutions business. In the meantime, investors will benefit from strong forecasted cash flow generation, with total free cash flow over the period FY19–21 equivalent to c 40% of the current market cap. We expect this to be allocated in a balanced way between shareholders’ remuneration and growth capex.
Written by
ERM Power |
Investor day confirms structural growth trends |
Update post investor day |
Utilities |
23 May 2019 |
Share price performance
Business description
Next events
Analyst
ERM PowerERM Power is a research client of Edison Investment Research Limited |
|||||||||||||||||||||||||||||||||||||||||||||
The recent investor day confirmed the opportunities we see for ERM Power from an evolving energy market, which we expect will create medium-term growth potential especially for the Energy Solutions business. In the meantime, investors will benefit from strong forecasted cash flow generation, with total free cash flow over the period FY19–21 equivalent to c 40% of the current market cap. We expect this to be allocated in a balanced way between shareholders’ remuneration and growth capex.
Year end |
EBITDA (A$m) |
PBT* |
EPS* |
DPS |
P/E |
Yield |
06/17 |
78.4 |
14.7 |
(10.5) |
7.0 |
N/A |
3.8 |
06/18 |
97.5 |
43.1 |
12.0 |
7.5 |
15.3 |
4.1 |
06/19e |
90.6 |
35.4 |
10.1 |
12.0 |
18.0 |
6.5 |
06/20e |
105.6 |
50.3 |
14.5 |
12.0 |
12.7 |
6.5 |
Note: *PBT and EPS are normalised, excluding amortisation of acquired intangibles, exceptional items and share-based payments.
Structural growth trends confirmed
The investor day presentation focused on the impact of the structural growth trends on ERM Power’s activities, including the development of Energy Solutions and the opportunities for power generation activities as a result of the energy transition. We maintain our view that the Energy Solutions business has the potential to develop to a sizeable business, with the mid-case of our sensitivity analysis suggesting the business can generate c 20% of group EBITDA in the medium term. In addition, we believe the high flexibility of ERM Power’s generation assets is likely to benefit from increasing price volatility and increasing volumes.
Strong cash flow generation provides opportunities
In our view, a key attractiveness is the strong cash flow generation. Over the three years FY19–21 we estimate ERM will generate total free cash flow (FCF) equivalent to c 40% of the current market cap. We expect this cash flow will be used in a balanced way for shareholder remuneration and growth initiatives. We estimate total dividends and share buyback over FY19–21 equivalent to 21% of the current market cap (assuming a special dividend in FY20 and growth in ordinary dividends thereafter). ERM Power will report FY result at the end of August; we will mainly focus on the guidance for Energy Solutions and Retail as well as an update on capital allocation. Our forecasts are broadly aligned with Refinitiv consensus for FY19 (our EBITDA is 1% higher), while we see c 10% upside to consensus EBITDA for FY20–21 as we factor in growth in Energy Solutions and Electricity Retail.
Valuation: Undemanding despite recent recovery
Despite the recent share price recovery (+17% ytd), the valuation is attractive with the stock trading at undemanding earnings multiples (c 13–11x P/E in FY20–21, excluding a one-off contribution from the LGC sale) and robust cash flow generation with FCF yield of 14% a year on average in FY19–21. The dividend yield is 6.5% in FY19–20 (including the special dividend, 4.9% based on ordinary dividend only). Our SOTP valuation of A$2.4/share (A$2.8/share including a valuation for Energy Solutions) and our forecasts are unchanged.
Evolving market creates opportunities
The recent investor day confirmed the opportunities we see for ERM Power from an evolving Australian energy market. In particular, we believe that delivery of growth for the Energy Solutions business would provide evidence of the growth potential of the company and would result in a strong catalyst for a re-rating on higher multiples.
Investor day focuses on opportunities from energy transition
ERM Power held an investor day on 14 May, which provided an update on its activities, strategy and growth opportunities. The presentation focused on the impact of energy transition on ERM Power’s activities and the implications for its power generation, energy retail and energy solutions businesses. Overall, we believe the growth trends identified by the company are consistent with our forecasts and growth outlook for the company. We provide more details below.
■
Energy Retail and Energy Solutions: With the emergence of new technologies, and the need to increase energy efficiency and adopt more sustainable solutions, sophisticated commercial and industrial (C&I) customers, which represent the core business of ERM Power, increasingly require a comprehensive energy service in addition to the delivery of the physical commodity. In its investor day presentation, ERM Power has highlighted that for a typical C&I customer paying A$150/MWh for its electricity, Energy Solutions can secure net benefits ranging from A$8/MWh to A$20/MWh (A$30/MWh, or 20% of their costs, before capital costs associated with the required investment). While, according to ERM Power, the company may lose part of its Electricity Retail margin (20% or A$1/MWh out of c A$5/MWh) as a result of the lower customer consumption, the company is likely to achieve a significant net increase in profits thanks to the sharing with the customer of the A$8–20/MWh saving. Energy Solutions is at an early stage of development and we have previously estimated the potential for this business. We set out the up-to-date analysis in Exhibit 1, which shows that in a mid-case this business development could drive significant growth, with 21% growth in group EBITDA in the medium term (vs FY22e). Our published forecasts currently assume the mid-case EBITDA is achieved in FY24.
Exhibit 1: Energy Solutions – medium-term EBITDA potential
Addressable mkt size |
A$m |
1,000 |
||||||||
Mkt share |
% |
5% |
13% |
20% |
||||||
Revenue |
A$m |
50 |
125 |
200 |
||||||
Gross profit margin |
% |
30% |
40% |
50% |
30% |
40% |
50% |
30% |
40% |
50% |
Gross profit |
A$m |
15 |
20 |
25 |
37.5 |
50 |
62.5 |
60 |
80 |
100 |
Opex |
A$m |
20 |
20 |
20 |
25 |
25 |
25 |
30 |
30 |
30 |
EBITDA |
A$m |
-5 |
0 |
5 |
12.5 |
25 |
37.5 |
30 |
50 |
70 |
% of 2022e group EBITDA |
% |
-4% |
0% |
4% |
10% |
21% |
31% |
25% |
41% |
58% |
Source: Edison Investment Research
■
Power generation: ERM Power sees long-term opportunities for its power generation portfolio, which is expected to benefit from the evolving market conditions thanks to its flexibility. The Neerabup and Oakey Power plants are open-cycle gas turbine (OCGT) plants, with total installed capacity of 662MW (of which ERM Power has 497MW equity ownership) generating c 40% of FY19 group EBIT, on our estimates. ERM Power’s generation assets are highly flexible, with high availability and fast start times, which should allow the company to capture the opportunities from increasing volatility in wholesale electricity prices as a result of growing renewable installed capacity (wind and solar are intermittent sources of generation) and from reducing production from coal-fired plants (regulation and ageing plants are likely to result in significant closures). In particular, Oakey is very exposed to this trend as it is 100% merchant, while Neerabup has more limited exposure to merchant activities.
Although the regulatory environment remains uncertain, on our estimates, by FY35 c 70% of Australia’s current coal-fired power plant capacity will have reached 50 years of age. In our view, the levels of investment needed to continue to generate, combined with likely stricter environmental regulations in the longer term, are unlikely to allow the operation of the plants beyond this limit.
We currently assume a moderate increase in profits for this business, with a 2% EBITDA CAGR FY19–22 but see risks to our forecasts as skewed to the upside.
Three-year cash flow equivalent to c 40% of market cap
We forecast strong cash flow generation with an average FCF yield of 14% in FY19–21. The strong cash flow generation is driven by healthy margins in the supply and power-generation activities and one-off cash inflow from the sale of its portfolio of large-scale generation certificates (LGC). We estimate total A$190m free cash flow in FY19–21, before M&A and growth capex, equivalent to 41% of the current market cap. On top of this, A$37m was raised at the end of 2018 with the disposal of the US business. We expect this cash flow will be used in a balanced way for shareholder remuneration and growth initiatives. We estimate total dividends and share buyback over the period of A$99m, equivalent to 21% of the current market cap (assuming a special dividend in FY20 and growth in ordinary dividends thereafter). On our estimates, the free cash flow yield will easily cover the high dividend yield (Exhibit 2). In addition, the company has announced that A$60m has been reserved for growth initiatives (not included in our forecasts); we expect this will be used mainly for acquisitions by the Energy Solutions business. As shown in Exhibit 3, the cash flow generation we forecast is higher than expected cash flow utilisation, which leaves more room for dividends and/or growth capex, also considering the strong financial structure of the company (net cash at H119).
|
Exhibit 2: FCF yield vs. dividend yield for ERM Power |
Exhibit 3: FY19-FY21e cash flow generation/ utilisation |
|
|
|
Source: Edison Investment Research |
|
Exhibit 2: FCF yield vs. dividend yield for ERM Power |
|
|
Source: Edison Investment Research |
|
Exhibit 3: FY19-FY21e cash flow generation/ utilisation |
|
|
Source: Edison Investment Research |
As sensitivity, a A$1/MWh increase or decrease in Electricity Retail gross margin per unit sold (equivalent to c 20% of current margin) would increase or decrease group FCF yield by c 2.5 percentage points. As a result, FCF yield would comfortably cover the dividend yield even with a rather large reduction in retail margins.
What to focus on at the FY19 results
ERM Power will report full year results at the end of August. At H1 results in February the company sent a strong signal of confidence with the announcement of a c 30% dividend hike (from 7c to 9c), the introduction of an additional special dividend of A$0.03/share for FY19 (another special dividend will be considered for FY20, with an update by the H120 results), A$60m reserved for growth investments, a c 10% higher medium-term outlook for margins per MWh for its core Electricity Retail business (from a range of A$4.00–5.50/MWh to A$4.50–6.00/MWh). The only slightly negative trend was that the FY19 outlook for the Energy Solutions business was confirmed despite the contribution from the recent acquisition of Out Performers.
Following the positive update at H1 results, at the FY results we will focus on the outlook for:
■
Electricity Retailing: ERM Power guided for A$5.1/MWh unitary gross margin for FY19 and A$4.50–6.00/MWh (FY20–21). We expect narrower guidance for FY20 and we currently assume a A$5.25/MWh gross margin and a small pick-up in volumes (18.8TWh, +4% y-o-y), based on growing forward sales disclosed at H1.
■
Energy Solutions: at H1 ERM Power confirmed the FY20 target of a positive net income contribution. We currently assume a €1m positive net income contribution in FY20 (vs negative €3m in FY19).
■
Power generation: we forecast a A$16m EBITDA for Oakey and A$27m for Neerabup in FY20.
■
Capital allocation: we expect more details on the A$60m reserved for organic and inorganic growth investments and an update on the A$15m share buyback programme. In addition, we will also look for signals on whether the A$0.03/share special dividend will be repeated in FY20, although the company is more likely to wait to confirm this until it has more visibility at H120 results.
Valuation: Attractive FCF and dividend yields
In our view, the valuation for ERM Power remains compelling, despite the recent share price recovery (+17% ytd). The stock trades at undemanding earnings multiples (c 13–11x P/E in FY20–21, excluding a one-off contribution from the LGC sale). The cash flow generation is robust with a FCF yield of 14% a year on average in FY19–21, which is attractive also considering that a good portion of the cash flow is paid in dividends: the dividend yield is 6.5% if FY19–20 (including the special dividend, 4.9% based on ordinary dividend only).
Excluding Energy Solutions (which is loss making and generating negative cash flow), our base case valuation is unchanged at A$2.4/share (based on a DCF-based SOTP valuation with an 11% WACC). Including a valuation for the Energy Solutions business, which has not yet reached break-even but has strong growth prospects in our view, would increase the SOTP valuation to A$2.8/share based on a multiples valuation.
Key risks to our valuation and investment case are higher or lower supply and power-generation margins in Australia and higher or lower growth in Energy Solutions.
Exhibit 4: Financial summary
Accounts: IFRS; year end 30 June; A$m |
2016 |
2017 |
2018 |
2019e |
2020e |
2021e |
INCOME STATEMENT |
|
|
|
|
|
|
Total revenues |
2,691 |
3,127 |
2,047 |
1,966 |
2,047 |
2,078 |
Cost of sales |
(2,620) |
(3,049) |
(1,950) |
(1,876) |
(1,941) |
(1,963) |
Gross profit |
71 |
78 |
98 |
91 |
106 |
115 |
SG&A (expenses) |
0 |
0 |
0 |
0 |
0 |
0 |
R&D costs |
0 |
0 |
0 |
0 |
0 |
0 |
Other income/(expense) |
0 |
0 |
0 |
0 |
0 |
0 |
Exceptionals and adjustments |
(5) |
0 |
0 |
0 |
0 |
0 |
Depreciation and amortisation |
(25) |
(38) |
(30) |
(29) |
(30) |
(31) |
Reported EBIT |
40 |
41 |
67 |
62 |
76 |
84 |
Finance income/(expense) |
(23) |
(26) |
(24) |
(26) |
(26) |
(25) |
Other income/(expense) |
0 |
(0) |
0 |
0 |
0 |
0 |
Exceptionals and adjustments |
39 |
36 |
(34) |
8 |
21 |
0 |
Reported PBT |
57 |
51 |
9 |
44 |
71 |
59 |
Income tax expense (includes exceptionals) |
(22) |
(52) |
(90) |
(11) |
(15) |
(17) |
Reported net income |
36 |
(1) |
(81) |
33 |
56 |
41 |
Basic average number of shares, m |
242 |
244 |
244 |
240 |
237 |
237 |
Basic EPS (A$) |
0.15 |
(0.00) |
(0.33) |
0.14 |
0.24 |
0.17 |
DPS (A$) |
0.120 |
0.070 |
0.075 |
0.120 |
0.120 |
0.100 |
|
|
|
|
|
|
|
Adjusted EBITDA |
71 |
78 |
98 |
91 |
106 |
115 |
Adjusted EBIT |
46 |
41 |
67 |
62 |
76 |
84 |
Adjusted PBT |
23 |
15 |
43 |
35 |
50 |
59 |
Adjusted EPS (A$) |
0.08 |
(0.11) |
0.12 |
0.10 |
0.15 |
0.17 |
Adjusted diluted EPS (A$) |
0.08 |
(0.10) |
0.12 |
0.10 |
0.14 |
0.17 |
|
|
|
|
|
|
|
BALANCE SHEET |
|
|
|
|
|
|
Property, plant and equipment |
391 |
391 |
391 |
358 |
350 |
341 |
Goodwill |
0 |
0 |
0 |
0 |
0 |
0 |
Intangible assets |
79 |
89 |
38 |
38 |
38 |
38 |
Other non-current assets |
59 |
116 |
43 |
43 |
43 |
43 |
Total non-current assets |
529 |
597 |
473 |
440 |
432 |
423 |
Cash and equivalents |
192 |
245 |
228 |
282 |
317 |
340 |
Inventories |
22 |
42 |
82 |
79 |
82 |
83 |
Trade and other receivables |
331 |
361 |
320 |
323 |
336 |
341 |
Other current assets |
164 |
331 |
258 |
106 |
106 |
106 |
Total current assets |
709 |
979 |
888 |
789 |
841 |
870 |
Non-current loans and borrowings |
184 |
181 |
177 |
177 |
177 |
177 |
Other non-current liabilities |
161 |
287 |
160 |
168 |
168 |
168 |
Total non-current liabilities |
345 |
467 |
337 |
344 |
344 |
344 |
Trade and other payables |
367 |
464 |
424 |
448 |
464 |
469 |
Current loans and borrowings |
37 |
8 |
160 |
160 |
160 |
160 |
Other current liabilities |
18 |
70 |
191 |
39 |
39 |
39 |
Total current liabilities |
422 |
543 |
774 |
647 |
662 |
667 |
Equity attributable to company |
471 |
566 |
250 |
238 |
266 |
281 |
Non-controlling interest |
0 |
0 |
0 |
0 |
0 |
0 |
|
|
|
|
|
|
|
CASH FLOW STATEMENT |
|
|
|
|
|
|
EBIT |
40 |
41 |
67 |
62 |
76 |
84 |
Depreciation and amortisation |
16 |
53 |
32 |
29 |
30 |
31 |
Share based payments |
0 |
0 |
0 |
0 |
0 |
0 |
Other adjustments |
60 |
69 |
(119) |
0 |
0 |
0 |
Movements in working capital |
0 |
0 |
0 |
25 |
(1) |
(1) |
Interest paid / received |
3 |
3 |
3 |
3 |
4 |
5 |
Income taxes paid |
(0) |
(14) |
(27) |
(11) |
(15) |
(17) |
Cash from operations (CFO) |
120 |
152 |
(43) |
109 |
94 |
101 |
Capex |
(26) |
(40) |
(49) |
(21) |
(20) |
(20) |
Acquisitions & disposals net |
12 |
26 |
6 |
25 |
(2) |
(2) |
Other investing activities |
(9) |
(6) |
(0) |
0 |
0 |
0 |
Cash used in investing activities (CFIA) |
(24) |
(20) |
(44) |
4 |
(22) |
(22) |
Net proceeds from issue of shares |
0 |
0 |
(3) |
(17) |
0 |
0 |
Movements in debt |
(22) |
(24) |
140 |
0 |
0 |
0 |
Dividends paid |
(28) |
(23) |
(17) |
(28) |
(28) |
(26) |
Other financing activities |
(27) |
(33) |
(38) |
(14) |
(9) |
(30) |
Cash from financing activities (CFF) |
(76) |
(79) |
82 |
(58) |
(37) |
(56) |
Currency translation differences and other |
0 |
0 |
0 |
0 |
0 |
0 |
Increase/(decrease) in cash and equivalents |
20 |
53 |
(5) |
54 |
35 |
23 |
Currency translation differences and other |
0 |
(1) |
(12) |
0 |
0 |
0 |
Cash and equivalents at end of period |
192 |
245 |
228 |
282 |
317 |
340 |
Net (debt) cash |
(29) |
56 |
(109) |
(54) |
(20) |
4 |
Movement in net (debt) cash over period |
(29) |
85 |
(164) |
54 |
35 |
23 |
Source: Company data, Edison Investment Research
|
|
Research: Healthcare
BioLargo continues to make progress in its goal to establish its various subsidiaries as independent businesses. Odor-No-More recorded revenue of $301,000 for Q119 (of $364,000 total), down 10.7% from Q419. It cited lumpiness in its sales pattern caused by the timing of orders, weather and manufacturing, and the fact that approximately 20% ($68,000) of orders were in process at the end of the quarter. This business is expanding with new distribution agreements in the waste handling and cannabis industries. BioLargo Water has placed it first Advanced Oxidation System (AOS) treatment train, and Clyra Medical will run a 30-day animal study to support a 510(k) application for its wound treatment product.