Last close As at 05/08/2026
GBP3.74
▲ 2.00 (0.54%)
Market capitalisation
GBP1,342m
Research: Investment Companies
Worldwide Healthcare Trust (WWH) aims to generate capital growth from a global portfolio of healthcare stocks. While around two-thirds of the portfolio is invested in the US, there is a meaningful c 15% exposure to emerging markets and WWH can invest across all subsectors of the healthcare industry. Since launch, the trust has been managed by Sam Isaly, who is co-founder of OrbiMed Capital, the largest dedicated healthcare investment manager in the world. WWH has a strong investment track record – it has outperformed its benchmarks over one, three, five and 10 years. WWH’s discount has been on a narrowing trend since mid-2016; its shares are now in line with cum-income NAV.
Worldwide Healthcare Trust |
Investing in healthcare across the globe |
Investment trusts |
25 May 2017 |
Share price/discount performance
Three-year performance graph
Gearing
Analysts
|
|||||||||||||||||||||||||||||||||||||||||||||||||||||||||||||||||||||||||||||||||||||||||||||
Worldwide Healthcare Trust (WWH) aims to generate capital growth from a global portfolio of healthcare stocks. While around two-thirds of the portfolio is invested in the US, there is a meaningful c 15% exposure to emerging markets and WWH can invest across all subsectors of the healthcare industry. Since launch, the trust has been managed by Sam Isaly, who is co-founder of OrbiMed Capital, the largest dedicated healthcare investment manager in the world. WWH has a strong investment track record – it has outperformed its benchmarks over one, three, five and 10 years. WWH’s discount has been on a narrowing trend since mid-2016; its shares are now in line with cum-income NAV.
12 months ending |
Share price |
NAV |
MSCI World Health Care (%) |
DS World Pharm and Biotech (%) |
FTSE All-Share (%) |
30/04/13 |
37.4 |
32.4 |
35.9 |
39.9 |
17.8 |
30/04/14 |
22.8 |
19.5 |
12.8 |
11.9 |
10.5 |
30/04/15 |
47.0 |
52.1 |
32.9 |
31.0 |
7.5 |
30/04/16 |
(3.8) |
(3.4) |
0.0 |
(3.1) |
(5.7) |
30/04/17 |
31.5 |
25.2 |
21.7 |
18.3 |
20.1 |
Source: Thomson Datastream. Note: All % on a total return basis in GBP.
Investment strategy: Global healthcare exposure
Manager Sam Isaly draws on the resources of OrbiMed’s highly experienced global healthcare team to construct a portfolio of healthcare stocks that is diversified by size, geography and subsector. At end-April 2017, c 70% of the portfolio was invested in large-caps (at or above $5bn) with the balance in mid-cap and smaller companies. Stocks are selected for their underappreciated products or pipelines, strong financials and high-quality management. WWH may employ gearing of up to 20% of net assets; at end-April 2017, net gearing was 6.7%.
Market outlook: Potential valuation opportunity
Following a period of higher-than-average volatility for the healthcare sector as a result of increased scrutiny over drug prices ahead of the US presidential election, the valuation of pharma and biotech stocks (which together make up c two-thirds of the MSCI World Healthcare index) is looking attractive versus history. Industry fundamentals remain robust, aided by an ageing global population, and there is potential for mergers and acquisitions, which may lead to improved investor sentiment towards the industry. For investors seeking exposure to the sector, a fund with a global remit and a strong investment track record may offer some appeal.
Valuation: Shares trading close to par
WWH’s shares are currently trading in line with its cum-income NAV; this compares to the 12-month range of a 1.5% premium to a 13.0% discount. It compares to the average discounts of the last one, three and five years of 4.2%, 4.6% and 4.8%. While aiming to generate capital growth rather than income, WWH pays out 85% of net income in order to maintain its investment trust status. Having declined for three consecutive years, the FY16 annual dividend was a 32% increase versus the prior year; WWH’s current dividend yield is 0.7%.
Exhibit 1: Trust at a glance
Investment objective and fund background |
Recent developments |
||||||||||||||||||||||||||||||||||||||||||||||||||||||||||||||||||||||
Worldwide Healthcare Trust’s investment objective is to invest worldwide in pharmaceutical, biotechnology and related securities in the healthcare sector to achieve a high level of capital growth. Gearing and derivative transactions are used to mitigate risk and enhance capital returns. In 2010 the mandate was broadened to include healthcare equipment and services and healthcare technology. |
■ 25 November 2016: Six-month results to 30 September 2016. NAV TR +21.2% versus benchmark TR +17.3%, share price TR +24.4%. ■ 16 November 2016: Announcement of first interim dividend of 6.5p per share. ■ 21 September 2016: Jo Dixon retired as non-executive director. Humphrey van der Klugt is now chairman of the audit committee and David Holbrook is now senior independent director. |
||||||||||||||||||||||||||||||||||||||||||||||||||||||||||||||||||||||
Forthcoming |
Capital structure |
Fund details |
|||||||||||||||||||||||||||||||||||||||||||||||||||||||||||||||||||||
AGM |
September 2017 |
Ongoing charges |
0.9% |
Group |
Frostrow Capital LLP |
||||||||||||||||||||||||||||||||||||||||||||||||||||||||||||||||||
Final results |
June 2017 |
Net gearing |
6.7% |
Manager |
OrbiMed Capital LLC (Samuel Isaly) |
||||||||||||||||||||||||||||||||||||||||||||||||||||||||||||||||||
Year end |
31 March |
Annual mgmt fee |
See page 7 |
Address |
25 Southampton Buildings, London, WC2A 1AL, UK |
||||||||||||||||||||||||||||||||||||||||||||||||||||||||||||||||||
Dividend paid |
January, July |
Performance fee |
See page 7 |
||||||||||||||||||||||||||||||||||||||||||||||||||||||||||||||||||||
Launch date |
April 1995 |
Trust life |
Indefinite |
Phone |
+44 (0)20 3008 4910 |
||||||||||||||||||||||||||||||||||||||||||||||||||||||||||||||||||
Continuation vote |
Five-yearly, next in 2019 |
Loan facilities |
Up to 20% of net assets |
Website |
|||||||||||||||||||||||||||||||||||||||||||||||||||||||||||||||||||
Dividend policy and history (financial years) |
Share buyback policy and history (financial years) |
||||||||||||||||||||||||||||||||||||||||||||||||||||||||||||||||||||||
In line with the requirement for investment trusts to pay out 85% of their income net of expenses, two interim dividends a year are paid in January and July. |
The trust has authority to purchase up to 14.99% and allot up to 10% of issued share capital. Allotments in the chart include exercise of subscription shares. |
||||||||||||||||||||||||||||||||||||||||||||||||||||||||||||||||||||||
|
|
||||||||||||||||||||||||||||||||||||||||||||||||||||||||||||||||||||||
Shareholder base (as at 30 April 2017) |
Portfolio exposure by geography (as at 30 April 2017) |
||||||||||||||||||||||||||||||||||||||||||||||||||||||||||||||||||||||
|
|
||||||||||||||||||||||||||||||||||||||||||||||||||||||||||||||||||||||
Top 10 holdings (as at 30 April 2017) |
|||||||||||||||||||||||||||||||||||||||||||||||||||||||||||||||||||||||
|
|||||||||||||||||||||||||||||||||||||||||||||||||||||||||||||||||||||||
Source: Worldwide Healthcare Trust, Edison Investment Research, Bloomberg, Morningstar. Note: *N/A where not in April 2016 top 10.
Market outlook: Valuations relatively attractive
The five-year performance of the NASDAQ Biotechnology and MSCI World Health Care indices are shown in Exhibit 2 (left-hand side). The performance of biotech stocks has been particularly volatile over the last two years as investors have focused more on discussions about drug pricing than positive industry fundamentals. Biotech companies are continuing to develop novel products, which are in high demand from patients and larger healthcare companies. Pharma represents c 50% of the MSCI World Health Care index and, as shown in Exhibit 2 (right-hand side), pharma stocks represented by the DS World Pharma index are now more attractively valued versus world equities. They are currently trading at a 3.1% premium versus a five-year average premium of 13.5%. This is despite an outlook for potentially higher earnings growth; in recent years the major pharma companies have negotiated a patent cliff and have worked on rebuilding their product pipelines. Companies are increasing their focus on areas where they have a competitive advantage, with examples such as Glaxo SmithKline swapping its oncology assets for Novartis’s vaccine assets. For investors seeking exposure to the healthcare sector, a fund invested across multiple geographies and across the market cap spectrum, that has a strong long-term performance track record, may be of interest.
|
Exhibit 2: Market performance and valuation |
|
NASDAQ Biotech and MSCI World Health Care index total returns in £ |
Absolute and relative forward P/E multiple for DS World Pharma index |
|
|
|
Source: Thomson Datastream, Edison Investment Research |
|
Fund profile: Specialist investment in global healthcare
WWH was launched in 1995; since inception, the trust has been managed by OrbiMed Capital, which is the world’s largest dedicated healthcare investment manager, with assets under management of c $13bn. OrbiMed was founded in 1989 and invests globally in companies across the market cap spectrum, and which are at different stages of development. WWH’s lead manager since launch is Sam Isaly, who is a co-founder of OrbiMed; he has been analysing and investing in healthcare companies since 1968. He aims to generate capital growth from a diversified portfolio of global healthcare companies.
Since 1 October 2010, WWH has been benchmarked against the MSCI World Health Care index, which includes all subsectors of the global healthcare industry; prior to this the benchmark was the Datastream World Pharma & Biotech index. At the time of acquisition, up to 15% of WWH’s portfolio may be invested in a single stock. At least 60% will normally be invested in larger companies (market cap at or above $5bn) and at least 20% in smaller companies (below $5bn). Up to 10% may be invested in unquoted securities, and up to 5% in each of the following: debt instruments, convertibles and royalty bonds issued by pharmaceutical and biotechnology companies. Up to 20% may be invested in each of the following sectors: healthcare equipment and supplies; healthcare technology; and healthcare providers and services. Investment in derivatives is permitted to enhance returns and mitigate risk. The trust may gear up to 20% of net assets. At end-April 2017, net gearing was 6.7%.
The fund manager: Sam Isaly
The manager’s view: US healthcare system undergoing change
Isaly is keen to emphasise that despite the key industry focus on the US, WWH is a global fund, which includes a meaningful exposure to the emerging markets and invests across the industry, not just in pharma and biotech.
Currently there is a lot of attention on US President Trump’s move to repeal and replace the Affordable Care Act (Obamacare). The manager says that the American legislative system is more fragmented than in the UK, for example so it is difficult to enact change. The House of Representatives has approved the draft America Health Care Act, but the text would need to be passed verbatim by the Senate before it can become law, subject to presidential signature. The Republican-led Senate has said that it will write a new bill, so the amendments that have already been passed by the House of Representatives will have to go into conference until the changes can be passed by both houses. Isaly envisages that this process will take a long time, and notes that a bill’s second passage through Congress can often prove difficult.
The manager highlights that some of the beneficiaries of Obamacare were the pharma companies, as an additional 20 million people became covered by medical insurance, which led to higher prescription volumes in 2015 and 2016. Other beneficiaries included the hospitals, which historically had to offer uncompensated emergency care when necessary prior to Obamacare; after the act was passed, a decrease in the number of uninsured patients meant the hospitals got paid to a larger extent. Isaly is mindful that if Obamacare is repealed and replaced, those sectors of the healthcare industry that were enjoying a tailwind may now face headwinds.
Isaly comments that the pricing of pharma and biotech products has become more of an issue in recent years, while noting that the US healthcare industry supply chain is opaque, with drug companies receiving only approximately two-thirds of the final drug price. A non-interference clause currently prevents the government from negotiating drug prices with the pharma companies for Medicare beneficiaries. The manager suggests that legislation will change and in future, negotiation will be mandatory. However, he stops short of suggesting that there will be full-on price controls, while remaining mindful of the effects of the potential changes to the industry pricing environment.
The manager remains positive on the outlook for the healthcare industry and is confident that its growth can continue. He says that for portfolio holdings, there have been no major disappointments in Q117 earnings reports. Isaly cites that several companies have surprised to the upside, such as biotech companies Biogen and Celgene, pharma companies Bristol-Myers Squibb, Eli Lilly and Merck, life science tools companies Exact Sciences and Illumina, and medtech companies Boston Scientific, Edwards Lifescience and Intuitive Surgical. The manager highlights continued industry scientific advances such as in biopharmaceuticals, where there is a focus on curing, not just treating diseases via gene therapy and genomics. He suggests that innovation in medtech is strong and growth in emerging markets continues to outpace that in developed markets. Despite positive industry fundamentals, Isaly says that valuations remain attractive, with earnings multiples well below historical averages. Earlier in 2017, there was sizeable merger and acquisition (M&A) activity such as Johnson & Johnson’s largest ever acquisition, c $30bn for Actelion Pharmaceuticals at a c 23% premium. Although there has been less M&A activity announced recently, the manager considers that there is potential for further significant activity going forward.
Asset allocation
Investment process: In-depth, bottom-up research
The manager is able to draw on the highly experienced team at OrbiMed, which has c 100 healthcare investment professionals, many of whom have PhDs or are former healthcare company chief executives or founders. OrbiMed has global reach with offices in New York, San Francisco, Shanghai, Mumbai and Herzliya. WWH aims to generate capital growth from a portfolio of global healthcare stocks. Companies are selected from an investible universe of c 1,000, which encompasses all segments of the global healthcare industry. OrbiMed conducts rigorous fundamental research, seeking companies with underappreciated products or pipelines, strong balance sheets and quality management teams. Meeting with company managements is a key part of the investment process, and investee companies are met at least once a year. WWH’s portfolio may cover the whole spectrum from early-stage companies with pre-clinical assets up to major integrated pharma companies. The manager is willing to invest in companies ahead of a binary outcome, where he has a high level of confidence that the outcome will be positive. Gearing and derivatives are used to enhance investment returns and mitigate risk.
Current portfolio positioning
At end-April 2017, WWH’s top 10 positions comprised 35.5% of the portfolio. This was a modest decrease in concentration versus 39.6% at end-April 2016. As shown in Exhibit 3, the largest changes on a geographic basis over the last 12 months are a higher exposure to Europe and a lower exposure to Asia.
Exhibit 3: Portfolio geographic exposure (% unless stated)*
Portfolio end-April 2017 |
Portfolio end-April 2016 |
Change (pp) |
|
North America |
66.3 |
65.8 |
0.5 |
Europe |
14.8 |
9.9 |
4.9 |
Emerging markets |
13.1 |
14.5 |
(1.4) |
Asia |
5.8 |
9.8 |
(4.0) |
100.0 |
100.0 |
Source: Worldwide Healthcare Trust, Edison Investment Research. Note: *Based on country of incorporation.
Exhibit 4 shows that WWH’s subsector exposure can diverge markedly from the benchmark. The underweight exposure to large-cap pharma and meaningful weighting to emerging markets at end-January 2017 are illustrative of this (latest date available). The manager comments that the pharma and biotech exposure within WWH’s portfolio is lower than historically, and that the exposure to medtech/devices is higher, both due to a higher capital allocation and from share price appreciation.
Exhibit 4: Portfolio sector exposure vs benchmark (% unless stated)
Portfolio end-January 2017 |
Index weight end-January 2017 |
Difference (pp) |
|
Large-cap pharma |
15.3 |
42.6 |
(27.3) |
Specialty pharma |
10.6 |
8.4 |
2.2 |
Large-cap biotech |
16.2 |
11.4 |
4.8 |
Emerging biotech |
13.6 |
2.7 |
10.9 |
Life science tools |
4.0 |
5.9 |
(1.9) |
Healthcare services |
11.5 |
14.2 |
(2.7) |
Medtech/devices |
15.0 |
14.8 |
0.2 |
Emerging markets |
13.9 |
0.0 |
13.9 |
100.0 |
100.0 |
Source: Worldwide Healthcare Trust, Edison Investment Research. Note: *Rebased to exclude gearing and structured finance.
At end-April 2017, the largest position in the portfolio was Wright Medical (one of four medtech/device companies in the top 10 holdings). Following the merger with Tornier in October 2015, Wright Medical now has leading positions in both upper and lower extremities, two of the highest growth segments of the orthopaedic industry. The company has a large number of new product launches planned in 2017 in both upper and lower extremities and is seeking FDA approval for an injectable version of its biologic product Augment, which is used for bone grafts. While Q117 sales were lighter than consensus estimates, the manager comments that profits were satisfactory and, despite a pullback in the stock, Wright Medical’s current share price is meaningfully above WWH’s purchase price.
Performance: Very strong record
WWH’s absolute returns versus its benchmark are shown in Exhibit 5 (right-hand side) – WWH’s one-year NAV and share price total returns of 25.2% and 31.5% are comfortably ahead of the 21.7% benchmark total return; all have been boosted by the weakness of sterling.
|
Exhibit 5: Investment trust performance to 30 April 2017 |
|
Price, NAV and benchmark total return performance, one-year rebased |
Price, NAV and benchmark total return performance (%) |
|
|
|
Source: Thomson Datastream, Edison Investment Research. Note: Three, five and 10-year performance figures annualised. Benchmark is DS World Pharma & Biotech index until 30 September 2010 and MSCI World Health Care index thereafter. |
|
Exhibit 6 shows WWH’s relative returns; its NAV total return has outperformed its benchmarks’ total returns over one, three, five and 10 years. Of interest to UK-based investors, WWH’s performance record is considerably stronger than the performance of the FTSE All-Share index.
|
Exhibit 6: Share price and NAV total return performance, relative to indices (%) |
||||||||
|
One month |
Three months |
Six months |
One year |
Three years |
Five years |
10 years |
|
Price relative to MSCI World Health Care |
1.4 |
2.3 |
7.5 |
8.0 |
14.9 |
26.5 |
48.6 |
|
NAV relative to MSCI World Health Care |
0.2 |
(0.9) |
1.9 |
2.8 |
13.7 |
17.3 |
39.9 |
|
Price relative to DS World Pharma & Biotech |
2.0 |
2.7 |
9.6 |
11.1 |
23.8 |
33.4 |
50.4 |
|
NAV relative to DS World Pharma & Biotech |
0.8 |
(0.4) |
3.9 |
5.8 |
22.5 |
23.8 |
41.6 |
|
Price relative to FTSE All-Share |
0.2 |
3.6 |
6.7 |
9.5 |
52.7 |
97.8 |
205.1 |
|
NAV relative to FTSE All-Share |
(0.9) |
0.5 |
1.1 |
4.2 |
51.1 |
83.5 |
187.4 |
|
|
Source: Thomson Datastream, Edison Investment Research. Note: Data to end-April 2017. Geometric calculation. |
||||||||
|
Exhibit 7: NAV total return performance relative to benchmark over five years |
||||||||
|
||||||||
|
Source: Thomson Datastream, Edison Investment Research |
||||||||
Discount: Currently trading at par
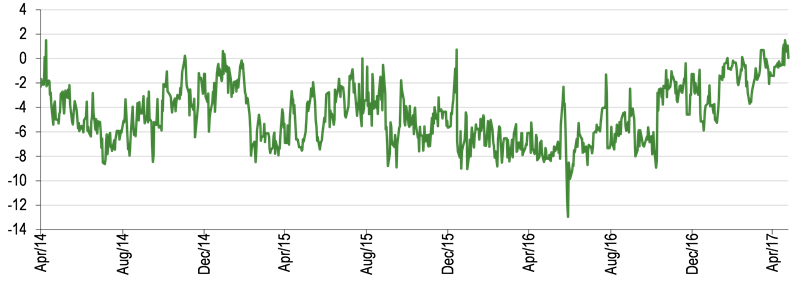
WWH’s shares are currently trading in line with its cum-income NAV; this compares to the average discounts of the last one, three and five years (range of 4.2% to 4.8%). The widest discount of the last five years of 13.0% occurred on 28 June 2016, following the result of the UK’s European referendum. WWH’s board aims to keep the discount below 6%; in FY17 (end-March 2017), 1.5m shares were repurchased at a cost of £29.8m (average price of 1,935.6p). There have been no share repurchases so far in FY18.
|
Exhibit 8: Share price premium/discount to NAV (including income) over three years (%) |
|
|
Source: Thomson Datastream, Edison Investment Research |
Capital structure and fees
WWH is a conventional investment trust with one class of share in issue – there are currently 46.5m shares outstanding. Gearing of up to 20% of net assets is permitted; the trust has an overdraft facility with J.P. Morgan Chase. At end-April 2017, net gearing was 6.7%.
The fund manager, OrbiMed, is paid a base fee of 0.65% of NAV. Frostrow Capital is the Alternative Investment Fund Manager; it is paid £57,500 per annum plus 0.30% of WWH’s market cap up to £150m, 0.20% between £150m and £500m, 0.15% between £500m and £1bn, 0.125% between £1bn and £1.5bn and 0.075% above £1.5bn. Up until 31 March 2017, a performance fee of 16.5% of outperformance was payable (15% to OrbiMed and 1.5% to Frostrow), if WWH outperformed the blended benchmark. From that date, the 1.5% payable to Frostrow is no longer applicable, but OrbiMed’s arrangements remain in place. The performance fee is only payable when incremental outperformance since launch has been achieved and maintained for a 12-month period. Therefore, any performance fee that was accrued by Frostrow in the period up to 31 March 2017 will be payable on 31 March 2018. For more information on the performance fee, please see our note of July 2015. In FY16, ongoing charges were 0.9%, which was a 10bp reduction versus the prior year. Including performance fees, ongoing charges were 2.1% versus 2.2% in FY15.
Dividend policy and record
WWH targets long-term capital return rather than income. In order to maintain its investment trust status, 85% of net income is distributed to shareholders; dividends are paid twice a year in January and July. Having declined for three years in a row, the FY16 annual dividend of 16.5p per share was a 32% increase versus the prior year. At end-H117 (September 2016), WWH’s revenue reserve was £10.4m, which is c 1.4x the FY16 annual dividend; its current dividend yield is 0.7%.
Peer group comparison
Exhibit 9 includes the members of the AIC Sector Specialist: Biotechnology & Healthcare sector, with the exclusion of BB Healthcare, which has less than one year of performance history. We also include BB Biotech and HBM Healthcare; they are listed in Switzerland. WWH’s NAV total returns are behind the group weighted average over the periods shown; although the average is skewed by the largest company, BB Biotech, which has the highest NAV total returns over one, three, five and 10 years. WWH is the only company trading on a premium to NAV and has the lowest ongoing charge in the group. It has the highest level of gearing and one of the lowest dividend yields in the sector. It should be noted that the three funds in the selected peer group with the highest dividend yields: BB Biotech, HBM Healthcare Investments and International Biotechnology all pay dividends out of capital.
Exhibit 9: Selected peer group as at 24 May 2017*
% unless stated |
Market cap £m |
NAV TR |
NAV TR |
NAV TR |
NAV TR |
Discount (ex-par) |
Ongoing charge |
Performance fee |
Net gearing |
Dividend yield (%) |
Worldwide Healthcare Trust |
1,090.3 |
25.3 |
81.2 |
202.5 |
387.5 |
0.7 |
0.9 |
Yes |
107 |
0.7 |
BB Biotech |
2,614.1 |
34.7 |
123.0 |
296.0 |
610.8 |
(2.9) |
1.1 |
No |
104 |
4.9 |
Biotech Growth Trust |
391.7 |
17.3 |
57.7 |
191.1 |
519.6 |
(7.6) |
1.0 |
Yes |
104 |
0.0 |
HBM Healthcare Investments |
697.1 |
26.4 |
86.6 |
239.0 |
|
(22.4) |
1.7 |
Yes |
100 |
4.8 |
International Biotechnology |
215.5 |
23.9 |
89.0 |
188.9 |
294.5 |
(6.4) |
1.4 |
Yes |
100 |
4.0** |
Polar Capital Global Healthcare |
243.2 |
20.0 |
42.5 |
115.4 |
|
(2.2) |
1.0 |
Yes |
100 |
2.6 |
Group weighted average |
29.2 |
99.5 |
248.4 |
530.2 |
(5.2) |
1.1 |
104 |
3.8 |
||
WWH rank in peer group |
2 |
3 |
4 |
3 |
3 |
1 |
6 |
1 |
5 |
Source: Morningstar, Edison Investment Research. Note: *Performance data to 23 May 2017. **Prospective yield. TR=total return. Net gearing is total assets less cash and equivalents as a percentage of net assets.
The board
WWH’s board comprises six directors, five of whom are non-executive and independent of the manager. Chairman Sir Martin Smith was appointed in 2007 and assumed his current role in 2008. The other independent directors and dates of appointment are: Dr David Holbrook (2007), Doug McCutcheon (2012), Sarah Bates (2013) and Humphrey van der Klugt (2016). Sam Isaly, WWH’s lead fund manager, is non-independent; he has been on the board since the trust’s launch in 1995. The board members have backgrounds in the financial and healthcare industries.
|
|
Research: Healthcare
Novogen’s recent market updates presented mixed news for investors. Recruitment in the Cantrixil Phase I is underway and preparations for the Phase II trial of GDC-0084 in glioblastoma are progressing well, although headline data are now likely in H1 CY20, 12 months later than we initially forecast. Mixed data from preclinical studies have seen development terminated for Anisina, which had been expected to enter the clinic in H217. While the termination of Anisina is disappointing, it is encouraging to see that management is taking a disciplined approach to assessing pipeline products. We now value Novogen between $66m ($3.39/ADR) and $111m ($5.74/ADR) under two different development scenarios for GDC-0084. Major milestones anticipated in 2017 include initiation of a Phase II trial of GDC-0084 and full enrolment in the Cantrixil Phase I.