Last close As at 05/08/2026
—
— 0.00 (0.00%)
Market capitalisation
—
Research: Real Estate
During H120, Palace stepped up its refurbishment and development activity aimed at improving the quality of the portfolio and enhancing its income and valuation potential over the longer term. The flagship Hudson Quarter development is making good progress and the initial tranche of the apartments offered for sale in June has been well received. Although refurbishment and redevelopment activity is dampening current income, DPS is being maintained in anticipation of future income growth and represents an attractive yield.
Palace Capital |
Investing for growth |
Interim results |
Real estate |
2 December 2019 |
Share price performance
Business description
Next events
Analyst
Palace Capital is a research client of Edison Investment Research Limited |
|||||||||||||||||||||||||||||||||||||||||||||||
During H120, Palace stepped up its refurbishment and development activity aimed at improving the quality of the portfolio and enhancing its income and valuation potential over the longer term. The flagship Hudson Quarter development is making good progress and the initial tranche of the apartments offered for sale in June has been well received. Although refurbishment and redevelopment activity is dampening current income, DPS is being maintained in anticipation of future income growth and represents an attractive yield.
Year end |
Net rental income (£m) |
Adj. PBT* |
Adj. EPS* |
EPRA NAV/ |
P/NAV |
DPS |
Yield |
03/19 |
16.4 |
8.9 |
17.3 |
407 |
0.70 |
19.0 |
6.7 |
03/20e |
18.3 |
8.0 |
16.7 |
391 |
0.73 |
19.0 |
6.7 |
03/21e |
15.7 |
8.1 |
17.6 |
412 |
0.69 |
19.0 |
6.7 |
03/22e |
16.8 |
9.0 |
19.5 |
416 |
0.68 |
19.0 |
6.7 |
Note: *Adjusted earnings – in addition to EPRA adjustments for revaluation gains, profits or losses on disposals of investment properties and surrender gains on early lease terminations, this adjusts for share-based payments and Main Market listing costs. **EPRA NAV is fully diluted.
Robust H120
The property portfolio produced an ungeared total return of 1.5% in H120 compared with 0.8% for the MSCI Quarterly Benchmark Index, benefiting from a focus on regional office and industrial assets. The Hudson Quarter (HQ) development remains on track and on budget and, after initial marketing of 20 apartments in June, 21 apartments have been sold with another seven under offer. Refurbishment and redevelopment are dampening current income and recurring earnings, but adjusted net earnings increased to £3.9m (H119: £3.6m) due to post-REIT conversion tax benefits. With capex yet to be reflected in property valuation EPRA NAV fell 3.9% to 391p. Gearing remained moderate at 34%. Mainly reflecting refurbishment plans our forecasts are reduced slightly (see page 7).
Significant income and value potential
End-H120 estimated rental value (ERV) of £21.2m pa, before the c £0.9m rent potential expected from the HQ commercial assets, is 30% ahead of passing rent of £16.3m pa. This represents a significant opportunity to increase recurring income and underpins the continuation of attractive dividend distributions. Relatively little of this income and value opportunity is reflected in our forecasts although we do include c £10m in development gains in respect of HQ. Similarly not factored into our forecasts, management continues to seek accretive acquisitions for which borrowing headroom exists.
Valuation: Attractive yield and discount to NAV
The dividend yield is attractive, more than 6%, and management has committed to the current level of DPS despite a near-term earnings cover shortfall. The discount to EPRA NAV is c 27%. Asset management initiatives to capture reversionary potential and progress with Hudson Quarter are potential triggers for a re-rating.
Investing for future growth
During H120, Palace stepped up its refurbishment and development activity aimed at improving the quality of the portfolio, and enhancing its income and valuation potential over the longer term. The flagship Hudson Quarter development is making good progress and the initial tranche of the apartments offered for sale in June has been well received. The necessary increase in vacancy has dampened recurring income in the period, while capex is yet to be fully reflected in property revaluation. However, DPS has been maintained in anticipation of the future income growth that management expects and the solid financial position. Reported earnings included significant lease surrender income as well as positive current and deferred tax effects resulting from REIT conversion.
Exhibit 1: Summary of H120 financials
H120 |
H119 |
H120/ H119 |
FY19 |
|||||||
£m unless stated otherwise |
IFRS |
Adj. |
Adj. earnings |
IFRS |
Adj. |
Adj. earnings |
Adj. earnings |
IFRS |
Adj. |
Adj. earnings |
Rental & other income |
11.9 |
(2.9) |
9.1 |
9.2 |
0.0 |
9.2 |
18.8 |
18.8 |
||
Non-recoverable property costs |
(1.2) |
(1.2) |
(1.1) |
(1.1) |
(2.3) |
(2.3) |
||||
Net rental income |
10.7 |
(2.9) |
7.9 |
8.1 |
0.0 |
8.1 |
-3.2% |
16.4 |
0.0 |
16.4 |
Dividend on listed equity investment |
0.1 |
0.1 |
0.0 |
0.0 |
0.0 |
0.0 |
||||
Share based payments |
(0.1) |
0.1 |
0.0 |
(0.1) |
0.1 |
0.0 |
(0.3) |
0.3 |
0.0 |
|
Other administrative expenses |
(2.1) |
(2.1) |
(1.9) |
(1.9) |
10.9% |
(3.8) |
(3.8) |
|||
Operating profit before gains/(losses) on property assets |
8.6 |
(2.8) |
5.8 |
6.1 |
0.1 |
6.2 |
-6.6% |
12.4 |
0.3 |
12.7 |
Unrealised gains/(loss) on revaluation of investment properties |
(6.2) |
6.2 |
0.0 |
3.9 |
(3.9) |
0.0 |
(0.4) |
0.4 |
0.0 |
|
Profit/(loss) on disposal of investment properties |
(0.3) |
0.3 |
0.0 |
0.2 |
(0.2) |
0.0 |
(0.7) |
0.7 |
0.0 |
|
Impairment of trading properties |
(0.3) |
0.3 |
0.0 |
0.0 |
0.0 |
|||||
Unrealised gain/(loss) on listed investments |
0.1 |
(0.1) |
0.0 |
0.0 |
0.0 |
0.0 |
(0.2) |
0.2 |
0.0 |
|
Operating profit |
1.9 |
3.9 |
5.8 |
10.2 |
(4.0) |
6.2 |
-6.6% |
11.1 |
1.6 |
12.7 |
Net finance costs |
(2.4) |
0.5 |
(1.9) |
(1.9) |
0.0 |
(1.9) |
-2.1% |
(3.7) |
(3.7) |
|
Change in value of interest rate derivatives |
(0.7) |
0.7 |
0.0 |
0.1 |
(0.1) |
0.0 |
(0.9) |
0.9 |
0.0 |
|
Profit before tax |
(1.2) |
5.1 |
3.9 |
8.3 |
(4.1) |
4.3 |
-8.6% |
6.4 |
2.5 |
8.9 |
Taxation |
3.7 |
(3.7) |
0.0 |
(1.1) |
0.4 |
(0.6) |
(1.3) |
0.2 |
(1.0) |
|
Profit after tax |
2.6 |
1.4 |
3.9 |
7.3 |
(3.6) |
3.6 |
7.4% |
5.2 |
2.8 |
7.9 |
OTHER DATA |
||||||||||
Basic EPS (p) |
5.6 |
15.9 |
11.3 |
|||||||
Fully diluted EPRA EPS (p)* |
14.5 |
7.7 |
87.7% |
16.5 |
||||||
Fully diluted adjusted EPS (p) |
8.5 |
8.0 |
6.8% |
17.3 |
||||||
DPS (p) |
9.5 |
9.5 |
0.0% |
19.0 |
||||||
EPRA NAV per share (p) |
391 |
421 |
-7.2% |
407 |
||||||
EPRA NAV total return |
-1.4% |
4.0% |
2.8% |
|||||||
Fair value of investment properties |
275.8 |
261.6 |
286.3 |
|||||||
Net debt |
94.1 |
85.4 |
96.5 |
|||||||
Net LTV |
34.1% |
30.3% |
33.7% |
|||||||
Source: Palace Capital data, Edison Investment Research
The key highlights of the H120 results were:
■
The property portfolio produced an ungeared total return of 1.5% compared with 0.8% for the MSCI Quarterly Benchmark Index, benefiting from a focus on regional office and industrial assets.
■
On an IFRS basis, net rental income included £2.9m of previously disclosed non-recurring lease surrender income. Excluding this, rental income was marginally lower, reflecting the current focus on strategic refurbishment and development. On an EPRA basis, occupancy was 84% at the end of the period compared with 87% at end-FY19.
■
Adjusted profit before tax (excluding realised and unrealised valuation movements, share-based payments and non-recurring items, including the lease surrender premium) was £3.9m (H119: £4.3m). As a result of REIT conversion, the tax charge has fallen away, and post-tax adjusted earnings were also £3.9m but ahead of H119 (£3.6m). Adjusted EPS was 8.5p and covered DPS (unchanged at 9.5p) by c 90%.
■
Negative property revaluation was driven by the impact of the lease surrender on the carried value of the short leasehold asset value and the lack of recognition of refurbishment and redevelopment capex in the property valuation. This typically comes through with a lag as the projects complete and refurbished and developed space is re-let or sold. As a result, EPRA NAV per share reduced 3.9% to 391p compared with 407p at end-FY19.
■
IFRS earnings and IFRS NAV benefited from the post-REIT conversion elimination of £3.7m of deferred tax liabilities in respect of unrealised property revaluation gains (EPRA NAV had previously adjusted for this).
■
Gearing remained moderate, with a c 34% net LTV. The company had c £46m of undrawn debt facilities comprising the £26.5m development loan that will be used to fund continuing building costs at Hudson Quarter, and a £20m flexible revolving credit facility.
In a confident outlook statement management reiterates its confidence that the core income-producing properties, together with the development and refurbishment pipeline, including the ongoing progress at Hudson Quarter, will generate increasing income and significant value for shareholders over the long term.
Portfolio update
Palace’s property portfolio performance continues to benefit from its sector positioning. The 1.5% property total return in H120 was ahead of the MSCI Quarterly Benchmark Index return of 0.8% and the Palace portfolio has now outperformed the index over three successive years. The portfolio also contains significant opportunities to enhance income and capital values, in many cases supported by identified asset management initiatives.
The Palace property portfolio was externally valued at £275.8m at 30 September 2019. This included an income-generating investment portfolio of 55 commercial assets (plus two car park assets) and the Hudson Quarter development asset, split on the balance sheet between investment properties under development (the office and other commercial) and trading properties (the residential space that will be sold). The balance sheet value differs slightly from the external valuation, primarily due to lease incentive and other adjustments. The standing commercial assets had a gross annualised contracted rental income of £16.3m with a weighted average unexpired lease term (WAULT) of 5.2 years to first break. On an EPRA basis, occupancy was 84%. The ERV of the portfolio of £21.2m represents a significant income opportunity, discussed below, and is expected to increase to c £22.2m on completion of the Hudson Quarter commercial space.
Exhibit 2: Portfolio summary
£m unless otherwise stated |
30 September 2019 |
31 March 2019 |
H120 |
FY19 |
|
Property valuation |
275.8 |
286.3 |
Number of commercial properties* |
55 |
59 |
Commercial GLA** (million square feet) |
1.7 |
1.7 |
Contractual rental income |
16.3 |
17.7 |
Net rental income |
14.8 |
15.8 |
ERV (excluding Hudson Quarter) |
21.2 |
22.4 |
WAULT (to first break) |
5.2 years |
4.5 years |
EPRA occupancy rate |
84% |
87% |
Source: Palace Capital. Note: *In addition there are two car parks. **GLA is gross lettable area.
Overweight in industrial and office assets
Although Palace is sector-agnostic in terms of its approach to asset selection, it nevertheless maintains a diversified portfolio by both sector and location. The portfolio is regional (ie not central London) and 62% (by value) is invested in offices and industrial assets, which continue to drive overall returns. The tenant base is also diversified in number and industry exposure, providing income security. The largest tenant (Vue) accounts for c £0.9m of contracted rents and the top 20 tenants account for c 45%.
The largest sector exposure is to regional offices (48% by value) where growing tenant demand, including relocations away from London and limited new supply including conversion of office space to residential have all contributed to a generally positive demand-supply balance and continuing rental growth. Industrial property (14% by value) has similarly benefited from firm occupier demand, limited new supply and rental growth. The leisure portfolio comprises two large leisure assets, in Halifax and Northampton, accounting for 15% of the portfolio by value. The leisure sector has faced similar challenges to the retail sector, although recent letting success at Northampton has taken occupancy to 89% and management says interest in the remaining space is strong. The retail portfolio includes a number of strong tenants (eg Aldi on a secure and recently extended long lease) and has no exposure to problem areas like mid-market fashion or department stores.
|
Exhibit 3: Sector split by value |
Exhibit 4: Geographic split by value |
|
|
|
Source: Palace Capital, 30 September 2019 |
|
Exhibit 3: Sector split by value |
|
|
Source: Palace Capital, 30 September 2019 |
|
Exhibit 4: Geographic split by value |
|
|
Source: Palace Capital, 30 September 2019 |
Portfolio activity
Palace invested £9.7m in H120 in refurbishment capex (£3.5m) and development spending (£6.2m). Acquisitions were sought, but none that met the group’s strict acquisition criteria was identified. Disposals amounted to £13.2m, including the £11.5m sales of the remaining non-core residential units acquired with RT Warren and a small non-core commercial asset (Rathbone House, Weybridge). Palace continues to look for suitable, accretive acquisition opportunities and also plans further non-core disposals in H220. The company has identified four non-core assets and management estimates that disposal will increase the remaining portfolio occupancy by 3pp to 87%, reduce non-recoverable property costs by c £0.5m pa, and generate c £2.75m of equity for reinvestment.
During H120, 12 lease renewals and five rent reviews were completed at an average of 3% above ERV, with a 25% uplift on previous rents, and creating c £0.4m of additional annual rental income. Nine lease reviews provided an additional £0.5m of annual income.
The reduction in H120 occupancy (EPRA basis) from 87% at end-FY19 to 84% additionally reflects the previously announced lease surrender at Priory House Birmingham (c £0.3m of annual rent) and other lease expiries. Palace says it has tactically reserved some of this freed space for refurbishment or redevelopment and in some instances the space has been let on a short-term basis.
Significant asset management opportunities
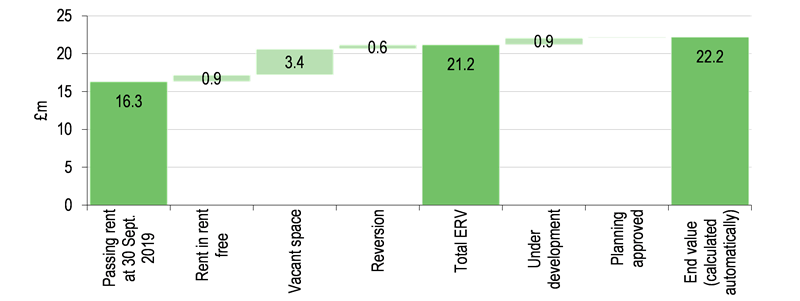
Significant opportunities exist in the current portfolio. The ERV of £21.2m is c 30% or £4.9m ahead of the end-H120 passing rent of £16.3m. Around £4.5m of the reversionary potential is within the regional office portfolio and £2.8m of this represents the upside from reducing voids.
|
Exhibit 5: Portfolio income opportunity to full occupancy estimated rental value (ERV) |
|
|
Source: Palace Capital |
The company continues to target void reduction alongside the programme of refurbishment and development opportunities that have been identified in the asset management plans of each individual property. These will be phased in over a number of years providing counter-cyclical opportunities to add value to the portfolio. Exhibit 6 provides a summary of the main upside opportunities. It is not possible to model all of these on an individual basis although, given its significance, we include detailed forecasts for Hudson Quarter within our overall group estimates.
|
Exhibit 6: Future upside within the portfolio |
|
|
Source: Palace Capital |
Hudson House progressing and well received
We expect the Hudson Quarter development to be a key driver of income growth and value creation during the forecast period. We expect the fully let income benefit from the retained commercial assets (c £0.9m pa) at completion to make an important contribution to rental income, and our forecast development gain of c £10m adds more than 20p per share to NAV. For details of our Hudson Quarter forecast, please see our outlook note published on 15 July.
Hudson Quarter occupies a two-acre site in York, within the city walls and just a minute’s walk from the York railway station. The scheme comprises three residential buildings and a commercial building. The 127 flats will be sold and the commercial development, comprising 35,000 sq ft of grade A offices and 5,000 sq ft of other commercial space and car parking, will be retained for income. Building work commenced in February 2019 and is expected to take around two years, with completion scheduled for January 2021. Management says that it is well ahead of the business plan and that marketing of the residential assets has been well received. An initial tranche of 20 apartments was offered for sale in June and demand has been such that pre-sales have been contracted on 21 apartments with another seven under offer. The York office market is strong and with the Hudson Quarter office development being the first within the city walls for more than a decade, the company anticipates strong interest from potential tenants with a view to pre-letting ahead of completion.
The commercial property market remains polarised
Amid some slowing of UK economic growth and continuing Brexit-related uncertainty, the UK commercial property market as a whole has entered a period of increased uncertainty, with sector performance remaining highly polarised. The industrial, warehouse and logistics sectors in particular, and also the office sector, are continuing to deliver positive returns, while the retail sector continues to suffer from weak occupational demand and the impact of CVAs and defaults, reflected in softer rental and capital values. Regional office returns continue to outperform central London office returns as they have done in every year since 2016. Research by Avison Young indicates that take-up of office space across the big nine regional office markets continued to be above the long-term average through Q219 and that against a backdrop of limited supply this has continued to put upward pressure on rents.
Looking forward, the most recent quarterly market forecasts by the Investment Property Forum (IPF, canvassing a group of fund managers and surveyors under the IPF Research Programme) were published in September and point to a deterioration in expectations for capital growth over the past quarter. This is focused on the retail sector, where the expectation of capital value decline has increased but also includes industrial, where expectations of capital value growth have been tempered. The consensus expectation for overall total property return remains positive despite weakness in retail.
Exhibit 7: Summary of IPF market consensus
Rental growth value (%) |
Capital value growth (%) |
Total return (%) |
||||||||||
2019 |
2020 |
2021 |
2019/23 |
2019 |
2020 |
2021 |
2019/23 |
2019 |
2020 |
2021 |
2019/23 |
|
Office |
0.8 |
0.6 |
1.3 |
1.3 |
(1.1) |
(1.1) |
0.5 |
0.2 |
2.9 |
3.1 |
4.9 |
4.6 |
Industrial |
3.0 |
2.0 |
1.7 |
2.0 |
2.1 |
1.1 |
1.5 |
1.5 |
6.6 |
5.7 |
6.1 |
6.1 |
Standard retail |
(3.1) |
(2.1) |
(0.9) |
(1.2) |
(8.1) |
(4.4) |
(1.4) |
(2.7) |
(3.9) |
0.1 |
3.3 |
1.9 |
Shopping centre |
(4.7) |
(3.3) |
(1.8) |
(2.3) |
(13.8) |
(7.2) |
(3.7) |
(5.7) |
(8.8) |
(1.5) |
2.3 |
0.0 |
Retail warehouse |
(3.8) |
(2.5) |
(1.0) |
(1.5) |
(10.8) |
(5.7) |
(1.9) |
(3.9) |
(5.2) |
0.5 |
4.6 |
2.4 |
All property |
(0.2) |
0.1 |
0.6 |
0.5 |
(3.6) |
(1.8) |
(0.2) |
(0.8) |
0.9 |
2.9 |
4.7 |
4.0 |
Change since spring forecast |
||||||||||||
Rental growth value (%) |
Capital value growth (%) |
Total return (%) |
||||||||||
2019 |
2020 |
2021 |
2019/23 |
2019 |
2020 |
2021 |
2019/23 |
2019 |
2020 |
2021 |
2019/23 |
|
Office |
0.4 |
0.3 |
0.2 |
0.2 |
0.6 |
0.2 |
0.6 |
0.5 |
0.5 |
0.0 |
0.6 |
0.5 |
Industrial |
0.0 |
(0.2) |
(0.1) |
(0.1) |
(0.5) |
0.1 |
1.0 |
0.5 |
(0.6) |
0.0 |
0.9 |
0.4 |
Standard retail |
(0.3) |
(0.4) |
(0.3) |
(0.4) |
(0.7) |
0.1 |
(0.1) |
(0.2) |
(0.7) |
0.1 |
(0.1) |
(0.2) |
Shopping centre |
(0.8) |
(0.7) |
(0.5) |
(0.6) |
(3.1) |
(1.0) |
(0.6) |
(1.1) |
(3.0) |
(0.8) |
(0.4) |
(1.0) |
Retail warehouse |
(0.7) |
(0.4) |
(0.1) |
(0.5) |
(1.9) |
(0.8) |
0.1 |
(0.7) |
(2.0) |
(0.7) |
0.2 |
(0.6) |
All property |
0.0 |
0.0 |
0.0 |
(0.1) |
(0.8) |
(0.1) |
0.3 |
0.0 |
(0.9) |
(0.2) |
0.3 |
0.0 |
Source: Investment Property Forum (IPF) UK consensus forecasts
We present the market consensus data as a guide to expected overall market direction and returns but would caution against a direct read across to Palace’s, or any other, portfolio. The market consensus is formed of a wide range of differing expectations and, at the individual portfolio level, much depends on the performance of individual assets as well as the timing and effectiveness of asset management initiatives. For Palace, we expect the Hudson Quarter development to be a significant driver of return over the next two years.
Financials
Our forecasts are based on an unchanged portfolio, although management continues to seek accretive acquisitions and, as discussed above, has also highlighted non-core asset disposals that it expects will generate gross proceeds of c £2.75m in H220. Forecast rental income is slightly reduced, reflecting the ongoing refurbishment plans and additional deferment of income/higher void rate at H120. We have also increased our forecast for administrative costs, partly offset by lower net finance costs (lower debt).
Exhibit 8: Estimate revisions
Net rental income (£m) |
Adjusted PBT (£m) |
Adjusted EPS* (p) |
EPRA NAV* (p) |
DPS (p) |
||||||||||||
Old |
New |
Chg (%) |
Old |
New |
Chg (%) |
Old |
New |
Chg (%) |
Old |
New |
Chg (%) |
Old |
New |
Chg (%) |
||
03/20e |
18.6 |
18.3 |
(2.0) |
8.2 |
8.0 |
(2.5) |
17.1 |
16.7 |
(2.4) |
411 |
391 |
(4.8) |
19.0 |
19.0 |
0.0 |
|
03/21e |
16.1 |
15.7 |
(2.1) |
8.4 |
8.1 |
(2.7) |
18.2 |
17.6 |
(3.1) |
432 |
412 |
(4.4) |
19.0 |
19.0 |
0.0 |
|
03/22e |
17.0 |
16.8 |
(1.4) |
9.0 |
9.0 |
(0.7) |
19.7 |
19.5 |
(1.0) |
435 |
416 |
(4.6) |
19.0 |
19.0 |
0.0 |
|
Source: Edison Investment Research. Note: *Adjusted EPS and EPRA NAV are both fully diluted.
Key forecasting assumptions
■
Our forecasts are based on an unchanged portfolio, although management continues to seek accretive acquisitions and, as discussed above, has also highlighted non-core asset disposals that it expects will generate gross proceeds of c £2.75m in H220.
■
The increase in recurring earnings that we forecast is driven by our expectation of growth in passing rent from £16.3m at end-H120 (£17.7m at end-FY19) to £18.6m by end-FY22. We had previously forecast end-FY22 passing rent of £19.2m and the reduction reflects lower assumed occupancy. We had previously assumed that like-for-like occupancy would rise from 87% at end-FY19 to 91.5% at end-FY22 but, with H120 occupancy lower at 84%, we now assume an increase to 90% by FY22. We continue to assume reversionary rental growth of c 0.5% pa and a contribution of c £0.9m pa from FY22 in respect of the Hudson Quarter commercial assets. Given management’s focus on void reduction and continuing rental growth in regional offices, our assumptions may prove conservative. Non-recoverable property costs are assumed to increase slightly in FY20 and then drop modestly with void reduction.
■
We have increased our forecasts for administrative expenses in line with H120. H120 included some undisclosed REIT conversion costs and we also note that Palace has recently strengthened its property management team. We now look for £3.9m (before share-based payment costs) in FY20 (previously £3.4m), falling to £3.7m in FY21 (£3.5m previously) as FY20 one-off costs fall away.
■
Our forecast for underlying net finance costs is reduced, although FY20 IFRS costs include the H120 c £0.7m of negative derivative fair value movements and c £0.5m of debt termination costs. These non-recurring costs are excluded from adjusted earnings. The reduction in underlying net interest cost is driven by lower average debt.
■
We expect accounting earnings and NAV to benefit from modest underlying revaluation gains, in line with achieved rental growth, adding an aggregate c £3.2m from the beginning of H220 through to end-FY22 (c 7p per share), with a more significant impact from the development profits that we forecast in respect of Hudson Quarter (c £10.2m or 22p per share) in FY22.
Funding and debt
End-H120 gross outstanding debt was £108.1m (including unamortised debt facility fees) and the cash balance was £14.0m. Net debt of £94.1m represented a net loan to value ratio (LTV) of 34.1%, within the company’s target range of 30–40%.
The debt was well spread across lenders with an average cost of 3.2% and an average maturity of 4.5 years. 63% of the debt was either fixed rate or hedged to mitigate interest rate risk. Undrawn facilities amounted to £46.5m comprising the £26.5m Barclays Bank development facility arranged to substantially fund the Hudson Quarter construction costs and a £20.0m revolving credit facility.
In our forecasts we do anticipate the need for further debt facilities but expect the development facility to be fully drawn during FY21, ahead of completion. We forecast the net LTV to peak at around 40% (net debt to peak at c £134m and gross debt at c £140m) as the Hudson Quarter nears completion and to then decline to c 30% as the residential asset sales complete.
This analysis suggests there is scope for Palace to bring forward acquisitions and/or other asset management and development projects during the period (not in our forecasts), especially as Hudson Quarter construction progresses and the residential pre-sales and commercial pre-letting position becomes clearer.
Valuation
Palace’s total return strategy has generated cumulative EPRA NAV total returns of 123.8% measured since the end of H114, or a compound annual average return of 15.8%.
Exhibit 9: NAV total return track record
H214 |
FY15 |
FY16 |
FY17 |
FY18 |
FY19 |
Cumulative return H214–FY19 |
|
Opening EPRA NAVPS |
218 |
341 |
388 |
414 |
443 |
414 |
218 |
Closing NAVPS |
341 |
388 |
414 |
443 |
414 |
407 |
407 |
Dividend per share paid |
2.5 |
8.50 |
14.00 |
18.00 |
19.00 |
19.00 |
81 |
Income return (%) |
1.1% |
2.5% |
3.6% |
4.3% |
4.3% |
4.6% |
37.2% |
Capital return (%) |
56.6% |
13.5% |
6.9% |
6.9% |
-6.4% |
-1.8% |
86.7% |
NAV total return (%) |
57.8% |
16.0% |
10.5% |
11.2% |
-2.1% |
2.8% |
123.8% |
Average annual compound return |
15.8% |
Source: Palace Capital data, Edison Investment Research
As discussed above, we believe that our forward-looking estimates have been struck cautiously, reflecting a less benign external market environment than has been experienced over the past five years, while assuming a relatively modest capture of the upside potential within the portfolio. Total return was a negative 1.4% in H120, reflecting the reduction in EPRA NAV per share during the period, primarily as a result of capital expenditure not being fully reflected in valuation. As refurbished space is leased at completion, we would expect some catch-up and, over the forecast period as a whole (FY20–22), our estimates imply a cumulative total return of 16.1% or an annual average compound return of 5.1%. There remains considerable scope for Palace to do better than this if market conditions remain favourable, and it is successful in continuing to let remaining vacant refurbished space and capturing reversionary potential through lease renewals. Management also continues to seek accretive acquisitions, which are similarly not reflected in our forecasts. Almost 90% of our forecast return comes from DPS payments and we expect these to be fully covered by earnings in FY22 following a full year, post-completion contribution from the Hudson Quarter development. Even on what we believe to be a cautious basis of forecasting, there remains a material uplift compared with risk-free returns (the 10-year UK gilt yield is c 0.7%).
Exhibit 10: Peer comparison
Price |
Market cap (£m) |
P/NAV* |
Yield** |
Share price performance |
||||
1 month |
3 months |
12 months |
From 12M high |
|||||
Circle Property |
205 |
58 |
0.74 |
3.1 |
2% |
8% |
3% |
0% |
Custodian |
114 |
471 |
1.10 |
5.8 |
-1% |
-2% |
-1% |
-5% |
Picton |
93 |
507 |
0.98 |
3.8 |
3% |
7% |
11% |
-8% |
Real Estate Investors |
53 |
99 |
0.77 |
7.0 |
-2% |
0% |
-4% |
-9% |
Regional REIT |
108 |
466 |
0.94 |
7.5 |
2% |
3% |
9% |
-2% |
Schroder REIT |
54 |
280 |
0.79 |
4.8 |
-3% |
2% |
-2% |
-9% |
UK Commercial Property Trust |
88 |
1140 |
0.97 |
4.2 |
1% |
7% |
7% |
-6% |
BMO Commercial Property Trust |
119 |
948 |
0.89 |
5.1 |
1% |
8% |
-12% |
-13% |
BMO Real Estate Investments |
86 |
206 |
0.82 |
5.8 |
0% |
1% |
-3% |
-14% |
Average |
0.89 |
5.2 |
1% |
4% |
1% |
-7% |
||
Palace Capital |
284 |
131 |
0.73 |
6.7 |
-6% |
3% |
-4% |
-14% |
UK property index |
1,872 |
3.6 |
3% |
14% |
16% |
-1% |
||
FTSE All-Share Index |
4,067 |
4.7 |
1% |
2% |
6% |
-3% |
||
Source: Company data, Refinitiv. Note: Prices at 29 November 2019. *Based on last reported EPRA NAV per share. **Based on trailing 12-month DPS declared.
In Exhibit 10, we show a summary performance and valuation comparison of Palace and a peer group of UK commercial real estate investment companies with a strong regional focus. Reflecting the balance sheet liquidity and a comfortable level of gearing, and the expectation of future recurring income growth, Palace has maintained its attractive dividend payout, which represents a yield of 6.7%, above the average for the peer group. The discount to NAV at which Palace shares trade (27%) is also noticeably larger than for the peer group average (c 11%). Within the peer group, the companies with the higher P/NAVs tend to be REITs with a strong focus on income returns (in contrast to Palace’s total return strategy) and we believe that this higher rating results from investors’ continuing search for sustainable income, and perhaps due to concerns about the maturity of the economic and commercial property cycle. REIT conversion may well underline Palace’s strong commitment to attractive dividends, while investing to grow the portfolio and enhance capital values. Given the strong track record of total return generation and the potential to drive further returns from the existing portfolio, the Palace valuation continues to appear undemanding.
Exhibit 11: Financial summary
Year end 31 March (£000s) |
2017 |
2018 |
2019 |
2020e |
2021e |
2022e |
PROFIT & LOSS |
||||||
Rental & other income |
14,266 |
16,733 |
18,750 |
20,722 |
18,074 |
19,056 |
Non-recoverable property costs |
(2,055) |
(1,824) |
(2,318) |
(2,464) |
(2,350) |
(2,250) |
Net rental income |
12,211 |
14,909 |
16,432 |
18,258 |
15,724 |
16,806 |
Dividend income from listed equity investments |
43 |
53 |
0 |
0 |
||
Administrative expenses before share-based payments |
(2,678) |
(4,011) |
(3,790) |
(3,943) |
(3,700) |
(3,820) |
Share-based payments |
(237) |
(174) |
(332) |
(250) |
(300) |
(300) |
Operating Profit (before capital items) |
9,296 |
10,724 |
12,353 |
14,118 |
11,724 |
12,686 |
Revaluation of investment properties |
3,101 |
5,738 |
(382) |
(5,552) |
11,532 |
1,317 |
Gains/(losses) on disposals |
3,191 |
274 |
(652) |
(24) |
0 |
0 |
Loss on revaluation of listed equity investments |
(214) |
101 |
0 |
0 |
||
Operating Profit |
15,588 |
16,736 |
11,105 |
8,643 |
23,256 |
14,003 |
Net finance expense |
(3,011) |
(3,432) |
(4,672) |
(4,996) |
(3,899) |
(4,019) |
Profit Before Tax |
12,577 |
13,304 |
6,433 |
3,648 |
19,357 |
9,984 |
Taxation |
(3,191) |
(773) |
(1,263) |
3,729 |
0 |
0 |
Profit After Tax (FRS 3) |
9,386 |
12,531 |
5,170 |
7,377 |
19,357 |
9,984 |
EPRA adjustments: |
||||||
Revaluation of investment properties |
(3,101) |
(5,738) |
382 |
5,857 |
(11,532) |
(1,317) |
Gains/(losses) on disposals |
(3,191) |
(274) |
652 |
24 |
0 |
0 |
Deferred tax charge |
2,200 |
(299) |
243 |
0 |
0 |
0 |
Other adjustments |
155 |
308 |
1,143 |
1,063 |
0 |
0 |
EPRA earnings |
5,449 |
6,528 |
7,590 |
14,320 |
7,825 |
8,667 |
Adjusted for: |
||||||
Non-recurring items |
0 |
698 |
0 |
(2,850) |
0 |
0 |
Share-based payments |
237 |
174 |
332 |
250 |
300 |
300 |
Adjusted earnings |
5,686 |
7,400 |
7,922 |
11,720 |
8,125 |
8,967 |
Company adjusted PBT |
6,677 |
8,472 |
8,942 |
7,991 |
8,125 |
8,967 |
Average fully diluted number of shares outstanding (000s) |
25,738 |
34,980 |
45,898 |
46,020 |
46,069 |
46,069 |
Basic EPS - FRS 3 (p) |
36.5 |
35.8 |
11.3 |
14.8 |
42.0 |
21.7 |
Fully diluted EPRA EPS (p) |
21.2 |
18.7 |
16.5 |
22.4 |
17.0 |
18.8 |
Fully diluted adjusted EPS (p) |
22.2 |
21.2 |
17.3 |
16.7 |
17.6 |
19.5 |
Dividend per share declared (p) |
18.5 |
19.0 |
19.0 |
19.0 |
19.0 |
19.0 |
EPRA dividend cover (x) |
1.14 |
0.98 |
0.87 |
1.18 |
0.89 |
0.99 |
BALANCE SHEET |
||||||
Fixed Assets |
183,959 |
253,984 |
261,064 |
266,691 |
279,194 |
284,511 |
Investment properties |
183,916 |
253,863 |
258,331 |
263,139 |
275,642 |
280,959 |
Goodwill |
0 |
0 |
0 |
0 |
0 |
0 |
Other non-current assets |
43 |
121 |
2,733 |
3,552 |
3,552 |
3,552 |
Current Assets |
13,692 |
46,292 |
55,256 |
40,136 |
63,354 |
29,781 |
Trading properties |
0 |
0 |
14,367 |
27,137 |
52,250 |
0 |
Assets held for sale |
0 |
21,708 |
11,756 |
0 |
0 |
0 |
Cash |
11,181 |
19,033 |
22,890 |
7,710 |
5,540 |
23,761 |
Other current assets |
2,511 |
5,551 |
6,243 |
5,288 |
5,564 |
6,021 |
Current Liabilities |
(8,197) |
(11,520) |
(16,000) |
(9,158) |
(13,169) |
(9,577) |
Creditors |
(6,161) |
(8,834) |
(10,001) |
(7,322) |
(11,333) |
(7,741) |
Short term borrowings |
(2,036) |
(2,686) |
(5,999) |
(1,836) |
(1,836) |
(1,836) |
Long Term Liabilities |
(79,895) |
(105,457) |
(119,997) |
(119,005) |
(139,905) |
(113,805) |
Long term borrowings |
(75,758) |
(97,157) |
(112,017) |
(115,226) |
(137,126) |
(111,026) |
Deferred tax |
(2,187) |
(6,531) |
(5,580) |
(204) |
796 |
796 |
Other long-term liabilities |
(1,950) |
(1,769) |
(2,400) |
(3,575) |
(3,575) |
(3,575) |
Net Assets |
109,559 |
183,299 |
180,323 |
178,664 |
189,474 |
190,911 |
EPRA net assets |
111,759 |
190,011 |
186,968 |
180,203 |
190,013 |
191,450 |
Basic NAV/share (p) |
436 |
400 |
393 |
388 |
412 |
415 |
Diluted EPRA NAV/share (p) |
443 |
414 |
407 |
391 |
412 |
416 |
CASH FLOW |
||||||
Operating Cash Flow |
10,294 |
9,899 |
11,920 |
12,551 |
15,661 |
8,836 |
Net Interest |
(2,516) |
(2,704) |
(3,385) |
(3,946) |
(4,379) |
(3,619) |
Tax |
(1,047) |
(395) |
(1,639) |
(1,554) |
(1,000) |
0 |
Net cash from investing activities |
(3,352) |
(67,725) |
(11,560) |
(12,241) |
(25,204) |
48,250 |
Ordinary dividends paid |
(4,617) |
(6,744) |
(8,718) |
(8,737) |
(8,747) |
(8,747) |
Debt drawn/(repaid) |
6,467 |
8,151 |
17,954 |
(1,246) |
21,500 |
(26,500) |
Proceeds from shares issued |
29 |
70,000 |
0 |
0 |
0 |
0 |
Other cash flow from financing activities |
(2,897) |
(3,434) |
(162) |
(627) |
0 |
0 |
Net Cash Flow |
2,361 |
7,048 |
4,410 |
(15,800) |
(2,170) |
18,220 |
Opening balance sheet cash |
8,576 |
10,937 |
17,985 |
22,395 |
6,595 |
4,426 |
Restricted cash |
244 |
1,048 |
495 |
1,115 |
1,115 |
1,115 |
Other items (including cash assumed on acquisition) |
0 |
0 |
0 |
0 |
0 |
0 |
Closing balance sheet cash |
11,181 |
19,033 |
22,890 |
7,710 |
5,541 |
23,761 |
Closing balance sheet debt |
77,794 |
99,843 |
118,016 |
117,062 |
138,962 |
112,862 |
Unamortised debt costs |
936 |
1,552 |
1,334 |
1,041 |
641 |
241 |
Closing net debt/(cash) |
67,549 |
82,362 |
96,460 |
110,393 |
134,062 |
89,342 |
Net LTV (exc restricted cash & adjusted for unamortised debt costs) |
36.9% |
29.8% |
33.7% |
37.8% |
40.7% |
31.6% |
Source: Palace Capital data, Edison Investment Research forecasts
|
|
Research: Healthcare
Following an interaction with the FDA, BioPorto announced on 18 November 2019 that it will need to gather more data to complete the 510(k) application for the paediatric NGAL Test. The company expects this process to take several months and to resubmit its application in Q220. The feedback from the FDA has implications relating to the ongoing adult NGAL study, which is now expected to be submitted after the paediatric application (pushed back from Q419).