Last close As at 05/08/2026
GBP4.98
▲ −1.00 (−0.20%)
Market capitalisation
GBP990m
Research: Investment Companies
Invesco Asia Trust
Invesco Asia Trust |
Sustained outperformance versus benchmark |
Investment trusts |
9 December 2016 |
Share price/discount performance
Three-year performance vs index
Gearing
Analysts
|
|||||||||||||||||||||||||||||||||||||||||||||||||||||||||||||||||||||||||||||||||
Invesco Asia Trust (IAT) aims to generate long-term capital growth from investment in Asia ex-Japan equities across the capitalisation spectrum. The portfolio of c 60 stocks is diversified by sector and geography. IAT’s NAV total return has outperformed its MSCI AC Asia ex-Japan benchmark over one, three, five and 10 years. Near-term absolute returns have been particularly strong, having been enhanced by a fall in the value of sterling. IAT’s board actively manages the share price discount to ex-income NAV via tender offers and share repurchases. Annual dividends have been maintained or increased every year since 2001; the current yield is 1.6%.
12 months ending |
Share price |
NAV |
Benchmark* |
MSCI World |
FTSE All-Share (%) |
30/11/12 |
5.4 |
12.3 |
16.8 |
12.2 |
12.1 |
30/11/13 |
14.1 |
9.1 |
5.9 |
24.3 |
19.8 |
30/11/14 |
19.0 |
19.7 |
8.7 |
14.5 |
4.7 |
30/11/15 |
(5.9) |
(5.7) |
(8.4) |
3.9 |
0.6 |
30/11/16 |
30.8 |
32.8 |
29.5 |
25.0 |
9.8 |
Source: Thomson Datastream. Note: Twelve-month rolling discrete £-adjusted total return performance. *Benchmark is MSCI AC Asia Pacific ex-Japan until 30 April 2015 and MSCI AC Asia ex-Japan thereafter.
Investment strategy: Seeking undervalued companies
Manager Ian Hargreaves conducts in-depth, bottom-up research, aiming to identify companies with attractive fundamentals that are trading at a discount to the expected value of their underlying businesses. Currently c 25% of the portfolio is in small-cap (sub-$2bn) companies. Stock selection also takes into account the manager’s top-down views. He is able to draw on the resources of the Invesco Perpetual Asia-Pacific team; all five members regularly travel to Asia and meeting company managements is a key element of the investment process. Gearing of up to 25% of net assets is permitted, but in practice is between 0% and 5%.
Market outlook: Valuations relatively attractive
Following a strong run up, there has been a recent pullback in Asian stock markets as a result of the outcome of the US presidential election, meaning the relative valuation of Asian versus world equities is looking more attractive. The 12.5x forward earnings multiple of Asian stocks compares to 15.1x for global equities; the c 17% discount is towards the bottom end of the five-year range. Investors looking for exposure to a region with above-average economic growth may wish to consider a fund that is diversified by market cap, sector and geography and has a positive relative performance track record.
Valuation: Proposed tender offer
IAT’s current 12.1% share price discount to ex-income NAV is modestly above the averages of the last one, three, five and 10 years (range of 9.5% to 10.4%). The board actively manages the discount via tender offers and share repurchases. It has recently confirmed that a conditional tender offer for up to 15% of shares outstanding at a 2% discount to NAV (minus costs) will be triggered if the average discount for H216 (ending 30 April 2017) is higher than 9.3%.
Exhibit 1: Trust at a glance
Investment objective and fund background |
Recent developments |
||||||||||||||||||||||||||||||||||||||||||||||||||||||||||||||||||||||
IAT’s objective is to provide long-term capital growth by investing in a diversified portfolio of Asian companies. On 1 May 2015 the trust adopted a new benchmark, MSCI AC Asia ex-Japan, in place of the former benchmark, MSCI AC Asia Pacific ex-Japan. While the new benchmark excludes Australasia, the trust may still invest in these markets. |
■ 25 November 2016: Appointment of Fleur Meijs as non-executive director, effective 7 December 2016. ■ 2 November 2016: Six-month performance update to 31 October 2016. NAV TR 33.6% vs benchmark TR 32.1%, share price TR 37.1%. ■ 28 June 2016: Dividend of 3.65p declared for FY16, unchanged versus FY15. ■ 28 June 2016: Annual report for 12 months ended 30 April 2016. NAV TR |
||||||||||||||||||||||||||||||||||||||||||||||||||||||||||||||||||||||
Forthcoming |
Capital structure |
Fund details |
|||||||||||||||||||||||||||||||||||||||||||||||||||||||||||||||||||||
AGM |
August 2017 |
Ongoing charges |
1.03% (30 September 2016) |
Group |
Invesco Asset Management Ltd |
||||||||||||||||||||||||||||||||||||||||||||||||||||||||||||||||||
Interim results |
December 2016 |
Net gearing |
0.4% |
Manager |
Ian Hargreaves |
||||||||||||||||||||||||||||||||||||||||||||||||||||||||||||||||||
Year end |
30 April |
Annual mgmt fee |
0.75% of net assets |
Address |
125 London Wall |
||||||||||||||||||||||||||||||||||||||||||||||||||||||||||||||||||
Dividend paid |
July/August |
Performance fee |
None |
||||||||||||||||||||||||||||||||||||||||||||||||||||||||||||||||||||
Launch date |
July 1995 |
Trust life |
Indefinite |
Phone |
+44 (0)20 3753 1000 |
||||||||||||||||||||||||||||||||||||||||||||||||||||||||||||||||||
Continuation vote |
Three-yearly, next in 2019 |
Loan facilities |
£20m multi-currency |
Website |
|||||||||||||||||||||||||||||||||||||||||||||||||||||||||||||||||||
Dividend policy and history |
Share buyback policy and history |
||||||||||||||||||||||||||||||||||||||||||||||||||||||||||||||||||||||
Dividends are paid annually in July/August. Income is a by-product of stock selection and there is no yield target. |
Renewed annually, the trust has authority to purchase up to 14.99% and allot up to 5% of issued share capital. Financial years shown. Includes tender offers and exercise of warrants. |
||||||||||||||||||||||||||||||||||||||||||||||||||||||||||||||||||||||
|
|
||||||||||||||||||||||||||||||||||||||||||||||||||||||||||||||||||||||
Shareholder base (as at 31 October 2016) |
Portfolio exposure by geography (as at 31 October 2016) |
||||||||||||||||||||||||||||||||||||||||||||||||||||||||||||||||||||||
|
|
||||||||||||||||||||||||||||||||||||||||||||||||||||||||||||||||||||||
Top 10 holdings (as at 31 October 2016) |
|||||||||||||||||||||||||||||||||||||||||||||||||||||||||||||||||||||||
|
|||||||||||||||||||||||||||||||||||||||||||||||||||||||||||||||||||||||
Source: Invesco Asia Trust, Edison Investment Research, Morningstar, Bloomberg. Note: *N/A where not in October 2015 top 10.
Market outlook: Valuations remain relatively attractive
Exhibit 2 (left-hand side) shows the performance of global, UK and Asian ex-Japan stocks over the last five years; Asian stocks have recently weakened following the result of the US presidential election, given a lack of clarity regarding US policies and their potential impact on Asian economies. As a result, valuations in the region have become relatively more attractive (Exhibit 2, right-hand side). Based on the Datastream Asia ex-Japan and World indices, Asian stocks are trading at a forward P/E multiple of 12.5x, which is a 17.2% discount to global equities, towards the low end of the five-year range. For investors wishing to have equity exposure to a region with relatively higher economic growth, a fund with a positive performance track record may hold appeal.
|
Exhibit 2: Market performance and valuation |
|
Five-year performance of World, UK and Asia ex-Japan indices (all in £) |
DS Asia ex-Japan vs DS World valuation comparison |
|
|
|
Source: Thomson Datastream, Edison Investment Research |
|
Fund profile: Specialist investment in Asia-Pacific
IAT was launched in July 1995 and aims to generate long-term capital growth by investing in a diversified portfolio of Asia ex-Japan and Australasian securities. Up to 10% of gross assets may be invested in unquoted securities and exposure to any one company may not exceed 10% of total assets at the time of purchase. Gearing of up to 25% of net assets is permitted, although it has typically been in a range of 0-5%. IAT is managed by Ian Hargreaves. He has been the sole manager since 1 January 2015; he was previously co-manager with Invesco Perpetual’s head of Asian equities, Stuart Parks. The portfolio is actively managed and diversified by geography and sector. IAT is benchmarked against the MSCI AC Asia ex-Japan index; prior to 1 May 2015, it was against the MSCI AC Asia-Pacific ex-Japan index – it was changed to bring IAT in line with most of its peers, while giving it a more representative benchmark given its historically large underweight Australian exposure.
The fund manager: Ian Hargreaves
The manager’s view: We are in a period of uncertainty
Manager Ian Hargreaves comments that, following the result of the US presidential election, the US stock market has rallied. Bond yields and the dollar have risen and there has been a change in stock market leadership from growth to value. During 2016, there had already been significant sector rotation, with commodities and energy stocks rallying on the back of higher commodity prices, but now financials are performing better as there is perceived to be less pressure on net interest margins, as can be seen in the shape of the yield curve. There has been a change in leadership across all global equity markets including Asia, where bank and insurance stocks have moved higher.
The manager suggests that there are huge uncertainties regarding US policies and people need to wait and see if Trump wants to, or is able to, deliver on his pre-election promises. How the Federal Reserve responds to the changing political environment will also be critical for Asia. For example, an environment of rising interest rates would not be a great environment for Asian companies, as it increases their cost of capital; a rise in US protectionism would also be negative for the Asian region. The manager expects that US fiscal policy will become looser, but the magnitude is uncertain including the levels of tax cuts or amount of infrastructure spending. In addition, there may be a lag between higher interest rates and higher spending, which could lead to a period of weakness in the US economy, which would be detrimental for Asian exports.
Given the uncertain environment, the manager considers it prudent to only make modest changes to the portfolio on a stock-by-stock basis. He added to IAT’s financial exposure ahead of the US election, as valuations were attractive and investor sentiment was low. Asian stock markets have weakened in the short term as investors do not like uncertainty and companies are facing a higher cost of capital; highly valued companies have seen their shares come under the most pressure. The recent weakness follows a period of better stock market performance in Q316 as a result of a better earnings backdrop. Over the last few months, earnings estimates in aggregate have stopped being downgraded, due in part to firming commodity prices. In addition, over the last four years, companies have been operating in an environment of low earnings growth, so there is increasing evidence of cost cutting and more careful spending on capex, which is supportive to earnings.
Asset allocation
Investment process: Unconstrained, bottom-up stock selection
The manager adopts an unconstrained, flexible investment approach combining an assessment of the macro environment with bottom-up fundamental analysis; portfolio sector and geographic exposure may differ considerably from the benchmark. Hargreaves analyses a company’s key historical and future business drivers including product demand and pipeline, pricing power, cash flow generation and the strength of the balance sheet to determine its competitive position and the quality of the management team. The manager selects companies with positive fundamentals, where their growth potential is underappreciated by the market; the resulting portfolio is relatively concentrated containing c 60 stocks. Over time, he has broadened his investible universe to include smaller-cap stocks (below $2bn). These companies are often under-researched and may trade at cheaper valuations versus the broader market. The manager comments that small-cap stocks have made a positive contribution to investment performance and currently account for c 25% of the portfolio. He is able to draw on the resources of the Invesco Perpetual Asia-Pacific investment team, which comprises five investment professionals with an average of 20 years’ industry experience. Each member travels to the region three or four times a year, meaning that the team meets with several hundred companies each year.
Current portfolio positioning
At end-October 2016, the top 10 holdings accounted for 38.8% of the portfolio. Samsung was the largest holding at c 7%, but has recently been trimmed following a period of outperformance. The manager is maintaining a position as despite the costs involved for the recall of the Galaxy Note 7 smartphone, the company appears to have suffered modest reputational damage. The outlook for semiconductor demand is robust and Samsung has a dominant position in high-growth organic light-emitting diode (OLED) screens. Despite the recent stock price appreciation, the manager considers that Samsung’s valuation remains attractive. At its recent investor day, the company announced that it is considering dividing into two companies to highlight the value of its assets and is continuing to return cash to shareholders; half of 2016 and 2017 free cash flow will be returned.
Exhibit 3: Portfolio sector exposure vs benchmark (% unless stated)
Portfolio end-October 2016 |
Portfolio end-October 2015 |
Change (pp) |
Index weight |
Active weight vs index (pp) |
Trust weight/ index weight (x) |
|
Information technology |
32.5 |
25.5 |
7.0 |
27.7 |
4.8 |
1.2 |
Financials |
19.9 |
25.6 |
-5.7 |
23.6 |
-3.7 |
0.8 |
Consumer discretionary |
12.0 |
12.1 |
-0.1 |
9.4 |
2.5 |
1.3 |
Industrials |
9.5 |
12.1 |
-2.6 |
8.0 |
1.5 |
1.2 |
Materials |
6.7 |
6.1 |
0.6 |
4.3 |
2.4 |
1.6 |
Real estate |
5.7 |
6.5 |
-0.8 |
6.0 |
-0.3 |
1.0 |
Telecommunications |
5.6 |
5.8 |
-0.2 |
5.7 |
-0.1 |
1.0 |
Utilities |
4.2 |
1.9 |
2.3 |
3.7 |
0.5 |
1.1 |
Energy |
3.1 |
4.1 |
-1.0 |
4.2 |
-1.1 |
0.7 |
Consumer staples |
1.0 |
0.3 |
0.7 |
5.0 |
-4.0 |
0.2 |
Healthcare |
0.0 |
0.0 |
0.0 |
2.5 |
-2.5 |
0.0 |
100.0 |
100.0 |
100.0 |
Source: Invesco Asia Trust, Edison Investment Research
Looking at sector exposure in Exhibit 3, versus the benchmark the largest overweight is technology and the largest underweight is consumer staples, where the manager considers that company valuations are generally unattractive. On a geographic basis, IAT’s largest overweight exposures are in India (where the manager suggests that economic activity has bottomed and the government is cracking down on the black economy) and South Korea, while it has zero exposure in the relatively small markets of Malaysia and Thailand.
Recent additions to the portfolio include Finetex EnE (July 2016), Nexon and Asaleo Care (both September 2016). Finetex is a Korean small-cap company; it is the only manufacturer in the world producing nanofiber on a commercial basis. Nanofiber is used as a coating in filtration products and fabric, allowing air in/out while keeping out water and other particles. Finetex has recently received a potentially transformational order from Nike for a range of sportswear and footwear lines in 2017. Nexon is a Korean computer gaming company with a strong pipeline of products; it is benefiting from the shift in gaming from PC to mobile devices. It was purchased for 10x forward earnings and has c 20% cash on its balance sheet. Asaleo is an Australian manufacturer of personal care products; the manager took advantage of a 30% fall in the share price following a reduction in earnings guidance on the back of a tough competitive pricing environment. The stock is now attractively valued versus its growth prospects and the company is returning a significant amount of cash to shareholders.
Performance: Consistent relative outperformance
|
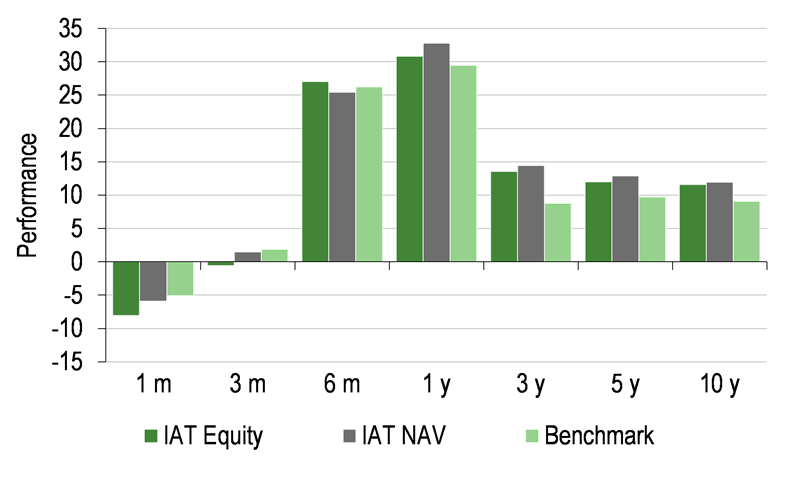
Exhibit 4: Investment trust performance to 30 November 2016 |
|
Price, NAV and benchmark total return performance, one-year rebased |
Price, NAV and benchmark total return performance (%) |
|
|
|
Source: Thomson Datastream, Edison Investment Research. Note: Three, five and 10-year performance figures annualised. Benchmark is MSCI AC Asia Pacific ex-Japan until 30 April 2015 and MSCI AC Asia ex-Japan thereafter. |
|
As shown in Exhibit 4 (right-hand side), IAT’s absolute returns (expressed in sterling) have been very strong over the last six months (although weaker in the very short term); its share price and NAV total returns of 27.1% and 25.4% have been markedly enhanced by the weakness of sterling.
Exhibit 5: Share price and NAV total return performance, relative to indices (%)
|
One month |
Three months |
Six months |
One year |
Three years |
Five years |
10 years |
Price relative to benchmark |
(3.1) |
(2.5) |
0.6 |
1.1 |
13.6 |
10.6 |
25.3 |
NAV relative to benchmark |
(0.9) |
(0.4) |
(0.7) |
2.6 |
16.3 |
15.2 |
29.0 |
Price relative to FTSE All-Share |
(6.5) |
(1.2) |
15.9 |
19.2 |
26.6 |
13.4 |
77.4 |
NAV relative to FTSE All-Share |
(4.4) |
0.9 |
14.4 |
21.0 |
29.5 |
18.1 |
82.6 |
Source: Thomson Datastream, Edison Investment Research. Note: Data to end-November 2016. Geometric calculation.
IAT has outperformed its benchmark over most of the periods shown in Exhibit 5; over 10 years its share price and NAV have outperformed by more than 2.5% per annum. Prior to 1 May 2015, the benchmark was the MSCI AC Asia Pacific ex-Japan index; it was changed to the MSCI AC Asia ex-Japan, which excludes Australasia, although the manager is still permitted to invest in this region. Of interest to UK investors, IAT has significantly outperformed the FTSE All-Share index over one, three, five and 10 years, particularly over one, three and 10 years.
|
Exhibit 6: NAV total return performance relative to benchmark over three years |
|
|
Source: Thomson Datastream, Edison Investment Research |
Discount: Modestly above historical averages
IAT’s current 12.1% share price discount to ex-income NAV is modestly above the 10.4% average of the last 12 months. Over the last year, the discount ranged from 7.3% to 14.2% – a five-year high, which occurred on 24 June 2016 following the Brexit vote (the result of the referendum led to a period of generally wider discounts for investment trusts). The current discount is also modestly wider than the averages of the last three, five and 10 years of 9.8%, 9.9% and 9.5%, respectively.
|
Exhibit 7: Share price discount to NAV (excluding income) over three years (%) |
|
|
Source: Thomson Datastream, Edison Investment Research |
The board aims to keep the discount below 10% and a tender offer may be triggered if the average discount over a financial year exceeds this level. The last tender offer was in 2013, but on 2 November 2016, IAT confirmed its proposal for a conditional tender offer. Given that the average discount in H116 was above the 10% threshold, unless the shares trade at an average discount (ex-income) of less than 9.3% in H216, a tender offer for up to 15% of shares outstanding at a 2% discount to NAV (less costs of the tender) will be triggered.
Share repurchases are also made on an ad hoc basis, to manage the discount. In the 11 months to end-November 2016, 3.3m shares were repurchased (3.8% of the share count) at a cost of £6.3m.
Capital structure and fees
IAT is a conventional investment trust with one class of share; there are currently 83.6m ordinary shares in issue. It has a 364-day revolving credit facility with Bank of New York Mellon based on the lower of 25% of net asset value and £20m at an interest rate of Libor +0.85%. Gearing of up to 25% of net assets is permitted, but in practice is in a range of 0-5%; at end-October 2016 it was 0.4%.
Invesco Fund Managers provide IAT with investment management and administrative services; the annual management fee is 0.75% per annum of net assets (excluding the value of any investment in funds managed by Invesco). This is allocated 75% and 25% from capital and income, respectively, which is in line with the board’s expected split between long-term returns from capital gains and income; no performance fee is payable. In FY16 (end-April 2016) ongoing charges were 1.02%, a 4bp decrease versus the prior year.
At the August 2016 AGM, a resolution was passed releasing the obligation to wind up the trust. The next continuation vote will be at the August 2019 AGM.
Dividend policy and record
IAT aims to grow capital over the long term; there is no specific income requirement. However, annual dividends, which are paid in July or August, have been maintained or grown consistently since 2001. Over the last five years, dividends have compounded at an average annual rate of c 5%, which is above the level of UK inflation.
The FY16 dividend of 3.65p per share was in line with the prior year; it was 0.94x covered by income. At the last financial year end, revenue reserves were £5.7m, a 3.7% decline versus the prior year, but this amounts to 1.8x the 2016 annual dividend. Based on the current share price, IAT has a dividend yield of 1.6%, which is higher than the average of its close peer group.
Peer group comparison
Exhibit 8 shows the AIC Asia Pacific ex-Japan sector excluding three trusts that have an income mandate and a smaller trust with a shorter performance track record. Since our last note published in June 2016, Asian equities are significantly higher, as commodity prices have rallied and returns to sterling-based investors have been enhanced by sterling weakness. IAT’s NAV total returns are ahead of the weighted average peer group over one, three, five and 10 years, ranking second, third fifth and fourth out of 12 trusts respectively. In terms of risk-adjusted returns, as measured by the Sharpe ratio, IAT is in line with the average over one year and ahead over three years (in the top third). Its discount is wider than average. IAT’s ongoing charge is lower than average, and in line with the majority of peers, and no performance fee is payable. Its gearing is lower than average and it has a higher than average dividend yield.
Exhibit 8: Selected peer group as at 08 December 2016
% unless stated |
Market cap £m |
NAV TR 1 Year |
NAV TR 3 Year |
NAV TR 5 Year |
NAV TR 10 Year |
Sharpe 1y (NAV) |
Sharpe 3y (NAV) |
Discount (ex-par) |
Ongoing charge |
Perf. fee |
Net gearing |
Dividend yield (%) |
Invesco Asia |
187.3 |
34.1 |
52.3 |
79.9 |
211.6 |
0.8 |
0.4 |
(13.5) |
1.0 |
No |
100 |
1.6 |
Aberdeen Asian Smaller |
329.7 |
31.6 |
26.3 |
93.0 |
311.3 |
1.1 |
(0.2) |
(14.7) |
1.8 |
No |
109 |
1.1 |
Aberdeen New Dawn |
219.6 |
33.7 |
24.5 |
46.5 |
154.7 |
0.7 |
(0.2) |
(14.8) |
1.1 |
No |
111 |
2.1 |
Edinburgh Dragon |
559.1 |
31.6 |
27.7 |
48.6 |
169.0 |
0.6 |
(0.1) |
(14.6) |
1.1 |
No |
109 |
1.1 |
Fidelity Asian Values |
225.4 |
41.9 |
59.5 |
98.8 |
235.3 |
1.6 |
0.6 |
(10.4) |
1.3 |
No |
101 |
1.4 |
JPMorgan Asian |
253.1 |
32.7 |
38.7 |
57.6 |
112.5 |
0.7 |
0.2 |
(14.8) |
0.8 |
No |
102 |
0.9 |
Martin Currie Asia Unconstrained |
115.3 |
31.1 |
25.2 |
42.5 |
82.0 |
0.6 |
(0.1) |
(16.0) |
1.2 |
No |
104 |
2.4 |
Pacific Assets |
280.4 |
26.8 |
53.3 |
106.2 |
170.9 |
0.6 |
0.6 |
(0.1) |
1.3 |
No |
100 |
0.9 |
Pacific Horizon |
112.1 |
22.2 |
27.8 |
49.1 |
113.0 |
0.2 |
0.0 |
(12.4) |
1.1 |
No |
97 |
0.2 |
Schroder Asia Pacific |
554.7 |
31.9 |
47.8 |
77.8 |
195.5 |
0.8 |
0.4 |
(13.0) |
1.1 |
No |
101 |
1.3 |
Schroder Asian TR Inv. Company |
181.1 |
30.8 |
51.1 |
67.4 |
141.0 |
1.0 |
0.6 |
(5.5) |
1.0 |
Yes |
111 |
1.5 |
Scottish Oriental Smaller Cos |
271.8 |
28.2 |
35.4 |
94.4 |
333.4 |
0.5 |
0.1 |
(15.5) |
1.0 |
Yes |
91 |
1.3 |
Weighted average |
31.6 |
39.2 |
73.3 |
196.6 |
0.8 |
0.2 |
(12.3) |
1.2 |
103 |
1.3 |
||
Trust rank in sector (12) |
9 |
2 |
3 |
5 |
4 |
5 |
4 |
6 |
10 |
9 |
3 |
Source: Morningstar, Edison Investment Research. Note: TR=total return. Sharpe ratio is a measure of risk-adjusted return. The ratios shown are calculated by Morningstar for the past 12- and 36-month periods by dividing a fund’s annualised excess returns over the risk-free rate by its annualised standard deviation. Net gearing is total assets less cash and equivalents as a percentage of net assets.
The board
There are currently five directors on the IAT board; all are non-executive and independent of the manager. Chairman Carol Ferguson was appointed in March 2009 and assumed her current role in August 2013. The other board members and their dates of appointment are James Robinson (January 2007), Tom Maier (March 2009) and Owen Jonathan (March 2013). The directors have backgrounds in investment and law. On 25 November, IAT announced the appointment of a fifth director, Fleur Meijs, effective 7 December 2016. She is a chartered accountant with experience of complex audits at major financial institutions.
|
|
Euromoney Institutional Investor