Last close As at 05/08/2026
GBP0.72
▲ −1.00 (−1.37%)
Market capitalisation
GBP179m
Research: Industrials
The interim H123 results highlight continued growth in adjusted operating profit, management’s solid control of the business and the ongoing annual efficiencies being delivered. Furthermore, development of new profit streams are beginning to create momentum, which we expect should offset the anticipated decline in core revenues and support the payment of the dividend. This follows the signing of numerous long-term publisher contracts recently, which collectively account for 65% of current revenues. Additional contract renewals could be secured this year. These renewals bolster the company’s cash-generative business model, providing a steady stream of revenue up to 2029 or 2030. Our valuation remains unchanged at 89p, representing c 80% upside.
Smiths News |
Interim profits exceed pre-COVID levels |
Interim results |
Industrial support services |
9 May 2023 |
Share price performance
Business description
Next events
Analyst
Smiths News is a research client of Edison Investment Research Limited |
|||||||||||||||||||||||||||||||||||||||||||||||
The interim H123 results highlight continued growth in adjusted operating profit, management’s solid control of the business and the ongoing annual efficiencies being delivered. Furthermore, development of new profit streams are beginning to create momentum, which we expect should offset the anticipated decline in core revenues and support the payment of the dividend. This follows the signing of numerous long-term publisher contracts recently, which collectively account for 65% of current revenues. Additional contract renewals could be secured this year. These renewals bolster the company’s cash-generative business model, providing a steady stream of revenue up to 2029 or 2030. Our valuation remains unchanged at 89p, representing c 80% upside.
Year end |
Revenue (£m) |
PBT* |
EPS* |
DPS |
P/E |
Yield |
08/21 |
1,109.6 |
31.9 |
11.3 |
1.5 |
4.6 |
2.9 |
08/22 |
1,089.3 |
32.3 |
11.7 |
4.2 |
4.5 |
8.0 |
08/23e |
1,056.6 |
33.1 |
11.0 |
4.2 |
4.7 |
8.0 |
08/24e |
1,024.9 |
33.5 |
10.8 |
4.2 |
4.8 |
8.0 |
Note: *PBT and EPS are normalised, excluding amortisation of acquired intangibles, exceptional items and share-based payments.
Strong interim results underpin FY23 consensus
Smiths News reported revenue growth of 1% to £550.1m in H1, driven by inflation-related price increases in newspapers in particular and revenue from one shot and ancillary sales. Adjusted operating profit rose 6.8% y-o-y to £20.4m, benefiting from the revenue growth trends, and operational efficiencies that continue to target savings of c £4–5m pa. The operating margin edged up 20bp to 3.7%. Adjusted EPS rose 9.8% to 5.6p and the company declared a 1.4p dividend, in line with both last year and the maximum payable under current banking facilities. Net debt at the half year fell 41% to £22.9m, while average net debt fell 55.3% to £26.3m.
New profit streams begin to make contribution
Smiths News recently trialled a service collecting waste cardboard and plastic for recycling at the same time as delivering the day’s newspapers and magazines. The trial was successful and is now being rolled out nationally. We anticipate that the service might be suitable for c 30% of its addressable customer base of c 12,000 retailers. Another successful trial includes the distribution of DVDs and books to major retailers and some supermarkets. There are potentially other products and/or customers where this kind or service may offer value to clients and a profit contribution to Smiths, which could offset the expected decline in the core business.
Valuation: DCF valuation unchanged at 89p
Our underlying estimates are unchanged and we therefore also retain our DCF valuation of Smiths News at 89p/share, representing c 70% upside to the current share price. The company trades on P/E multiples of 4.7x in FY23e and 4.8x in FY24e, which we believe are attractive for a company with such cash-generative characteristics. It also yields 8.0% from a dividend that is more than twice covered by earnings.
Real signs of strategic success
Growth in revenue, and especially continued growth in adjusted operating profit, highlights management’s solid control of the business and the ongoing annual efficiencies that are being delivered. These robust results follow the signing of numerous long-term publisher contracts recently, which collectively account for 65% of current revenues. Additional contract renewals could be secured this year. Furthermore, development of new profit streams, although modest in size so far, are beginning to create momentum across the group that should contribute profits that can offset anticipated declines in core revenue and support the payment of the dividend, which itself gives rise to an attractive 8.0% yield. Our full year forecasts are unchanged and we retain our 89p valuation.
First period of revenue and profit growth since H221
Smiths News reported revenue growth of 1% to £550.1m in H1, the first period of growth since H221, which was the COVID-19 recovery period. Revenue growth was driven by inflation-related price increases in newspapers in particular and revenue from one shot and ancillary sales. Adjusted operating profit rose 6.8% y-o-y to £20.4m, benefiting from the revenue growth trends, as well as the well-rehearsed operational efficiencies that continue to target annual savings of c £4–5m pa. The operating margin edged up 20bp to 3.7% (discussed further below).
Adjusted EPS rose 9.8% to 5.6p and the company declared a 1.4p dividend, in line with both last year and the maximum payable under current banking facilities. Net debt at the half year fell 41% to £22.9m, while average net debt fell 55.3% to £26.3m.
Exhibit 1: H1 summary results
£m |
FY21 |
H122 |
H222 |
FY22 |
H123 |
|
Total revenue |
1,109.6 |
544.8 |
544.5 |
1,089.3 |
550.1 |
|
% change |
-4.7% |
-1.2% |
-2.4% |
-1.8% |
1.0% |
|
Cost of goods sold |
(1,036.2) |
(508.0) |
(508.6) |
(1,016.6) |
(512.4) |
|
% change |
-5.1% |
-1.5% |
-2.2% |
-1.9% |
0.9% |
|
Gross profit |
73.4 |
36.8 |
35.9 |
72.7 |
37.7 |
|
Gross margin |
6.6% |
6.8% |
6.6% |
6.7% |
6.9% |
|
Total admin expenses |
(33.9) |
(17.9) |
(17.1) |
(35.0) |
(17.4) |
|
% change |
-11.0% |
5.9% |
0.6% |
3.2% |
-2.8% |
|
Income from JV |
0.1 |
0.2 |
0.1 |
0.3 |
0.1 |
|
Total adjusted operating profit |
39.6 |
19.1 |
19.0 |
38.1 |
20.4 |
|
% change |
12.8% |
1.1% |
-8.2% |
-3.8% |
6.8% |
|
Total adjusted operating profit margin |
3.6% |
3.5% |
3.5% |
3.5% |
3.7% |
Source: Smith News and Edison Investment Research
In the period, overall newspaper revenue grew 0.5%, which included c 1.5% of one-off revenue from sports events income such as the World Cup, Pokemon sticker collections and from other news (Royal family) events. It also benefited from 27 publisher price increases in the period, some of which are expected to annualise in H2 and into the next financial year. Newspaper volumes fell faster than the typical c 3–5% as a result, but with fewer price rises expected in H2, management expects volume declines to return to within the historical range. In magazines, revenue fell by 6.1%, which is around the expected rate of decline, while revenue from one-shots grew 88% from a small base.
Management drives profits back above pre-COVID levels
Exhibit 2 below highlights the result of strong management control over costs over the last three years. In H120, the pre-COVID comparable period, Smiths News reported an adjusted operating profit of £19.9m. In the following period, operating profit was hit by the impact of lock-down, dropping to £18.7m. Since then, Smiths News has reported profit growth in each period, culminating with H123 profits of £20.4m, c £0.5m ahead of the H120 figure.
This robust performance is accompanied by margin progression in each period, including H121 when volumes were under pressure. We believe this result is evidence of good cost control, operational efficiencies and the development of new profit streams.
|
Exhibit 2: Adjusted operating profit and operating margin |
|
|
Source: Smiths News and Edison Investment Research |
Examples of new profit streams
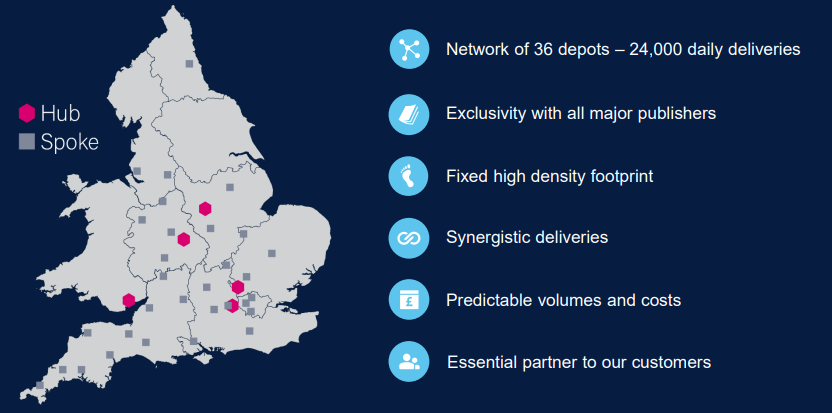
In November 2022, Smiths News outlined its ambition to better utilise its distribution network to generate new profit streams to offset the anticipated annual decline in newspaper and magazine distribution volumes. We believe this makes practical and commercial sense considering that its 36 depots in the UK are idle for long periods each day, and that its vans are visiting each of the company’s 19,000 customers every day.
|
Exhibit 3: Smiths News’ distribution network |
Exhibit 4: Potential new profit streams |
|
|
|
Source: Smiths News |
|
Exhibit 3: Smiths News’ distribution network |
|
|
Source: Smiths News |
|
Exhibit 4: Potential new profit streams |
|
|
Source: Smiths News |
Smiths News recently trialled a cardboard and plastic recycling collection service in Birmingham. The service includes the collection of unwanted cardboard and plastics at the same time as dropping off the day’s newspaper and magazine delivery. The trial was successful and is now being rolled out nationally. So far, c 1,900 independent customers have signed up and this number is growing c 100 per week. We anticipate that the service might be suitable for c 30% of its addressable customer base.
Another successful trial includes the distribution of DVDs and now books to major retailers and some supermarkets. The product is delivered to Smiths in bulk where it breaks the supply down, picks, packs and handles returns, playing to the company’s core strengths. There are potentially other products and/or customers where this kind or service may offer value to clients and income and a profit contribution to Smiths News, which could offset the expected decline in the core business. These are being actively explored.
Valuation of 89p offers c 70% upside
Following the interims and the company’s in-line outlook statement, we see no reason at this stage to revise our estimates, though the better-than-expected H1 performance suggests to us that the balance of risks is to the upside. However, there are potential headwinds such as inflationary pressure and potential volume impacts from publisher price rises that give rise to caution at this time. We have, however, introduced FY25 forecasts for the first time that assume a continuation of revenue declines of c 3% pa, offset by cost savings, thus resulting in largely flat full year profits.
Our DCF valuation remains unchanged at 89p/share, representing c 70% upside to the current share price. Smiths News trades on a P/E of 4.7x in FY23e, with a yield of 8.0% and the prospect of special dividends to bolster the yield as debt falls. In our experience, when ‘safe’ dividend yields exceed P/E ratios in absolute terms, it indicates a value opportunity. The low P/E rating might be explained by market expectations of continued revenue declines. Our DCF valuation assumes 5% pa revenue declines. A full explanation of our assumptions can be found here.
Exhibit 5: Financial summary
£m |
2019 |
2020 |
2021 |
2022 |
2023e |
2024e |
2025e |
||
Year end 31 August |
IFRS |
IFRS |
IFRS |
IFRS |
IFRS |
IFRS |
IFRS |
||
INCOME STATEMENT |
|||||||||
Revenue |
|
|
1,303.5 |
1,164.5 |
1,109.6 |
1,089.3 |
1,056.6 |
1,024.9 |
994.2 |
Cost of Sales |
(1,217.5) |
(1,091.4) |
(1,036.2) |
(1,016.6) |
(985.2) |
(954.8) |
(925.3) |
||
Gross Profit |
86.0 |
73.1 |
73.4 |
72.7 |
71.4 |
70.2 |
68.9 |
||
EBITDA |
|
|
60.1 |
40.4 |
44.9 |
42.9 |
43.2 |
42.9 |
42.6 |
Normalised operating profit |
|
|
44.0 |
35.4 |
40.6 |
39.3 |
39.3 |
39.0 |
38.7 |
Share-based payments |
(0.4) |
(0.3) |
(1.0) |
(1.2) |
(1.2) |
(1.2) |
(1.2) |
||
Total adjusted operating profit |
43.6 |
35.1 |
39.6 |
38.1 |
38.1 |
37.8 |
37.5 |
||
Amortisation of acquired intangibles |
(0.1) |
(0.2) |
0.0 |
(4.4) |
0.0 |
0.0 |
0.0 |
||
Exceptionals |
(7.2) |
(7.8) |
(1.9) |
(2.5) |
(0.4) |
(1.0) |
(1.0) |
||
Impairment |
0.0 |
(6.0) |
(1.6) |
1.2 |
0.0 |
0.0 |
0.0 |
||
Other financial costs |
0.0 |
0.9 |
3.5 |
2.5 |
0.0 |
0.0 |
0.0 |
||
Other |
0.0 |
0.0 |
(0.3) |
0.0 |
(0.6) |
0.0 |
0.0 |
||
Reported operating profit |
36.3 |
22.0 |
39.3 |
34.9 |
37.1 |
36.8 |
36.5 |
||
Net Interest |
(6.0) |
(7.2) |
(8.7) |
(7.0) |
(6.2) |
(5.5) |
(5.3) |
||
Profit Before Tax (norm) |
|
|
38.0 |
28.2 |
31.9 |
32.3 |
33.1 |
33.5 |
33.4 |
Profit Before Tax (reported) |
|
|
30.3 |
14.8 |
30.6 |
27.9 |
30.9 |
31.3 |
31.2 |
Reported tax |
(8.4) |
(2.8) |
(4.3) |
(4.5) |
(6.8) |
(7.8) |
(7.8) |
||
Profit After Tax (norm) |
29.6 |
25.4 |
27.6 |
27.8 |
26.3 |
25.7 |
25.6 |
||
Profit After Tax (reported) |
21.9 |
12.0 |
26.3 |
23.4 |
24.1 |
23.5 |
23.4 |
||
Discontinued operations |
(53.4) |
(18.7) |
(0.1) |
0.0 |
0.0 |
0.0 |
0.0 |
||
Net income (normalised) |
29.6 |
25.4 |
27.6 |
27.8 |
26.3 |
25.7 |
25.6 |
||
Net income (reported) |
(31.5) |
(6.7) |
26.2 |
23.4 |
24.1 |
23.5 |
23.4 |
||
Basic average number of shares outstanding (m) |
246 |
245 |
244 |
239 |
239 |
239 |
239 |
||
EPS - basic normalised (p) |
|
|
12.01 |
10.39 |
11.33 |
11.66 |
11.03 |
10.76 |
10.72 |
EPS - diluted normalised (p) |
|
|
11.98 |
10.28 |
10.83 |
11.03 |
10.53 |
10.28 |
10.24 |
EPS - basic reported (p) |
|
|
(12.78) |
(2.74) |
10.76 |
9.81 |
10.11 |
9.84 |
9.80 |
Dividend (p) |
1.00 |
0.00 |
1.50 |
4.15 |
4.15 |
4.15 |
4.15 |
||
Revenue growth (%) |
#DIV/0! |
(-10.7) |
(-4.7) |
(-1.8) |
(-3.0) |
(-3.0) |
0.0 |
||
Gross Margin (%) |
6.6 |
6.3 |
6.6 |
6.7 |
6.8 |
6.8 |
6.9 |
||
EBITDA Margin (%) |
4.6 |
3.5 |
4.0 |
3.9 |
4.1 |
4.2 |
4.3 |
||
Normalised Operating Margin |
3.4 |
3.0 |
3.7 |
3.6 |
3.7 |
3.8 |
3.9 |
||
BALANCE SHEET |
|||||||||
Fixed Assets |
|
|
31.5 |
66.5 |
47.1 |
41.9 |
34.4 |
26.0 |
17.2 |
Intangible Assets |
10.1 |
4.0 |
2.3 |
1.7 |
1.7 |
1.7 |
1.7 |
||
Tangible Assets |
10.9 |
9.4 |
9.4 |
8.6 |
7.5 |
5.5 |
3.1 |
||
Investments & other |
10.5 |
53.1 |
35.4 |
31.6 |
25.5 |
18.5 |
12.1 |
||
Current Assets |
|
|
181.2 |
165.9 |
139.1 |
147.5 |
145.2 |
141.9 |
138.7 |
Stocks |
16.2 |
14.1 |
13.2 |
15.6 |
14.8 |
14.3 |
13.9 |
||
Debtors |
124.2 |
101.2 |
106.6 |
95.7 |
95.1 |
92.2 |
89.5 |
||
Cash & cash equivalents |
24.0 |
50.6 |
19.3 |
35.3 |
35.3 |
35.3 |
35.3 |
||
Other |
16.8 |
0.0 |
0.0 |
0.9 |
0.0 |
0.0 |
0.0 |
||
Current Liabilities |
|
|
(229.7) |
(283.9) |
(167.5) |
(157.2) |
(151.1) |
(126.6) |
(120.3) |
Creditors |
(173.7) |
(139.5) |
(136.5) |
(140.3) |
(134.2) |
(109.7) |
(103.4) |
||
Tax and social security |
0.0 |
(1.7) |
(0.3) |
0.0 |
0.0 |
0.0 |
0.0 |
||
Short term borrowings |
(46.1) |
(130.1) |
(21.2) |
(8.0) |
(8.0) |
(8.0) |
(8.0) |
||
Other |
(9.9) |
(12.6) |
(9.5) |
(8.9) |
(8.9) |
(8.9) |
(8.9) |
||
Long Term Liabilities |
|
|
(57.3) |
(30.1) |
(76.4) |
(64.2) |
(46.6) |
(46.1) |
(26.6) |
Long term borrowings |
(49.3) |
0.0 |
(50.1) |
(39.1) |
(27.5) |
(33.0) |
(18.5) |
||
Other long term liabilities |
(8.0) |
(30.1) |
(26.3) |
(25.1) |
(19.1) |
(13.1) |
(8.1) |
||
Net Assets |
|
|
(74.3) |
(81.6) |
(57.7) |
(32.0) |
(18.1) |
(4.8) |
9.0 |
CASH FLOW |
|||||||||
Op Cash Flow before WC and tax |
60.1 |
40.4 |
44.9 |
42.9 |
43.2 |
42.9 |
42.6 |
||
Working capital |
(3.9) |
(5.3) |
(1.8) |
2.8 |
(4.7) |
(21.2) |
(3.1) |
||
Exceptional & other |
(7.7) |
(13.4) |
(1.3) |
(4.4) |
(2.2) |
(2.2) |
(2.2) |
||
Tax |
(2.6) |
0.0 |
(6.3) |
(5.3) |
(6.8) |
(7.8) |
(7.8) |
||
Other |
(22.9) |
1.7 |
5.9 |
13.8 |
6.9 |
6.9 |
6.9 |
||
Net operating cash flow |
|
|
23.0 |
23.4 |
41.4 |
49.8 |
36.4 |
18.5 |
36.4 |
Capex |
(8.1) |
5.3 |
(2.4) |
(1.9) |
(4.2) |
(4.2) |
(3.2) |
||
Acquisitions/disposals |
0.0 |
(10.2) |
6.5 |
14.0 |
0.0 |
0.0 |
0.0 |
||
Net interest |
(5.1) |
(8.0) |
(9.4) |
(8.0) |
(4.0) |
(3.3) |
(3.1) |
||
Equity financing |
0.0 |
(0.7) |
(2.6) |
(2.6) |
(0.8) |
(0.8) |
(0.8) |
||
Dividends |
0.1 |
(2.2) |
(1.0) |
(5.9) |
(9.8) |
(9.8) |
(9.8) |
||
Other |
(2.8) |
(15.6) |
(5.9) |
(6.4) |
(6.0) |
(6.0) |
(5.0) |
||
Net Cash Flow |
7.1 |
(8.0) |
26.6 |
39.0 |
11.6 |
(5.6) |
14.5 |
||
Opening net debt/(cash) |
|
|
79.3 |
72.1 |
79.7 |
53.2 |
14.2 |
2.6 |
8.1 |
FX |
0.1 |
(0.1) |
(0.2) |
0.0 |
0.0 |
0.0 |
0.0 |
||
Other non-cash movements |
0.0 |
0.5 |
0.1 |
0.0 |
0.0 |
0.0 |
0.0 |
||
Closing net debt/(cash) |
|
|
72.1 |
79.7 |
53.2 |
14.2 |
2.6 |
8.1 |
(6.4) |
Source: Smiths News and Edison Investment Research
|
|
Research: Metals & Mining
Wheaton Precious Metals’ (WPM’s) net earnings for Q123 were US$2.6m (or 2.5%) better than our forecast. In general, production of precious metals was slightly higher than our expectations, but sales, costs and depletion were in line. Our forecasts for FY23 have therefore remained substantially unchanged. However, we note that the broader market appears to be reticent in incorporating higher precious metals prices into its earnings estimates.