Intelligent Energy Holdings
Written by
Intelligent Energy Holdings |
Stable platform for long-term growth |
Prelims |
Alternative energy |
14 December 2015 |
Share price performance
Business description
Next events
Analysts
Intelligent Energy Holdings is a research client of Edison Investment Research Limited |
|||||||||||||||||||||||||||||||||||||||||||||||
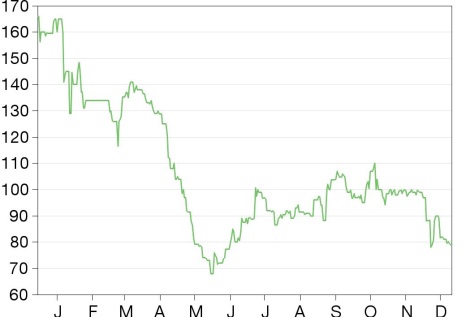
Intelligent Energy (IEH) made major steps forward in all three divisions during FY15, although the share price has been adversely affected by financing concerns, which management is actively addressing. The DP&G division negotiated a deal with GTL that transforms the group’s revenue profile and establishes a platform for volume deployment of fuel cells. The Motive division has broadened its customer base so it now works with one in four major automotive OEMs. The Consumer Electronics (CE) division launched its first product, acquired key assets for accelerating the development of fully embedded fuel cells and secured joint development work with an emerging smartphone OEM. We trim our estimates to reflect a modified CE business model and now see fair value at £426m.
Year end |
Revenue (£m) |
EBITDA |
PBT* |
EPS |
DPS |
P/E |
09/14 |
13.6 |
(52.4) |
(58.0) |
(30.4) |
0.0 |
N/A |
09/15 |
78.2 |
(48.8) |
(52.1) |
(21.5) |
0.0 |
N/A |
09/16e |
157.3 |
(24.6) |
(51.2) |
(24.7) |
0.0 |
N/A |
09/17e |
380.7 |
61.5 |
11.8 |
8.8 |
0.0 |
9.0 |
Note: *PBT and EPS are normalised, excluding intangible amortisation, exceptional items and share-based payments.
Strong revenue growth in line with expectations
We revised our estimates following the October trading update. Actual performance was broadly in line with our estimates. The strong y-o-y revenue growth was attributable to the increase in telecoms towers under management in the DP&G division. The majority of revenues were derived from managing towers under an interim contract, which generated minimal margins. We expect divisional and group margins to improve in FY16 post-transition to the long-term contract.
Further growth predicated on financing
The margin enhancement and revenue growth assumed in our estimates require IEH to complete the GTL transaction and then double the portfolio of towers under management by end FY16. According to our estimates, this results in a £65m funding gap. In the short term, management need to arrange a convertible loan note with industrial partners, dispose of a minority (<24.9%) stake in the Indian DP&G operation and secure £60m Indian bank debt as part-payment of the GTL deal. Management is confident of completing all three tasks by the end of CY Q116. Successful completion would remove the potential for a discounted funding round and associated dilution, a prospect that continues to weigh down the share price.
Valuation: Upside from royalty deals
Our SOTP analysis gives a risk-adjusted base case indicative value of £426m, reduced from £471m previously because of a decline in peer share price multiples and a reduction in FY17 revenue forecast for the CE division. This analysis excludes any value associated with long-term royalties for the Motive division or licence fees and royalties for the CE division. The potential value arising from a more aggressive acquisition of telecom tower energy management rights is explored in this note.
Divisional performance
IEH was formed to commercialise high power density fuel cell technology for the automotive industry. This sector remains the group’s raison d’être. Management is confident that increasing interest in fuel cell-powered vehicles, supported by strengthening engagement with vehicle manufacturers, will eventually translate into further licence deals, such as the £45m deal signed with Suzuki in 2012, and ultimately into royalty revenues. However, rather than wait for the automotive market to reach this point, management has actively sought other sectors in which it can generate revenues from the deployment of its fuel cell technology. In the short term, therefore, the majority of the group’s revenues will be derived from the distributed power and generation sector, while longer term there is potential for substantial licensing and royalty revenues from the consumer electronics sector and the automotive sector.
DP&G division
Execution of strategy
The division’s performance is currently dominated by the relationship with GTL, a provider of services and infrastructure to the Indian telecommunications sector. In February 2015, in response to a press article, IEH announced that it had reached agreement in principle to acquire GTL’s energy management business. In April the number of towers under management increased from around 10,000, the majority of which were already managed under an interim agreement with GTL, to around 27,000. In October IEH announced that the agreement had at last been signed, with completion likely to take place in CY Q116 (for details, see our November update note). One of the steps involved in GTL signing the agreement was a rigorous review of IEH’s business model by GTL’s financial backers. The transaction is expected to transform the profitability of the group (see below). It is also valuable strategically as it provides a platform to deploy fuel cells incorporating IEH technology. Management estimates that around 60-70% of sites currently under management experience power outages of more than eight hours a day and are therefore suitable candidates for substituting diesel generators with fuel cells as the former wear out, resulting in wide-scale economic deployment over the next three to five years. Additionally, the transaction creates a blueprint for further deals of this type. GTL’s tower estate represents an estimated 7% of towers in India, so there is plenty of scope to increase the number of towers under contract and reach management’s stated target of 125k-135k towers under contract within five years of the July 2014 IPO. (Note: our estimates assume a less aggressive roll-out than this target.) IEH continues to hold discussions with other parties interested in a similar arrangement to the GTL deal. Once the GTL agreement is completed, it is likely that others will follow.
Financial performance
Exhibit 1: DP&G division
2013 |
2014 |
2015 |
2016e |
2017e |
||
Number of telecom tower sites at year end (k) |
0.0 |
10.0 |
28.0 |
58.0 |
73.0 |
|
DP&G revenues (£m) |
0.0 |
5.0 |
72.2 |
144.0 |
320.1 |
|
DP&G EBITDA (£m) |
(1.4) |
(4.4) |
(2.5) |
19.1 |
64.0 |
Source: Edison Investment Research
The strong FY15 revenue growth resulted from a greatly increased number of towers under management and a full year of providing energy management services. (This activity did not begin until Q414.) EBITDA losses were lower year-on-year, but still material despite the growth in revenues, because the majority of revenues were attributable to towers managed for GTL under the interim contract, which generated minimal margins.
Our divisional estimates, which we leave unchanged, assume one other deal similar in size to GTL completing by the end of FY16, and a smaller-sized deal completing during FY17, driving strong growth in revenues. IEH expects annual revenues from providing power and maintaining equipment for GTL to be around £120m per year. Management notes that this is the largest fuel cell-related deal on record globally, representing around £1,200m of contracted revenue. Once the GTL transaction is completed, estimated in CY Q116, EBITDA margins for GTL-related activity will increase to 15%. Over a three- to five-year period management then expects to be able to increase the GTL-related EBITDA margin to around 30-35%. This will be achieved by improving the efficiency of sites, by replacing worn-out diesel generators with fuel cells where economic and by generating surplus electricity for sale to third parties for applications such as water purification. IEH has already deployed several dozen fuel cells at telecom tower sites in India and four water purification systems, demonstrating the viability of the margin improvement pathway.
Motive division
Execution of strategy
The launch of the first commercial fuel cell vehicles by Toyota and Hyundai appears to be encouraging competitors without their own in-house fuel cell technology to accelerate their efforts to find a solution. Since automotive manufacturers are unwilling to outsource as important a component as the powertrain to a direct competitor, partnering with an independent developer of fuel cell technology is key. As discussed in our initiation note, the only independent source for proven fuel cell technology at power densities suitable for deployment in smaller vehicles is IEH. Currently one in four of the global automotive OEMs is engaged with IEH in some capacity. In April IEH signed a joint development agreement (JDA) with a new major Asian vehicle manufacturer. In September IEH announced an extension to the development programme with another Asian OEM with whom it already had a JDA. The extension is worth c £6.5m over two and a half years. In October, post the FY15 year end, IEH announced that it had been appointed as lead on a €5m EU-backed programme to develop its proprietary 90kW fuel cell technology for mass production. The industrial partners include Johnson Matthey Fuel Cells, Solvay Speciality Polymers and automotive component OEM ElringKlinger. BMW Group and Daimler will be participating by setting out the stack requirements.
IEH’s technology also has potential as a range extender for battery-powered electric vehicles. In May IEH announced that it had been appointed to lead a three-year programme working alongside British Gas, DHL, Frost EV, Millbrook and CENEX to develop a new class of zero-emission, range-extended, light commercial vehicles. This is good news, in our opinion, as the investment proposition ceases to be a binary call on whether electric cars of the future will be powered by fuel cells or by batteries. It gives scope for successful commercialisation of IEH’s IP even if Tesla’s Elon Musk’s prophesy of a predominantly battery-powered future is correct.
Financial performance
Exhibit 2: Motive division
2013 |
2014 |
2015 |
2016e |
2017e |
||
One-off Motive licence revenues (£m) |
8.0 |
0.0 |
0.0 |
0.0 |
45.0 |
|
JDA revenues (£m) |
12.8 |
8.6 |
5.9 |
10.3 |
10.6 |
|
Motive revenues (£m) |
20.8 |
8.6 |
5.9 |
10.3 |
55.6 |
|
Motive EBITDA (£m) |
6.2 |
0.5 |
(0.3) |
0.5 |
43.3 |
Source: Edison Investment Research
FY15 divisional revenues were lower than the previous year because of the phasing of JDA agreements during the year, which were weighted towards the first half (ie H115). Noting the increased engagement with OEMs, our estimates, which are unchanged, show JDA revenues picking up in FY16. This is supplemented with one licence agreement equivalent in scale to the Suzuki agreement (£45m) expected in FY17.
Consumer Electronics
Execution of strategy
FY15 started off well, with the excitement of the launch of the Upp 1 miniaturised fuel cell phone charger across Apple’s UK retail store network in November 2014. However, while selling through UK apple stores represented a significant validation of the technology, the sales volumes that ensued were lower than management expectations. This was partly because consumers were deterred by the relatively high cost and weight and partly because of third-party manufacturing issues with the metal hydride fuel cartridges. In February management announced that it was discontinuing Upp 1 production after manufacturing only 30,000 units and focusing instead on commercialising the disposable cartridge technology (Upp 2), which it expected would be ready for volume distribution commencing in CY H116. It intends to sell most of the remaining 30,000 Upp 1 units in India, where the prevalence of lengthy power outages makes off-grid charging a much more compelling option than it is in the UK. We estimate that fewer than 1,000 devices were sold during FY15.
The uptake of the Upp 1 is disappointing, but is not new information. Moreover, as discussed in our initiation note, the device was always intended to serve as the first phase of a programme culminating in fuel cell technology that is fully embedded inside the casing of a mobile phone or tablet. The Upp 1 has served the purpose of raising public awareness of fuel cell-based recharging and creating a database of consumer usage patterns that is proving extremely helpful in convincing potential industrial partners of the merits of the technology. Learning from the experience of the first phase, management has decided to move away from B2C and volume manufacturing activities and to adopt a business model based on joint development programmes leading to revenues from licensing and royalties. It is also moving directly to the final phase of the programme, the fully embedded phase, bypassing the proposed Upp 2 development.
The decision to move directly to the fully embedded phase is supported by three key events: firstly, the acquisition of fuel cell related assets from Société BIC in February accelerated the development of fuel cartridges that are sufficiently compact; secondly, in August IEH was able to demonstrate that its fuel cell technologies could be embedded in cell phone and tablet hardware without reducing any of the functionality or battery life of the devices; and thirdly, coincident with the full year results, IEH announced that it had entered into an agreement with an emerging smartphone OEM to create a tailored development and integration programme for a specific smartphone application. This work builds on the prototype demonstrated in August. We note that IEH has begun to investigate the deployment of embedded fuel cells in drones.
Financial performance
Exhibit 3: Consumer Electronics division
2013 |
2014 |
2015 |
2016e |
2017e |
||||
Old |
New |
Old |
New |
|||||
Consumer electronics revenues (£m) |
0.0 |
0.0 |
0.1 |
1.7 |
3.0 |
18.7 |
5.0 |
|
Consumer electronics EBITDA (£m) |
(9.5) |
(10.1) |
(8.6) |
(10.5) |
(5.0) |
(8.0) |
(4.6) |
|
Source: Edison Investment Research
Since the number of Upps sold was very small, revenues from product sales during FY15 were also minimal. Divisional EBITDA losses fell year-on-year because management decided to cut back on marketing expenditure after the launch. Our previous estimates modelled a ramp-up in unit volumes of Upp sales from FY15 to FY17, with marketing and support costs also increasing so that the division remained loss making throughout the forecast period, despite the substantial revenue growth. Our revised estimates model revenues derived purely from joint development activity. Revenues increase in FY17 to reflect deeper customer engagement, but exclude any potential revenues from licensing agreements or royalties. We note that the decision to cease engaging in B2C and volume manufacturing activities will reduce working capital requirements and expenditure on marketing and sales support, helping to conserve cash.
Group performance
Earnings
We previously revised our estimates following the October trading update, which flagged revenues, adjusted EBITDA and net cash outcomes for FY15. Actual performance was broadly in line with our estimates. As discussed above, the strong growth in revenues was attributable to the increase in telecoms towers under management in the DP&G division. The big jump in group cost of sales was primarily attributable to the cost of fuel used by the DP&G operation. The rise in group operating costs was also primarily attributable to expanding DP&G activity. When it became clear that delays in signing the GTL contract would result in lower than expected divisional EBITDA margins, management cut back on costs, resulting in a year-on-year reduction in both R&D and administration costs at group level.
The change announced in the year-end results in the business model for the Consumer Electronics division causes the following revisions to our revenue and EBITDA estimates at group level. Since the majority of the group’s revenues and profits in the short term are derived from the DP&G division, where we have not changed our estimates, the impact on group revenue and EBITDA estimates of a change to the estimates in the Consumer Electronics division is relatively minor. The drivers of group level performance remain the same. Group revenue growth is driven by increasing the number of telecoms towers under management, which requires securing additional deals similar in scale to the GTL transaction. Group profit growth is driven by EBITDA margin improvement. This will be realised initially by completing the GTL deal, then by following the programme of realising efficiency gains, fuel cell substitution and generating surplus power for water purification. We have also amended our depreciation methodology to be more in line with management’s policy as it moves to a long-term contract for managing energy assets. This has a positive impact on both PBT and EPS estimates.
Exhibit 4: Summary of changes to estimates
FY15 |
FY16e |
FY17e |
|||||||
Forecasts |
Actual |
Change (%) |
Old |
New |
Change (%) |
Old |
New |
Change (%) |
|
Revenues (£m) |
77.6 |
78.2 |
+7.7 |
156.0 |
157.3 |
+0.8 |
394.4 |
380.7 |
-3.5 |
EBITDA (£m) |
(46.2) |
(48.8) |
-5.6 |
(23.8) |
(24.6) |
-3.4 |
64.8 |
61.5 |
-5.1 |
PBT (£m) |
(49.7) |
(52.1) |
-4.8 |
(72.5) |
(51.2) |
+29.4 |
(5.3) |
11.8 |
N/A |
EPS (p) |
(24.4) |
(21.5) |
-11.9 |
(36.5) |
(24.7) |
+32.3 |
(0.8) |
8.8 |
N/A |
Net (cash)/debt at year end** |
(24.5) |
(24.2) |
-1.2 |
193.0 |
193.1 |
-0.1 |
214.7 |
214.3 |
+0.2 |
Source: Edison Investment Research. Note: **Including short-term deposits.
Cash flow and balance sheet
IEH consumed £64.7m cash during FY15, leaving £24.2m on the balance sheet at the end of September 2015. The two key components were the group operating losses (£53.8m) and the initial $15m consideration for the Société BIC fuel cell-related assets. This is included in the purchase of tangible assets.
Since IEH’s growth plan is based on expanding its telecom tower portfolio, the short-term cash requirement is substantial. For FY16 alone, our estimates model £85m cash outflow associated with the acquisition of the GTL energy management business and a further £93m associated with the acquisition of energy management rights for a further 30,000 telecom towers from a different telecoms tower operator. These cash outflows are included in capex. £60m of the GTL acquisition cost is expected to be funded by Indian domestic bank debt secured against the revenue streams of the energy management business. This is included in long-term borrowings. We expect that all the funding needed to acquire the additional 30,000 telecom towers will be provided under a similar arrangement. This leaves an estimated £65m funding gap, which we model as provided by short-term debt.
Management is currently exploring two complementary options to bridge this funding gap, structuring these to prevent undue shareholder dilution. The first involves a convertible loan note delivered in several tranches. The terms have not yet been disclosed, but are expected to include a strike price that is at a premium to the current share price. IEH is in advanced discussions with two industrial partners, one of which is Air Liquide. The second involves realisation of value from the Indian operations. IEH intends to sell an equity stake of up to 24.9% of the Indian business to realise cash during FY16. As DP&G EBITDA margins improve and the realisable value of the operation increases, we expect IEH to sell off the remaining stake, while remaining a key technology provider to the DP&G business. When the DP&G division reaches the upper bound of the EBITDA margin, it will have achieved the strategic target of creating a platform for volume deployment of fuel cells, so there will no longer be a need for the group to own this operation.
We have not modelled the impact of either of these potential initiatives, but note that collectively these would provide more than the total required to address the identified funding gap, thus removing the potential for a discounted funding round and associated dilution, a prospect that has weighed down the share price. Management intends to complete the three financing activities, ie the convertible loan note, the sale of a stake in the Indian DP&G operation and securing £60m Indian bank debt as part-payment of the GTL deal, by the end of CY Q116. While management has contingency plans for conserving cash (cash consumption has been reduced from an average of £5.4m/month in FY15 to £3.5m/month currently), at the results presentation management stated that it was confident of completing all these financing activities within this timeframe.
Valuation
Exhibit 5: DP&G division
Peer EV/Sales comparison |
Valuation scenarios |
|||||||
Market |
EV/Sales TTM |
Base case |
Lower end IPO target |
Higher end IPO target |
||||
Aggreko |
2,372 |
1.7 |
Number of sites under management end FY17e |
73 |
90 |
110 |
135 |
|
American Tower Corp |
26,105 |
9.5 |
FY17 revenues (£m) |
320.1 |
394.6 |
482.3 |
592.0 |
|
APR Energy |
106 |
2.1 |
Average EV/Sales for sample of peers |
2.0 |
2.0 |
2.0 |
2.0 |
|
Ashtead Group |
5,119 |
2.4 |
Implied EV (£m) |
635.3 |
783.2 |
957.2 |
1,174.8 |
|
Bharti Infratel |
7,427 |
5.0 |
Net cash end FY15 (£m) |
24.2 |
24.2 |
24.2 |
24.2 |
|
Cape |
296 |
0.5 |
Cash required for tower portfolio expansion *(£m) |
(245.5) |
(245.5) |
(245.5) |
(245.5) |
|
Speedy Hire |
175 |
0.8 |
Risk free indicative value |
414.0 |
561.9 |
736.0 |
953.5 |
|
Toromont Industries |
1,167 |
1.2 |
Indicative value with 10% discount for risk |
372.6 |
505.7 |
662.4 |
858.2 |
|
United Rentals |
4,126 |
2.3 |
Indicative value with 20% discount for risk |
331.2 |
449.5 |
588.8 |
762.8 |
|
Mean |
2.0 |
Indicative value with 30% discount for risk |
289.8 |
393.3 |
515.2 |
667.5 |
||
Indicative value with 40% discount for risk |
248.4 |
337.2 |
441.6 |
572.1 |
||||
Source: Bloomberg, Edison Investment Research. Note: *Shown as capex and acquisitions/disposals in the financial summary (Exhibit 7). Grey shading indicates exclusion from mean. Prices as at 14 December 2015.
We continue to follow the valuation methodology described in detail in our November update note. The base case indicative value has changed since the previous update (from £471m to £426m) through a combination of two factors. Firstly, we have changed our CE division estimates. Secondly, weakening in investor sentiment towards fuel cell companies has caused a significant decline in average share price multiples for our sample set of listed peers. More than half of the base case indicative value is derived from the DP&G division, where there has been a very small change in indicative value attributable to movement in per share price multiples.
Applying a 30% discount for current perceived levels of risk gives an indicative base case value for the DP&G division of between £290m (previously £291m) and £668m (previously £670m). The upper end of the range assumes that the number of telecoms towers under management reaches 135k within three years of the IPO, which is the lower end of the three- to five-year timescale proposed by management at the IPO. Given the length of time it has taken to sign the GTL agreement, management is now guiding towards the five-year timetable. The upper valuation range rises to £954m (previously £957m) if no risk adjustment is applied. The small reduction in value compared with our November update note is caused by a small drop in the average EV/EBITDA multiple for our sample of stocks, since our divisional estimates have not been changed. We note that the base case indicative value for this division on its own is almost double the current market capitalisation.
Applying the methodology discussed in our November note to the estimates for the Motive division gives a base case indicative value of £124m (previously £149m) with a 25% discount for current levels of perceived risk. The risk-free indicative value is £166m (previously £199m). This methodology excludes a value attributable to long-term royalty streams. The reduction in divisional value compared with our November note is caused by a sharp drop in the share price of each of the stocks in our sample. Our divisional estimates have not been changed. The Heliocentris share price was adversely affected by news that orders from Myanmar and the Middle East had been delayed. The news headlines issued by the other three stocks have been positive over the last month, suggesting that investor sentiment regarding fuel cells generally has weakened.
Exhibit 6: Motive and Consumer Electronics divisions
Peer group multiples comparison |
Valuation |
||||||
Market cap (£m) |
EV/Sales TTM Sept17 (x) |
EV/EBITDA TTM Sept17 (x) |
|||||
AFC Energy |
£75m |
6.3 |
20.2 |
CE revenues FY17e (£m) |
5.0 |
||
Ballard Power Systems |
£122m |
1.4 |
63.5 |
EV/Sales multiple |
3.2 |
||
Ceres Power Holdings |
£62m |
21.8 |
- |
Net debt end FY16e (£m) |
0.0 |
||
FuelCell Energy |
£112m |
0.4 |
- |
Risk-free indicative value (£m) |
16.0 |
||
Heliocentris Energy Solutions |
£30m |
0.6 |
7.5 |
Indicative value with 15% discount for risk (£m |
13.6 |
||
Hydrogenics Corp |
£48m |
1.2 |
13.9 |
Indicative value with 25% discount for risk (£m) |
12.0 |
||
ITM Power |
£38 |
8.6 |
Indicative value with 35% discount for risk (£m |
10.4 |
|||
Plug Power |
£259m |
1.2 |
|
||||
SFC Energy |
£28m |
0.5 |
12.2 |
Motive JDA revenues FY17e (£m) |
10.6 |
||
Mean |
3.2 |
11.2 |
Motive average licence revenues FY17e (£m) |
15.0 |
|||
Total normalised Motive revenues FY17e (£m) |
25.6 |
||||||
Normalised Motive EBITDA FY17e (£m) |
14.8 |
||||||
EV/EBITDA multiple |
11.2 |
||||||
Net debt end FY17e (£m) |
0.0 |
||||||
Risk-free indicative value (£m) |
165.8 |
||||||
Indicative value with 15% discount for risk (£m |
140.9 |
||||||
Indicative value with 25% discount for risk (£m) |
124.3 |
||||||
Indicative value with 35% discount for risk (£m) |
107.8 |
||||||
Source: Edison Investment Research. Note: Grey shading indicates exclusion from mean. Prices as at 14 December 2015.
Applying the methodology discussed in our November note to the estimates for the Consumer Electronics division gives a base case indicative value of £12.0m with a 25% discount for current levels of perceived risk (previously £31m with a 30% discount for risk). We have reduced the discount rate to acknowledge the recent JDA announcement. The risk-free indicative value is £16m (previously £44m). The reduction in value is attributable to the change in business model and the resultant switch from volume sales of Upp devices in FY17 to lower levels of revenue attributable to joint development activity. Since our estimates do not model any revenues for licence or royalty fees, it does not capture any value arising from this activity. Statistics from Gartner state that 1,200m smartphones were sold during 2014. At this stage there are no data available on target volume prices or royalty rates for IEH’s embedded technology. If we assume that smartphone volume sales remain at 2014 levels, that 10% of all smartphones sold contain an embedded fuel cell costing $40 and IEH receives a 1% royalty on each embedded fuel cell sold, that equates to $48m of revenue annually. If each smartphone user also purchases 12 disposable fuel cartridges costing $5 each year, with these also incurring a 1% royalty, that equates to a further $72m in royalties each year, ie a total of $120m (£77m) each year.
Summing the indicative valuations for the three divisions gives a base case of £426m (previously £471m) and an upper bound of £1,135m (previously £1,200m). This is derived from the risk-free indicative values, assuming that the DP&G division reaches management’s target of 135k telecoms tower sites faster than management’s stated five-year timescale. This analysis excludes any value associated with long-term royalties for the Motive division or licence fees and royalties for the Consumer Electronics division.
Exhibit 7: Financial summary
£m |
2013 |
2014 |
2015 |
2016e |
2017e |
||
Year end 30 September |
IFRS |
IFRS |
IFRS |
IFRS |
IFRS |
||
PROFIT & LOSS |
|||||||
Revenue |
|
|
20.8 |
13.6 |
78.2 |
157.3 |
380.7 |
Cost of Sales |
(13.5) |
(9.9) |
(75.9) |
(116.4) |
(175.2) |
||
Gross Profit |
7.3 |
3.7 |
2.3 |
40.9 |
205.5 |
||
EBITDA |
|
|
(23.4) |
(52.4) |
(48.8) |
(24.6) |
61.5 |
Operating Profit (before amort and except) |
|
|
(26.7) |
(46.0) |
(51.5) |
(34.5) |
36.0 |
Amortisation of acquired intangibles |
0.0 |
0.0 |
0.0 |
0.0 |
0.0 |
||
Exceptionals |
0.0 |
(7.1) |
0.0 |
0.0 |
0.0 |
||
Share based payments |
(0.0) |
(2.6) |
(2.3) |
(2.3) |
(2.3) |
||
Operating Profit |
(26.7) |
(55.6) |
(53.8) |
(36.8) |
33.7 |
||
Net Interest |
(0.5) |
(4.0) |
(1.3) |
(16.7) |
(24.2) |
||
Share of losses from JVs and exceptionals |
(2.5) |
0.0 |
0.7 |
0.0 |
0.0 |
||
Profit Before Tax (norm) |
|
|
(29.7) |
(58.0) |
(52.1) |
(51.2) |
11.8 |
Profit Before Tax (FRS 3) |
|
|
(29.8) |
(59.6) |
(54.4) |
(53.5) |
9.5 |
Tax |
8.8 |
11.4 |
11.6 |
4.8 |
4.8 |
||
Profit After Tax (norm) |
(20.9) |
(46.6) |
(40.5) |
(46.4) |
16.6 |
||
Profit after tax (FRS 3) |
(21.0) |
(48.2) |
(42.8) |
(48.7) |
14.3 |
||
Average Number of Shares Outstanding (m) |
134.4 |
153.4 |
188.2 |
188.3 |
188.3 |
||
EPS - normalised (p) |
|
|
(15.6) |
(30.4) |
(21.5) |
(24.7) |
8.8 |
EPS - normalised fully diluted (p) |
|
|
(15.6) |
(30.4) |
(21.5) |
(24.7) |
8.8 |
EPS - (IFRS) (p) |
|
|
(15.6) |
(31.4) |
(22.8) |
(25.9) |
7.6 |
Dividend per share (p) |
0.00 |
0.00 |
0.00 |
0.00 |
0.00 |
||
Gross Margin (%) |
35.3 |
27.4 |
2.9 |
26.0 |
54.0 |
||
EBITDA Margin (%) |
N/A |
N/A |
N/A |
N/A |
16.1 |
||
Operating Margin (before GW and except) (%) |
N/A |
N/A |
N/A |
N/A |
9.5 |
||
BALANCE SHEET |
|||||||
Fixed Assets |
|
|
27.7 |
37.9 |
59.8 |
234.1 |
265.3 |
Intangible Assets |
13.3 |
14.7 |
29.4 |
26.9 |
24.9 |
||
Tangible Assets |
5.3 |
6.9 |
8.5 |
185.3 |
218.5 |
||
Deferred tax assets |
9.2 |
16.3 |
21.9 |
21.9 |
21.9 |
||
Current Assets |
|
|
46.4 |
107.5 |
45.2 |
51.9 |
95.9 |
Stocks |
1.5 |
4.1 |
5.3 |
6.3 |
7.4 |
||
Debtors |
9.8 |
11.1 |
11.5 |
15.7 |
30.5 |
||
Cash and short-term deposits |
31.6 |
88.9 |
24.2 |
25.6 |
53.8 |
||
Current tax assets |
3.5 |
3.4 |
4.2 |
4.2 |
4.2 |
||
Current Liabilities |
|
|
(8.6) |
(17.6) |
(14.3) |
(87.9) |
(97.2) |
Creditors |
(8.6) |
(17.6) |
(14.3) |
(22.9) |
(32.2) |
||
Short term borrowings |
0.0 |
0.0 |
0.0 |
(65.0) |
(65.0) |
||
Long Term Liabilities |
|
|
(21.1) |
0.0 |
(3.0) |
(156.8) |
(206.1) |
Long term borrowings - asset finance |
(18.5) |
0.0 |
0.0 |
(153.8) |
(203.1) |
||
Other long term liabilities |
(2.6) |
0.0 |
(3.0) |
(3.0) |
(3.0) |
||
Net Assets |
|
|
44.4 |
127.8 |
87.7 |
41.3 |
57.9 |
CASH FLOW |
|||||||
Operating Cash Flow |
|
|
(23.4) |
(50.6) |
(51.5) |
(18.9) |
57.2 |
Net Interest |
(0.0) |
0.3 |
0.1 |
(16.7) |
(24.2) |
||
Tax |
3.3 |
3.8 |
4.8 |
4.8 |
4.8 |
||
Capex |
(5.0) |
(6.8) |
(19.4) |
(101.5) |
(59.0) |
||
Acquisitions/disposals |
0.0 |
1.1 |
1.0 |
(85.0) |
0.0 |
||
Equity financing |
1.5 |
108.4 |
0.2 |
0.0 |
0.0 |
||
Dividends |
0.0 |
0.0 |
0.0 |
0.0 |
0.0 |
||
Forex |
0.0 |
(0.0) |
0.1 |
0.0 |
0.0 |
||
Net Cash Flow |
(23.6) |
56.1 |
(64.7) |
(217.3) |
(21.2) |
||
Opening net debt/(cash) |
|
|
29.9 |
(13.1) |
(88.9) |
(24.2) |
193.1 |
HP finance leases initiated |
0.0 |
0.0 |
0.0 |
0.0 |
0.0 |
||
Other |
66.5 |
19.7 |
0.0 |
0.0 |
0.0 |
||
Closing net debt/(cash) |
|
|
(13.1) |
(88.9) |
(24.2) |
193.1 |
214.3 |
Source: Company accounts, Edison Investment Research
|