ADMIE Holding offers exposure to growth in the Greek electricity transmission grid IPTO, a regulated utility with significant growth opportunities from investments in new transmission lines. IPTO’s underleveraged balance sheet (0.9x adjusted net debt/EBITDA at the end of 2018) sustains a c €4bn investment plan, which we estimate will result in a regulated asset base (RAB) CAGR of 11% in 2018–27. Although we believe the regulatory allowed rate of return is set at a level in line with cost of capital and the company has strong growth potential, ADMIE Holding’s current share price implies a c 40% discount to 2019 equity RAB (including work in progress) and a more than 20% discount to EU regulated utilities’ P/E multiples.
Written by
ADMIE Holding |
Infrastructure upgrade offers growth opportunity |
Initiation of coverage |
Utilities |
7 May 2019 |
Share price performance
Business description
Next event
Analyst
ADMIE Holding is a research client of Edison Investment Research Limited |
|||||||||||||||||||||||||||||||||||||||||||||
ADMIE Holding offers exposure to growth in the Greek electricity transmission grid IPTO, a regulated utility with significant growth opportunities from investments in new transmission lines. IPTO’s underleveraged balance sheet (0.9x adjusted net debt/EBITDA at the end of 2018) sustains a c €4bn investment plan, which we estimate will result in a regulated asset base (RAB) CAGR of 11% in 2018–27. Although we believe the regulatory allowed rate of return is set at a level in line with cost of capital and the company has strong growth potential, ADMIE Holding’s current share price implies a c 40% discount to 2019 equity RAB (including work in progress) and a more than 20% discount to EU regulated utilities’ P/E multiples.
Year end |
EBIT* |
Net income* |
EPS* |
DPS** |
P/E |
Yield |
12/17 |
25.1 |
25.1 |
10.84 |
0.00 |
15.9 |
N/A |
12/18 |
36.2 |
36.4 |
15.68 |
5.96 |
11.0 |
3.5 |
12/19e |
36.2 |
36.4 |
15.67 |
8.83 |
11.0 |
5.1 |
12/20e |
39.7 |
39.8 |
17.18 |
7.34 |
10.0 |
4.3 |
Note: *EBIT, net income and EPS are normalised, excluding amortisation of acquired intangibles, exceptional items and share-based payments. **Related to fiscal year (not cash dividend).
Growth potential thanks to new interconnections
IPTO targets a c €4bn capex plan in 2019–27, mainly focused on connecting Greek islands to the mainland, improving security of supply, reducing costs for consumers and improving environmental sustainability. IPTO has an underleveraged balance sheet that can support large capex spending in our view. We expect net debt/EBITDA of 0.9x at the end of 2018 to rise to c 5x in FY25, broadly in line with other European regulated utilities.
RAB growth drives strong EPS and DPS development
Assuming a timely implementation of the capex plan, we expect an EV RAB CAGR of 11% over the period 2018–27. A growing RAB combined with a declining cost of debt and the ongoing reduction in corporate tax rate should drive a 11% FY19e–23e EPS CAGR for ADMIE Holding. Assuming a stable payout ratio of 50% for IPTO (the company policy is a minimum 50% payout), ADMIE Holding’s FY19e DPS of €8.8 cents (currently implying a c 5% yield) should grow at a 5% CAGR on our estimates (FY19–24).
Valuation: At a discount to RAB and EU peers
Despite the growth potential, the stock is trading at a discount of c 30% to average European regulated utilities’ P/E ratios. We believe the current allowed regulatory rate of return for IPTO is broadly in line with the cost of capital, even though the stock is trading at a c 40% discount to FY19 equity RAB. An RAB-based valuation of €2.83/share implies c 60% upside to the current share price. While a key risk for our investment case is a delay in the implementation of the capex plan, which would result in a lower earnings and dividend growth outlook, we note that the current valuation does not appear to incorporate any growth potential.
Investment summary
Company description: Holding company for an electricity grid
ADMIE Holding owns a 51% stake in IPTO, a utility which owns and operates the Greek electricity transmission grid and is fully regulated by the Greek Regulatory Authority for Energy (RAE) with a simple framework. IPTO is engaged in a large investment plan of c €4bn over the period 2019–27 to modernise, upgrade and extend the transmission network with the objective of increasing security of supply, reducing costs for consumers and improving environmental sustainability. Similarly to other European utilities, RAE periodically updates the RAB value and the allowed remuneration, setting all the parameters required to calculate the revenues of the company. The current four-year regulatory period is 2018–21, hence the company has good visibility on the economics for the next three fiscal years.
Valuation: At a large discount to RAB and EU peers
ADMIE Holding is trading at a large discount to other European regulated utilities on P/E, EV/EBITDA and dividend yield, despite the significantly stronger growth outlook on the back of the anticipated large capital programme. In addition, ADMIE Holding is trading at a c 40% discount to equity RAB, even though we believe allowed returns are broadly in line with its WACC. Our RAB-based valuation of €2.83 is c 60% higher than the current share price, and implies no premium/discount to RAB. While we believe the discount to RAB value and European peers is excessive, some risk factors may justify a certain discount, such as the limited liquidity of the stock, the higher country risk premium, the shorter track record of stability of the regulation for IPTO and the government ownership of ADMIE Holding.
Financials: Strong earnings and dividend growth
As there is high visibility on return on investments, we generally have a positive view on regulated utilities with large capex opportunities, as long as returns are adequate and leverage is under control. A level of capex above depreciation allows for RAB growth and growing earnings, which drives dividend expansion. We believe a good dividend yield with a good growth outlook is one of the key attractions for investors in regulated utilities. IPTO has launched a c €4bn investment plan for the interconnection of the Greek islands, with the objectives of reducing costs for the consumers, improving security of supply and environmental sustainability. The investment plan is very large when compared to the current RAB of IPTO (€1.4bn at the end of 2018) and we estimate it should result in an 11% 2018–27 RAB CAGR (in real terms). We forecast FY19–23 EBITDA and net income CAGR of 18% and 11%, respectively, for IPTO, based on the assumption that the capex plan is implemented in a timely manner. This translates into a 11% EPS CAGR for ADMIE Holding. IPTO has a target of a minimum 50% payout ratio on earnings. Assuming a flat dividend payout ratio on earnings of 50% for IPTO, we forecast a 5% DPS CAGR for ADMIE Holding. We note the payout ratio of 50% is well below the average level of European regulated utilities (70%+), which indicates the future growth potential of the dividend is significantly higher than other European peers. Because of the high level of capex, we expect an average annual cash outflow of c €300m for IPTO. As a result, the leverage increases significantly but only towards levels broadly in line with other European regulated utilities (around 5x net debt/EBITDA and c 50% debt/RAB in 2025). In our view these levels do not suggest the need of a capital increase.
Sensitivities: Allowed returns set until 2021
Compared to unregulated utilities (or hybrids part regulated/part unregulated), the business risks that regulated companies, including IPTO/ADMIE Holding, face are lower as they do not have exposure to volumes, commodities or other price fluctuations. However, changes in regulation or in market conditions may still have a material impact on profitability. The key elements of the regulation for IPTO are set until 2021 and, while changes are possible, large deviations from the current framework are unlikely in our view. The key risks that IPTO and ADMIE Holding face are a delay in implementing the company’s growth projects, political intervention risks, a rise in interest rate and, a change in market conditions (including country risk premium) not reflected in an updated rate of return.
Company description: Regulated utility with growth
ADMIE Holding joins the European regulated utility space
ADMIE Holding was established by the Greek government in February 2017 and listed on the Athens Stock Exchange in June 2017. The company is 51%-owned by the Greek government. The only asset ADMIE Holding owns is a 51% stake in the Greek electricity transmission system operator IPTO and their activities, strategy and mission are fully aligned. The only income for ADMIE Holding is the dividend it receives from IPTO. IPTO owns, manages and operates the Greek electricity transmission grid (100% owned), which includes 11,801km of high voltage lines. IPTO’s mission is “to ensure Greece’s electricity supply in a safe, efficient and reliable manner while promoting the development of competition in the Greek electricity market and guaranteeing the non-discriminatory treatment of System users”. IPTO was previously owned by state-owned utility Public Power Corporation (PPC). In compliance with an EU Directive (2009/72/EC, “common rules in the organization of EU electricity markets”) and Greek law (4001/2011), IPTO was identified as Transmission System Operator for Greece. Full ownership unbundling was completed on 20 June 2017 when PPC sold a 24% stake in IPTO to State Grid of China Corporation for €327.6m and a 25% stake to state-owned DES ADMIE for €295.6m. A 51% stake was spun off into ADMIE Holding, owned by PPC shareholders. At the end of 2018, IPTO had 1,316 employees and ADMIE Holding only two employees.
|
Exhibit 1: Corporate structure and shareholding base (31 March 2019) |
|
|
Source: Company data |
A young and simple regulatory framework
IPTO is fully regulated by Greece’s Regulatory Authority for Energy (RAE). The regulator acts as an independent body to protect consumer interest at the same time as allowing the company a fair return on investments and sufficient revenues to maintain and upgrade networks. Similarly to other European utilities, RAE periodically updates the RAB value and the allowed remuneration for the company, setting all the parameters required to calculate the revenues of the company. The Greek regulation appears simpler and less sophisticated than the regulation of several other European countries, which we believe reflects the fact that it is relatively recent:
■
Regulatory period: the regulatory period extends over four years. The current period covers the years 2018–21.
■
RAB: the RAB is incremented each year for the capex plan implemented by IPTO according to the approved projects by RAE (see next section) and reduced to reflect the depreciation of the assets. A portion of the capex carried out by IPTO is covered by subsidies received by the European Union – these are excluded from the RAB calculation.
■
Allowed rate of return (WACC): the return is set at the beginning of the regulatory period by RAE (Exhibit 2). In exceptional circumstances (such as a large deviation in the components of the WACC), the regulator has the authority to update the calculation. The WACC return is expressed as a real pre-tax rate of return.
■
Additional return on certain projects: certain projects that have been assessed as “Projects of Major Importance” receive an additional return on top of the allowed rate of return for 12 years. The additional premium is included between 1% and 2.5% and is set by RAE. However, such projects are not included in the RAB (and are not remunerated) until the asset is commissioned.
■
Inflation: the ability to offer exposure to inflation-protected returns is a key attractiveness of regulated utilities. IPTO also offers inflation protection although arguably the mechanism is not as explicit as in other European regulations. Both the RAB and the returns are expressed in real terms, but for 2019 allowed revenues the regulator has included in the calculation a 0.6% inflation rate, in line with CPI; hence we would expect that going forward RAE does the same every year. While this adjustment was not applied in previous years, Greece experienced a long period of deflation/low inflation so inflation protection was not an issue for this business historically. The Greek regulatory framework is more recent than those of the other European countries; we believe inflation protection is an area that would benefit from more clarity in the future.
■
Allowed revenues vs required revenues and other adjustments: a number of adjustments to allowed revenues are made in order to calculate the required revenues (ie what is paid by the consumers). In addition, IPTO consistently achieved “other revenues” historically (average 2015–18 of c €20m). Overall total revenues for IPTO (including other revenues) were broadly in line with allowed revenues by the regulator (average allowed revenues 2015–18 was €250m vs average reported total revenues of €255m).
|
Exhibit 2: Regulatory framework for IPTO remuneration |
|
|
Source: Edison Investment Research |
Exhibit 3: Regulator’s assumption for allowed returns set for period 2018–21
2018 |
2019e |
2020e |
2021e |
|
Risk-free rate |
0.7% |
0.7% |
0.7% |
0.7% |
Market risk |
5.0% |
5.0% |
5.0% |
5.0% |
Beta |
0.68 |
0.73 |
0.67 |
0.72 |
Country risk |
2.3% |
2.0% |
1.8% |
1.5% |
Cost of equity post tax |
6.4% |
6.4% |
5.9% |
5.8% |
Tax rate |
29% |
29% |
29% |
29% |
Cost of equity pre-tax |
9.0% |
9.0% |
8.3% |
8.2% |
Cost of debt pre-tax |
5.3% |
5.6% |
5.0% |
5.1% |
D/(D+E) |
36.3% |
41.3% |
36.3% |
40.3% |
WACC nominal |
7.6% |
7.6% |
7.1% |
7.0% |
Inflation rate |
0.6% |
0.6% |
0.6% |
0.6% |
WACC real pre-tax |
7.0% |
6.9% |
6.5% |
6.3% |
Source: RAE
Very large growth projects are targeted
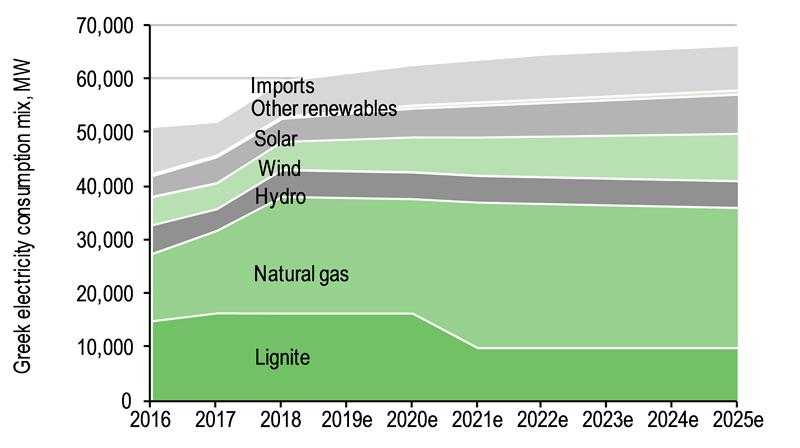
The Greek electricity mix is in a significant transition process. On the one hand, ageing lignite plants face environmental (lignite is responsible for >30% of total Greek carbon emissions, according to WWF), economic (rising carbon emissions have erased their profitability) and regulatory challenges (EU directives pose significant restrictions to their operations). On the other hand, the cost of renewable installations has reduced dramatically, and this has encouraged the Greek government to announce a plan of new renewable investments for 2.6GW of new capacity. In Greece as in other European countries, this transition from large central plants to smaller decentralised installations requires an upgrade of the network and is one of the key drivers of European electricity transmission grids.
|
Exhibit 4: Greek electricity mix is in transition |
Exhibit 5: Existing lines and new investments |
|
|
|
Source: Edison Investment Research |
Source: Company data |
|
Exhibit 4: Greek electricity mix is in transition |
|
|
Source: Edison Investment Research |
|
Exhibit 5: Existing lines and new investments |
|
|
Source: Company data |
In addition, Greece and IPTO have launched large projects for the interconnection of the Greek islands, with the objectives of reducing costs for the consumers, improving security of supply and environmental sustainability. In most cases Greek islands currently rely on expensive and polluting fuel-oil-fired plants (often close to touristic areas); currently the extra costs of running these plants is shared among all Greek consumers (this component represents 4%–12% of a retail consumer’s bill). The construction of interconnections should allow for the replacement of these plants (which would be put in cold reserve) with renewables and imports from the mainland, lowering both costs for the consumers and carbon emissions. We show in Exhibit 6 the key investments targeted in the Ten-Year Network Development Plan, as approved by the regulator.
Exhibit 6: List of IPTO’s key planned investments (pre-subsidies)
Project |
Capex 2019–27 |
Commissioning date expected by ADMIE |
Cycladic interconnection (Phase A-B-C) |
125 |
2020 |
Cycladic interconnection (Phase D) |
385 |
2024 |
Crete interconnection |
276 |
2020 |
Crete interconnection |
957 |
2022 |
Megalopolis Substation & connection to the Grid 400 & 150 kV |
162 |
2024 |
Dodecanese interconnection |
1,550 |
2027 |
Various other projects |
614 |
-- |
Total |
4,069 |
Source: Company data
A portion of the capex is covered by subsidies received by the European Union and these are subtracted from the RAB calculation (ie IPTO receives no remuneration on the portion of investments covered by subsidies). We show in Exhibit 7 a breakdown of the capex plan by project and in Exhibit 8 the annual investments planned by IPTO (gross and net of subsidies).
In addition, over the course of FY18, IPTO has set up the 100%-owned subsidiary ARIADNE as a SPV responsible for the c €1bn Crete-Attica interconnection project. Cash resources amounting to €200m have been injected in the company and IPTO is about to collect expressions of interest for the acquisition of a 39% stake in the company. We have assumed into our forecasts that the transaction is completed, hence we include disposal proceeds of €78m in FY19 (based on 39% of €200m) and adjust our net income forecasts to incorporate the impact of the related minorities. The project is currently identified as a project of major importance, hence it is eligible for additional remuneration (between 100bp and 250bp extra remuneration) for 12 years, although the remuneration will not start before the line is electrified (we assume remuneration from 2023 as the project is currently expected to be commissioned by the end of 2022; financial expenses related to the investments are capitalised until then). The assets related to this interconnection will be included in IPTO’s balance sheet and ARIADNE will have a concession contract with IPTO. ARIADNE will pay dividends to IPTO (61% stake) as well as to minority investors (39%) as soon as the asset is commissioned.
|
Exhibit 7: Planned capex by IPTO (gross of subsidies) |
Exhibit 8: Annual capex, net and gross of subsidies |
|
|
|
Source: Company data |
|
Exhibit 7: Planned capex by IPTO (gross of subsidies) |
|
|
Source: Company data |
|
Exhibit 8: Annual capex, net and gross of subsidies |
|
|
Source: Company data |
Further opportunities from fibre optic investments
In the future, further investment opportunities may arise from the development of the Greek fibre optic network. For this purpose, IPTO set up a 100%-owned subsidiary “GRID TELECOM SINGLE MEMBER SA” in January 2019. While we understand this may be a source of significant development potential for IPTO (this business has generated annual revenue of €2m), not many details are available and it is difficult to assess the implications for the growth outlook of the company at this stage. We expect more details on this in FY19–FY20; the presentation of a more detailed plan may be a positive catalyst for the share price.
Corporate strategy
ADMIE Holding’s strategy is fully aligned with IPTO’s. IPTO aims to guarantee a safe, efficient and reliable electricity supply in Greece. In addition, IPTO promotes the development of competition in the Greek electricity market and guarantees the non-discriminatory treatment of system users. IPTO targets the timely implementation of a large capex programme that has been designed mainly to lower costs for the consumers and to improve security of supply (especially in the islands). IPTO expects the investment plan to generate value for its shareholders, with the RAB growth translated into growing profits and dividends.
Management
The management teams of ADMIE Holding and IPTO include managers with a mix of technical and economic backgrounds. Eleni Zarikou is chairman of ADMIE Holding and director of finance at IPTO, and has a background in auditing, accounting and financial analysis, with roles at multinational companies in Greece. Yiannis Kampouris is vice chairman of ADMIE Holding and has a background in electrical engineering, and over 30 years of professional experience in the field of energy. Manos Manousakis is chairman of the board of directors and has been chief executive officer of IPTO since June 2017. His career combines business development leadership and complex project management with country strategic planning.
Regulated utility with large growth opportunity
IPTO targets a c €4bn capex plan over the period 2019–27, which we calculate will result in 11% real enterprise value (EV) RAB CAGR, supporting earnings and dividend growth for ADMIE Holding. Based on the company’s capex plan, the growth outlook stands out when compared to other European regulated utilities, which we believe reflects the fact that large investments in electricity transmission were made earlier in other European countries than in Greece. The growing RAB is remunerated with an allowed return that we estimate is broadly in line with the WACC and IPTO’s underleveraged balance sheet provides room for the large planned spending.
Large capex programme can support strong RAB growth
As there is high visibility on return on investments, we generally have a positive view on regulated utilities with large capex opportunities, as long as returns are adequate and leverage is under control. A level of capex above depreciation allows for RAB growth and growing earnings, which drives dividend expansion. We believe a good dividend yield with a good growth outlook is one of the key attractions for investors in regulated utilities. Southern European utilities such as Terna, Snam, Red Electrica and Enagas have been successful equity stories; by implementing large capex programmes they have boosted both earnings and dividends for shareholders.
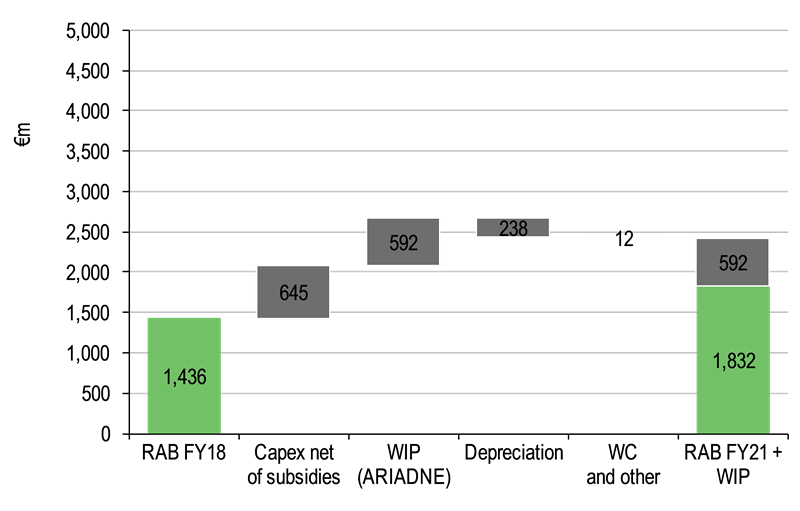
Similarly for IPTO, the large growth capex plan should result in a strong RAB growth profile. Incorporating the planned capex into our forecasts, we would estimate a 19% 2018–21 RAB CAGR (including work in progress; excluding this, CAGR would be 8%) and an 11% 2018–27 RAB CAGR for IPTO.
|
Exhibit 9: RAB growth 2018–21 (enterprise value) |
Exhibit 10: RAB growth 2018–27 (enterprise value) |
|
|
|
Source: Company data, Edison Investment Research |
|
Exhibit 9: RAB growth 2018–21 (enterprise value) |
|
|
Source: Company data, Edison Investment Research |
|
Exhibit 10: RAB growth 2018–27 (enterprise value) |
|
|
Source: Company data, Edison Investment Research |
We show in Exhibit 11 that this RAB growth stands out among European regulated utilities’ targeted RAB growth. In our view this is because IPTO is at an earlier stage of development than EU peers, as most other European regulated utilities have implemented large and high-priority investments over the last 20 years, growing their RAB very strongly. In most cases their capex is now much more aligned with depreciation.
|
Exhibit 11: Nominal RAB CAGR of selected European regulated utilities (enterprise value) |
|
|
Source: Company data, Edison Investment Research. Note: Based on company targets; if expressed in real terms, growth rates have been adjusted for expected inflation, using EU Commission forecasts. IPTO’s RAB CAGR is expressed in real terms as it is not inflated according to Greek regulatory framework (see page Xx for more details on inflation). IPTO’s RAB CAGR includes work in progress related to ARIADNE. |
The EV RAB growth is translated into an equity real RAB CAGR of 3.0% in the period 2018–27 (net debt growth means equity RAB growth is lower than EV RAB growth).
Can investments be implemented in a timely manner? Capex is picking up
Historically IPTO, as a subsidiary of state-owned PPC, experienced delays in implementing its capex plan. However, a new management team was appointed when the company was listed (and is now independent from PPC), and capex has been increased. Investments in 2018 were above the company’s plans (€171m vs €138m capex incorporated in the RAB). The improvement in Greek financing conditions, the ability to access financing from EIB and Chinese banks (thanks to the partnership with the shareholder State Grid of China) and the underleveraged balance sheet structure support a pick-up in investments. While the risk of delays should be considered by investors, in the valuation section we show that the company’s current valuation is not discounting any growth potential, hence risks to the share price appear limited.
IPTO’s capex programme would reduce costs for consumers
The extra costs deriving from the Greek islands’ inefficient and expensive power generation system (in most cases dominated by polluting and high-cost fuel oil-fired power plants) are currently shared by all Greek consumers. As shown in Exhibit 12, the extra costs represent 4%–12% of a typical residential consumer bill (depending on consumption).
|
Exhibit 12: Breakdown by component of typical residential electricity bill (2018) |
|
|
Source: PPC, Company data |
Allowed return analysis: A fair return for IPTO
When compared to other listed utility assets, the allowed return on capital for IPTO is set at the highest level, which reflects the higher country risk premium. On our calculations the return on capital allowed by the regulator is broadly in line with our estimated WACC for IPTO.
Benchmarking with other European regulated utilities
When comparing IPTO to other European listed regulated utilities, its 2019 allowed rate of return is the highest in the sample we consider (Exhibit 13).
Exhibit 13: Estimated allowed rates of return (real, pre-tax) for EU regulated utilities
Utility |
Country |
Activity |
2019 WACC |
Current regulatory period |
IPTO |
Greece |
Electricity transmission |
6.9% |
2018–21 |
Terna |
Italy |
Electricity transmission |
5.6% |
2019–21 |
Snam |
Italy |
Gas transport |
5.7% |
2019–21 |
Storage |
6.7% |
2019–21 |
||
Regasification |
6.8% |
2019–21 |
||
Italgas |
Italy |
Gas distribution |
6.3% |
2019–21 |
Gas metering |
6.8% |
2019–21 |
||
Enagas |
Spain |
Gas transport |
4.9% |
2013–20 |
Red Electrica |
Spain |
Electricity transmission |
5.3% |
2013–20 |
National Grid |
UK |
Electricity transmission |
4.7% |
2014–21 |
Gas transport |
4.5% |
2014–21 |
||
REN |
Portugal |
Electricity transmission - premium |
5.8% |
2018–20 |
Electricity transmission - old assets |
5.0% |
2018–20 |
||
Gas transport |
5.5% |
2018–20 |
||
Gas distribution |
5.8% |
2018–20 |
||
RTE (part of EDF group) |
France |
Electricity transmission |
4.4% |
2018–21 |
Severn Trent |
UK |
Water |
4.6% |
2015–19 |
United Utilities |
UK |
Water |
4.6% |
2015–19 |
Pennon |
UK |
Water |
4.6% |
2015–19 |
Source: Company data, countries’ energy regulators
However, the high level of the allowed return for IPTO clearly reflects the higher country risk premium. By deducting from the allowed rate of return the respective countries’ 10-year government bond yields, we show that the country risk-adjusted level of WACC (3.6%) is not distant from the median value (3.9%).
|
Exhibit 14: Difference between allowed rate of return (real, pre-tax) and country’s current 10-year government bond yield (2019e) |
|
|
Source: Edison Investment Research |
Is the allowed return fair? Marking to market the WACC
We have marked to market the components of the allowed return set by the regulator to assess how it compares to IPTO’s cost of capital. We believe there are four WACC components that deviate from the current market levels (Exhibit 15).
Exhibit 15: Key WACC components that are different from actual values
Component |
Description |
Regulator's assumption vs actual |
Country risk premium |
The “country risk premium” component set by the Greek regulator is currently well below the current Greece–Germany 10-year government bond yield spread (2.0% vs 3.3%). This was acknowledged by the regulator when the WACC was set, but RAE assumed that the economic recovery in Greece would reduce the country risk premium over time. This has, however, not materialised yet and the government bond yield spread has only slightly reduced over the last 12-months. |
Negative |
Cost of debt |
The cost of debt assumed by the regulator is significantly higher than the level achieved by IPTO, which has managed to significantly reduce the cost of financing over the last couple years (from 5.2% in FY17 to 2.5% we expect in FY19). |
Positive |
Risk-free rate |
The risk-free rate set by the regulator at 0.7% is more generous than the current German 10-year bond yield spread of c 0%. |
Positive |
Tax rate |
The tax rate set by the regulator at a flat 29% should in reality reduce by one percentage point per year according to recent legislation by the Greek government. |
Positive |
Source: Edison Investment Research
Overall our forecasts for the cost of capital we estimate for ADMIE is broadly in line with the current allowed rate of return set by the regulator.
Financing the growth: Significant balance sheet headroom
One of the key strengths of ADMIE Holding is IPTO’s currently underleveraged financial structure, which is key to support its very large capex programme. As set out in Exhibit 16, IPTO’s net debt/EBITDA at the end of 2018 was 0.9x, well below the average 5.3x for other regulated utilities. Looking at net debt/RAB metrics the result is similar: 12% for IPTO vs other regulated utilities typically ranging between 50% and 70%.
|
Exhibit 16: Last published net debt/EBITDA for main European regulated utilities |
|
|
Source: Refinitiv, Edison Investment Research |
As investments are carried out, we expect leverage to increase significantly. However, as we show in Exhibit 17, the levels of net debt/EBITDA and net debt/RAB (including work in progress assets) in a few years’ time are broadly in line with the average levels for the other regulated utilities and the company is unlikely to require equity injections in our view. The company has not set a maximum leverage target.
|
Exhibit 17: Evolution of IPTO’s net debt/EBITDA and net debt/RAB metrics |
|
|
Source: Edison Investment Research. Note: Net debt/EBITDA peaks in FY22 as EBITDA does not include the positive impact of capex spent on ARIADNE project until FY23, on our assumptions. *RAB includes WIP assets under construction and included in the RAB only at completion. |
Importantly, IPTO can access financing from international lenders. In particular, IPTO has loans with Bank of China (€199m out of €693m total debt at the end of FY18), European Investment Bank (€270m) as well as Greek banks (€224m). This should support availability of credit and an attractive financing cost. We estimate a 3.6% cost of debt in 2018 and expect a further reduction in 2019 to around 2.5%, based on recent company renegotiations.
Management
The management teams of ADMIE Holding and IPTO include managers with a mix of technical and economic backgrounds. Eleni Zarikou is chairman of ADMIE Holding and also director of finance of IPTO. She has a background in auditing, accounting and financial analysis, with auditing and finance positions at multinational companies in Greece. Prior to IPTO, she was a financial advisor to the secretary general at the Ministry of Economy and Development. She holds a degree in organisation and business administration from the University of Piraeus and a postgraduate degree in applied economics and finance from the National & Kapodistrian University of Athens. She holds a professional qualification with the Certified Auditors and Accountants Training of the Body of Chartered Auditors and Accountants.
Yiannis Kampouris is vice chairman of ADMIE Holding and has a background in electrical engineering including a PhD from the National Technical University of Athens. He has over 30 years of professional experience in the field of energy. Since June 2017 he has been a member of the board of directors of IPTO SA and chief officer of operation, infrastructure and market. Prior to these positions, he was CEO of IPTO, director of the Transmission System Planning (IPTO SA and HTSO SA), director at the chief executive director office (IPTO SA) and head of system planning department (HTSO SA). He is author or co-author of more than 150 publications in international journals, national and international conferences.
Manos Manousakis is chairman of the board of directors and chief executive officer of IPTO since June 2017. He was previously the chief executive officer of two subsidiary companies of the OTE group, which provide telecommunication services in the wholesale market. He has also served as a director of the board of OTE SA and has held various positions of responsibility in the company. In addition, he served as secretary general of the Ministry of Economy as well as a director of Black Sea Trade and Development Bank. He has previously worked as a scientific associate in the Hellenic Parliament, and as a consultant in telecommunication projects for public and private sector companies. He holds a PhD in electrical engineering from the National Technical University of Athens and has academic experience. His career combines business development leadership and complex project management with country strategic planning.
The corporate governance for IPTO is regulated by a shareholders’ agreement. ADMIE Holding proposes the chairman and CEO and deputy CFO. State Grid Corp. of China (SGCC) approves the chairman and CEO and appoints the deputy CEO and CFO. The board of IPTO is composed of nine members: two appointed by the Greek government, three by ADMIE Holding, three by State Grid and one who is a representative of the employees.
Sensitivities
Compared to unregulated utilities (or hybrids part regulated/part unregulated), the business risks that regulated companies, including IPTO/ADMIE Holding, face are lower as they do not have exposure to volumes or price fluctuations. However, changes in regulation or in market conditions may still have a material impact on profitability. The key elements of the regulation for IPTO are set until 2021 and, while changes are possible, large deviations from the current framework are unlikely in our view. One of the largest risks is a delay in implementing the company’s growth projects, which may have an impact on the growth outlook of the company. More in detail, key risks for IPTO and ADMIE Holding are:
■
The rate of return may be set at a level that is different from the company’s cost of capital. This may happen because of changes in the rate of return (large changes are unlikely before 2021 in our view) or because of changes in market conditions. To illustrate the sensitivity to earnings, we calculate that a one percentage point increase or reduction in the allowed rate of return would increase or reduce ADMIE Holding’s EPS by 15% (based on our 2019 forecast).
■
Change in market conditions: an increase or decrease in the country risk premium not quickly reflected in the return allowed by the regulator may result in a lower or higher valuation by the market. We show in Exhibit 18 that historically there was a correlation between ADMIE Holding’s share price and the Greek government bond spread.
|
Exhibit 18: ADMIE Holding share price vs Greek government bond spreads |
|
|
Source: Reuters, Edison Investment Research |
■
Delays in implementing growth projects: a delay in executing the large capex programme would affect the growth outlook of the company. This would normally affect valuation, although we highlight the current share price does not seem to reflect any value for the growth potential.
■
Rising interest rates: as regulated utilities are often seen as bond proxies by investors, a gradual rise in European interest rates may reduce the attractiveness of these investments. Although we believe the impact of a gradual interest rate rise is well understood by investors, it has continued to affect regulated utilities’ performance over the last 18 months, as shown by the strong correlation in Exhibit 19.
|
Exhibit 19: EU regulated utilities share price performance follows interest rates evolution |
|
|
Source: Reuters, Edison Investment Research. |
■
Political intervention risk: as IPTO is a fully regulated utility, by definition the risks of changes in regulation or the risk of an additional taxation cannot be ruled out. However, we highlight that potential measures aimed at reducing costs for consumers would not have much impact as transmission costs represent only 3% of Greek electricity bills (Exhibit 12). In addition, adverse changes in regulation would result in an increasing cost of capital for IPTO and eventually in higher costs for consumers. Finally, it should be noted that the Greek government owns the majority of ADMIE Holding (51% stake). Although it is common for European utilities to be controlled by the state, there is always a risk that governments may force the companies to adopt decisions that are not in the best interest of minority shareholders.
Valuation: Large discount to regulated utilities & RAB
We show that ADMIE Holding is trading at a large discount to European regulated utilities on all valuation metrics despite the stronger expected growth and at a large discount to RAB. An FY19e RAB-based valuation (including work-in-progress assets) of €2.83/share (assuming no premium/discount to RAB) is c 60% higher than the current share price.
At a large discount to European regulated utilities on all valuation metrics
As set out in Exhibit 20, ADMIE Holding is trading at a discount to other European regulated utilities on P/E, EV/EBITDA and dividend yield, despite the significantly stronger growth outlook.
Exhibit 20: Key valuation metrics for European regulated utilities
Company |
Country |
Mkt cap (€m) |
P/E |
EV/EBITDA |
Dividend yield |
||||||
FY0** |
FY1 |
FY2 |
FY0** |
FY1 |
FY2 |
FY0** |
FY1 |
FY2 |
|||
Terna Rete Elettrica Nazionale SpA |
Italy |
13,649 |
15.2x |
14.5x |
14.1x |
11.3x |
10.8x |
10.4x |
4.4% |
4.7% |
5.0% |
Snam SpA |
Italy |
19,257 |
14.8x |
14.2x |
13.9x |
12.6x |
12.4x |
12.1x |
5.1% |
5.4% |
5.6% |
Italgas SpA |
Italy |
5,667 |
14.1x |
13.6x |
12.8x |
9.7x |
9.7x |
9.4x |
4.3% |
4.4% |
4.7% |
Enagas SA |
Spain |
7,555 |
13.4x |
13.9x |
13.0x |
10.5x |
10.5x |
10.2x |
6.0% |
6.5% |
6.8% |
Red Electrica Corporacion SA |
Spain |
12,601 |
13.9x |
13.5x |
14.0x |
9.5x |
9.1x |
9.2x |
5.4% |
5.7% |
5.8% |
National Grid PLC |
UK |
41,781 |
13.9x |
14.5x |
14.3x |
10.8x |
10.8x |
10.3x |
5.6% |
5.7% |
5.9% |
Elia System Operator SA |
Belgium |
4,665 |
13.3x |
15.6x |
14.3x |
12.7x |
9.9x |
9.5x |
1.9% |
2.9% |
2.9% |
Ren Redes Energeticas Nacionais SGPS SA |
Portugal |
2,163 |
14.9x |
14.1x |
14.1x |
8.8x |
9.0x |
9.0x |
4.8% |
6.6% |
6.6% |
Severn Trent PLC |
UK |
7,063 |
16.6x |
14.8x |
14.7x |
12.0x |
11.1x |
10.8x |
4.3% |
4.7% |
5.0% |
Pennon Group PLC |
UK |
4,614 |
14.5x |
13.5x |
12.6x |
12.0x |
11.3x |
10.6x |
5.2% |
5.6% |
6.0% |
United Utilities Group PLC |
UK |
8,269 |
18.2x |
15.2x |
14.2x |
12.5x |
11.9x |
11.4x |
4.9% |
4.9% |
5.1% |
Average |
14.5x |
14.2x |
14.1x |
11.3x |
10.8x |
10.3x |
4.9% |
5.4% |
5.6% |
||
ADMIE Holding* |
Greece |
394 |
10.8x |
10.8x |
9.9x |
6.1x |
7.6x |
8.7x |
3.5% |
5.2% |
4.3% |
Source: Refinitiv, Edison Investment Research. Note: Prices as at 2 May 2019. *EV/EBITDA multiples refer to IPTO (based on current market valuation of ADMIE Holding which owns a 51% stake in IPTO). EBITDA CAGR also refers to IPTO (FY18 EBITDA is adjusted for exceptional items). The EBITDA estimates for IPTO are Edison Investment Research forecasts. **Last year reported (FY18 for ADMIE Holding).
As set out in Exhibit 21, applying the average EV/EBITDA and P/E of European regulated utilities to ADMIE Holding, derives significant upside to the current share price (c 60% and 30%, respectively, based on FY1 multiples). It is important to note that we see valuation upside even though on our forecasts IPTO’s earnings are not benefiting from the large investments in ARIADNE, which do not contribute to our earnings until completion (in FY23 on our assumptions). A valuation based on dividend yield would provide downside (c 5% on FY1) as the dividend payout ratio for IPTO (50%) is well below the average level for European regulated utilities (70%+).
Investors should note that the current limited liquidity of the stock may be part of the reason for the discount as the stock has traded less than €0.2m/day since the beginning of 2019.
Exhibit 21: Implied value/share based on peers’ P/E and EV/EBITDA and dividend yield
Company |
P/E |
EV/EBITDA |
Dividend yield |
||||||
FY0** |
FY1 |
FY2 |
FY0** |
FY1 |
FY2 |
FY0** |
FY1 |
FY2 |
|
Average regulated utilities |
14.5x |
14.2x |
14.1x |
11.3x |
10.8x |
10.3x |
4.9% |
5.4% |
5.6% |
EPS €/share |
EBITDA* €m |
DPS, €/share |
|||||||
Edison Investment Research forecasts for ADMIE Holding/IPTO |
0.16 |
0.16 |
0.17 |
168 |
163 |
185 |
0.06 |
0.09 |
0.07 |
Implied value per share ADMIE Holding, €/share |
2.28 |
2.23 |
2.42 |
3.65 |
2.84 |
2.36 |
1.22 |
1.63 |
1.31 |
Source: Edison Investment Research. Note: Prices as at 2 May 2019. *EV/EBITDA multiples applied to IPTO’s EBITDA. **Last year reported (FY18 for ADMIE Holding).
ADMIE Holding also trading at a large discount to RAB value
We calculate that the current ADMIE Holding share price implies a large discount to RAB value, as shown in Exhibit 22, in contrast with most other European regulated utilities that generally trade at a large premium to RAB values.
Exhibit 22: Calculation of ADMIE Holding’s discount to RAB (EV and equity)
€m |
2018 |
2019e |
2020e |
2021e |
EV RAB of IPTO + work in progress |
1437 |
1741 |
2133 |
2424 |
– net debt |
(171) |
(374) |
(742) |
(1039) |
– provisions |
(78) |
(81) |
(84) |
(87) |
Equity RAB of IPTO |
1,188 |
1,286 |
1,308 |
1,298 |
ADMIE Holding's stake in IPTO |
51% |
51% |
51% |
51% |
Value of ADMIE Holding’s 51% stake in IPTO |
606 |
656 |
667 |
662 |
ADMIE Holding adjustments (net cash position, DCF of corporate costs) |
(2) |
2 |
(1) |
2 |
RAB-based equity value of ADMIE Holding |
603 |
658 |
666 |
664 |
Market cap |
394 |
394 |
394 |
394 |
Premium/(discount) to equity RAB |
(35%) |
(40%) |
(41%) |
(41%) |
Premium/(discount) to EV RAB |
(29%) |
(30%) |
(25%) |
(22%) |
Source: Edison Investment Research.
We have used a similar approach to derive an RAB-based valuation for ADMIE Holding in Exhibit 23, to show at what premium/discount to RAB the stock should trade according to our estimates. Starting from IPTO’s EV RAB, we calculate the implicit equity values for IPTO and ADMIE Holding. As the absolute profitability we estimate for IPTO is broadly in line with the allowed return by the regulator, we include almost no value for the financial over/underperformance. As a result, we derive a valuation that is broadly in line with RAB. The RAB-based valuation of €2.83/share is c 60% above the current share price.
Exhibit 23: RAB-based valuation for IPTO/ADMIE Holding
€m |
|
IPTO RAB FY 2019 + work in progress |
1,741 |
Value of financial outperformance/underperformance |
(3) |
– Net debt FY19 |
(374) |
– Provisions FY19 |
(81) |
+ Associates |
0 |
– Minorities |
0 |
Equity value IPTO |
1,283 |
ADMIE Holding stake |
51% |
Value of ADMIE Holding's 51% stake in IPTO’s equity RAB |
654 |
ADMIE Holding net cash FY19 |
6 |
DCF of ADMIE Holding corporate costs |
(5) |
Equity value ADMIE Holding |
656 |
NOSH FY19 (000s) |
232 |
Equity value per share, €/share |
2.83 |
Source: Edison Investment Research
While we believe this discount is excessive, there may be some reasons that partly justify a discount to RAB or other European peers, such as the limited liquidity of the stock, the higher country risk premium, the fact that the company is controlled by the Greek government and the fact that the regulation for IPTO has a shorter track record than other European countries.
Financials
Earnings: 11% EPS CAGR for ADMIE Holding
We forecast FY19–23 EBITDA and net income CAGR of 18% and 11%, respectively, for IPTO. This translates into an 11% FY19–23e EPS CAGR for ADMIE Holding.
IPTO’s EBITDA is mostly driven by growing revenues (14% CAGR FY19–23e) as a result of RAB expansion. We have assumed allowed returns broadly in line with the regulator’s assumptions until 2021 (the only difference being a declining corporate tax rate, as we have assumed the regulator adjusts the calculation during the current regulatory period) and unchanged thereafter. We have incorporated into our forecasts extra returns of 100bp (vs the regulator’s indication of 100–250bp) on certain projects of major importance (we have assumed only ARIADNE’s project, which represents c 25% of total capex, qualifies for this, although we recognise that other projects may be designated in the future). We have also assumed IPTO’s opex to be in line with the regulator’s assumptions (excluding opex related to other non-regulated activities, which are small).
Below EBITDA, we have assumed a declining cost of debt for IPTO in 2019 (to 2.5% from 3.6% in 2018, reflecting recent renegotiations as well as the likely lower cost of new debt) and flat thereafter. In addition, we have assumed a corporate tax rate declining by 1 percentage point a year to 25% in 2022 (in line with current Greek legislation).
We have not included any growth related to the fibre optic network business as currently not enough details are available to assess the economics of this activity. However, the growth opportunity is likely to be significant and we see medium-term upside risk to our forecasts as a result.
|
Exhibit 24: Expected return on RAB vs allowed level |
|
|
Source: Edison Investment Research. Note: Actual EBIT includes contribution from non-regulated activities. |
Dividends: 5% FY19 yield with 5% FY19–24 CAGR
IPTO has a target of a minimum 50% payout ratio on earnings. Considering the financing needs implied by the large capex plan, we have conservatively assumed a flat dividend payout ratio of 50% for IPTO. ADMIE Holding’s dividend policy is to pay 95% of the dividend it receives from IPTO, net of expenses at ADMIE Holding (which we estimate at €0.3m for FY19). We forecast a 5% DPS CAGR for ADMIE Holding (please note that the dividend for ADMIE Holding increases significantly in FY24 as IPTO pays out in that year the first dividend related to the increased earnings thanks to the contribution of ARIADNE). We note that IPTO’s payout ratio of 50% is well below the average level of European regulated utilities (70%+), which indicates the future dividend growth potential is significantly higher than other European peers.
Cash flow and balance sheet: Gearing up
Because of the high level of capex, we expect an average annual cash outflow of c €300m for IPTO throughout 2021 (assuming no significant deterioration in working capital). As a result, the leverage increases significantly (see Exhibit 17) but only towards the levels broadly in line with other European regulated utilities (around 5x adj. net debt/EBITDA and c 50% adj. net debt/RAB in 2025). In our view these levels do not suggest the need of a capital increase. That said, there is no guidance from the company on the target gearing levels.
FY18 results overview
IPTO group reported FY18 EBITDA of €182.7m, up 6% y-o-y, and net profit of €85.9, up 39% y-o-y. However, the results included various exceptional items including the positive impact of a provisions reversal of €26.6m due to dismissal of a contractor lawsuit. Correcting for that, EBITDA was down 5% y-o-y and net income was up 13%. IPTO managed to step up capital spend significantly, with total capex of €183m, up 154% yoy. Despite this, group net debt reduced significantly to €171m (from €286m one year earlier) thanks to a large positive variation in working capital (we understand the company expects no significant changes in working capital going forward).
Exhibit 25: Key financials and forecasts for IPTO Group
€m |
2017 |
2018 |
2019e |
2020e |
2021e |
2022e |
Revenues |
256.5 |
249.2 |
250.8 |
273.1 |
278.9 |
283.6 |
% y-o-y change |
-3% |
1% |
9% |
2% |
2% |
|
Reported EBITDA |
172.0 |
182.7 |
162.8 |
185.1 |
189.9 |
194.8 |
% y-o-y change |
6% |
-11% |
14% |
3% |
3% |
|
Adj. EBITDA |
177.5 |
168.0 |
162.8 |
185.1 |
189.9 |
194.8 |
% y-o-y change |
-5% |
-3% |
14% |
3% |
3% |
|
Reported EBIT |
107.7 |
115.4 |
104.8 |
109.1 |
112.9 |
116.6 |
% y-o-y change |
7% |
-9% |
4% |
4% |
3% |
|
Adjusted EBIT |
113.2 |
100.7 |
104.8 |
109.1 |
112.9 |
116.6 |
% y-o-y change |
-11% |
4% |
4% |
4% |
3% |
|
Reported net income |
61.7 |
85.9 |
71.7 |
78.5 |
81.8 |
89.3 |
% y-o-y change |
39% |
-17% |
10% |
4% |
9% |
|
Adjusted net income |
65.9 |
74.3 |
71.7 |
78.5 |
81.8 |
89.3 |
% y-o-y change |
13% |
-4% |
10% |
4% |
9% |
|
Adjusted net debt |
285.8 |
171.1 |
374.0 |
741.7 |
1039.1 |
1429.3 |
Capex (gross of subsidies) and incl. ARIADNE |
70.1 |
183.1 |
390.7 |
592.3 |
436.2 |
550.8 |
Source: Company data, Edison Investment Research
ADMIE Holding reported an FY18 net profit (pre-exceptionals) of €42.3m, up 83% y-o-y (+73% y-o-y including exceptionals in FY18/FY17), and said it expects to distribute €0.087/share in dividends over the course of 2019 (cash dividend, ie the sum of the balance of the dividend related to FY18 of €0.028/share and of the interim dividend for FY19 of €0.06/share).
Exhibit 26: Financial summary
Accounts: IFRS; year-end 31 December, €000s |
|
|
2017 |
2018 |
2019e |
2020e |
2021e |
2022e |
2023e |
INCOME STATEMENT |
|
|
|
|
|
|
|
|
|
Total revenues |
|
|
0 |
0 |
0 |
0 |
0 |
0 |
0 |
Cost of sales |
|
|
0 |
0 |
0 |
0 |
0 |
0 |
0 |
Gross profit |
|
|
0 |
0 |
0 |
0 |
0 |
0 |
0 |
SG&A (expenses) |
|
|
(973) |
(239) |
(335) |
(341) |
(348) |
(355) |
(362) |
Profit (loss) from JVs/associates (post tax) |
|
|
24,024 |
42,353 |
36,549 |
40,040 |
41,694 |
45,543 |
54,867 |
Depreciation and amortisation |
|
|
(2) |
(4) |
(6) |
(8) |
(10) |
(12) |
(14) |
Reported EBIT |
|
|
23,049 |
42,110 |
36,208 |
39,691 |
41,336 |
45,176 |
54,491 |
Finance income/(expense) |
|
|
(8) |
156 |
156 |
156 |
156 |
156 |
156 |
Reported PBT |
|
|
23,041 |
42,265 |
36,364 |
39,846 |
41,492 |
45,331 |
54,646 |
Income tax expense (includes exceptionals) |
|
|
3,778 |
4,256 |
0 |
0 |
0 |
0 |
0 |
Reported net income |
|
|
26,819 |
46,521 |
36,364 |
39,846 |
41,492 |
45,331 |
54,646 |
Basic average number of shares, m |
|
|
232 |
232 |
232 |
232 |
232 |
232 |
232 |
Basic EPS, cents/share |
|
|
9.93 |
18.22 |
15.67 |
17.18 |
17.88 |
19.54 |
23.55 |
|
|
|
|||||||
Adjusted EBITDA |
|
|
25,149 |
36,225 |
36,214 |
39,699 |
41,346 |
45,188 |
54,505 |
Adjusted EBIT |
|
|
25,147 |
36,221 |
36,208 |
39,691 |
41,336 |
45,176 |
54,491 |
Adjusted PBT |
|
|
25,139 |
36,376 |
36,364 |
39,846 |
41,492 |
45,331 |
54,646 |
Adjusted EPS, cents/share |
|
|
10.84 |
15.68 |
15.67 |
17.18 |
17.88 |
19.54 |
23.55 |
Adjusted diluted EPS (c) |
|
|
10.84 |
15.68 |
15.67 |
17.18 |
17.88 |
19.54 |
23.55 |
DPS (c) (declared for fiscal year) |
|
|
0.00 |
5.96 |
8.83 |
7.34 |
8.06 |
8.39 |
9.18 |
DPS (c) (cash payment for the year) |
|
|
0.00 |
3.16 |
8.80 |
8.83 |
7.34 |
8.06 |
8.39 |
BALANCE SHEET |
|
|
|||||||
Property, plant and equipment |
|
|
5 |
5 |
9 |
11 |
10 |
8 |
4 |
Intangible assets |
|
|
9 |
7 |
7 |
7 |
7 |
7 |
7 |
Other non-current assets |
|
|
520,134 |
550,439 |
565,096 |
586,862 |
608,536 |
633,232 |
665,328 |
Total non-current assets |
|
|
520,148 |
550,451 |
565,112 |
586,880 |
608,554 |
633,247 |
665,339 |
Cash and equivalents |
|
|
2,181 |
4,843 |
6,130 |
3,729 |
6,510 |
8,459 |
11,547 |
Inventories |
|
|
0 |
0 |
0 |
0 |
0 |
0 |
0 |
Trade and other receivables |
|
|
79 |
9,907 |
9,907 |
9,907 |
9,907 |
9,907 |
9,907 |
Other current assets |
|
|
0 |
0 |
0 |
0 |
0 |
0 |
0 |
Total current assets |
|
|
2,260 |
14,750 |
16,037 |
13,636 |
16,417 |
18,366 |
21,454 |
Non-current loans and borrowings |
|
|
0 |
0 |
0 |
0 |
0 |
0 |
0 |
Other non-current liabilities |
|
|
0 |
0 |
0 |
0 |
0 |
0 |
0 |
Total non-current liabilities |
|
|
0 |
0 |
0 |
0 |
0 |
0 |
0 |
Trade and other payables |
|
|
18 |
20 |
20 |
20 |
20 |
20 |
20 |
Current loans and borrowings |
|
|
0 |
0 |
0 |
0 |
0 |
0 |
0 |
Other current liabilities |
|
|
3,731 |
0 |
0 |
0 |
0 |
0 |
0 |
Total current liabilities |
|
|
3,749 |
20 |
20 |
20 |
20 |
20 |
20 |
Equity attributable to company |
|
|
518,659 |
565,181 |
581,129 |
600,496 |
624,951 |
651,593 |
686,772 |
Non-controlling interest |
|
|
0 |
0 |
0 |
0 |
0 |
0 |
0 |
|
|
|
|||||||
CASH FLOW STATEMENT |
|
|
|||||||
Profit before tax |
|
|
23,041 |
42,265 |
36,364 |
39,846 |
41,492 |
45,331 |
54,646 |
Net finance expenses |
|
|
19 |
(156) |
(156) |
(156) |
(156) |
(156) |
(156) |
Depreciation and amortisation |
|
|
2 |
4 |
6 |
8 |
10 |
12 |
14 |
Other adjustments |
|
|
(24,024) |
(42,353) |
(36,549) |
(40,040) |
(41,694) |
(45,543) |
(54,867) |
Movements in working capital |
|
|
(622) |
(1,053) |
0 |
0 |
0 |
0 |
0 |
Cash from operations (CFO) |
|
|
(1,584) |
(1,293) |
(335) |
(341) |
(348) |
(355) |
(362) |
Capex |
|
|
(16) |
(2) |
(10) |
(10) |
(10) |
(10) |
(10) |
Cash used in investing activities (CFIA) |
|
|
(16) |
(2) |
(10) |
(10) |
(10) |
(10) |
(10) |
Net proceeds from issue of shares |
|
|
70 |
0 |
0 |
0 |
0 |
0 |
0 |
Dividends paid |
|
|
0 |
(6,300) |
(20,416) |
(20,479) |
(17,036) |
(18,688) |
(19,468) |
Other financing activities |
|
|
3,711 |
10,256 |
22,047 |
18,430 |
20,176 |
21,003 |
22,927 |
Cash from financing activities (CFF) |
|
|
3,781 |
3,956 |
1,631 |
(2,049) |
3,139 |
2,314 |
3,459 |
Increase/(decrease) in cash and equivalents |
|
|
2,181 |
2,662 |
1,287 |
(2,401) |
2,781 |
1,949 |
3,087 |
Cash and equivalents at end of period |
|
|
2,181 |
4,843 |
6,130 |
3,729 |
6,510 |
8,459 |
11,547 |
Net (debt) cash |
|
|
2,181 |
4,843 |
6,130 |
3,729 |
6,510 |
8,459 |
11,547 |
Movement in net (debt) cash over period |
|
|
2,181 |
2,662 |
1,287 |
(2,401) |
2,781 |
1,949 |
3,087 |
Source: Company data, Edison Investment Research
|
|||||||||||||||||||||||||||||||||||||
|
|
Research: Investment Companies
Acorn Income Fund (AIF) has come through a period of change with its impressive long-term record intact. The death of founding small-cap portfolio manager John McClure in June 2014 caused uncertainty and a widening in the discount, but co-managers Simon Moon and Fraser Mackersie at Unicorn Asset Management have provided continuity of management, and stock selection has driven outperformance and a re-rating in the shares. The fund blends the small-cap allocation with an income portfolio managed by Paul Smith at Premier Fund Managers, which helps boost income and reduce volatility.