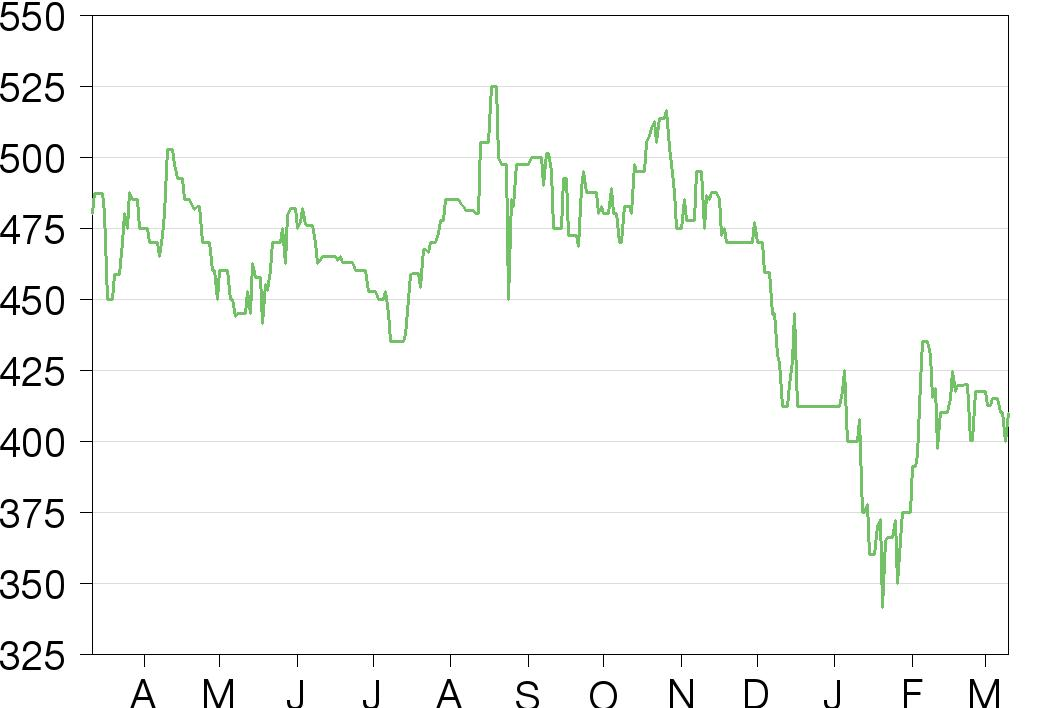
Unlocking hidden portfolio value
Imperial Innovations’ focus on ‘putting capital to work’ has seen significantly increased investment across its portfolio of maturing and rapidly emerging companies. £60.8m was invested into 30 portfolio companies during FY15 (vs £32.8m in FY14 across 25 companies), and £41.4m has been invested, or committed, so far in FY16 (since 1 August 2015).
As of 31 December 2015 the portfolio consisted of 103 companies, with a net portfolio value of £347.2m (vs £327.2m at 31 July 2015). The £20m portfolio uplift was comprised of investments of £21.2m across 14 companies, less disposals of £0.1m and fair value losses of £1.1m. Since 31 December, and excluding the recently committed investments in Precision Ocular (£6.9m) and Aqdot (£3m), Innovations reports that it invested a further £10.3m into the portfolio. This was offset by £0.9m of impairments in the unquoted portfolio, and a £7.6m reduction in the quoted portfolio (mainly affected by the wider biotech market sell-off), such that the estimated net portfolio value as of 4 February 2016 had increased slightly to £349m.
Fresh funding to support investment rate
Following the £100m (gross) equity raise and with c £239m now available for investment, we see the current investment rate increasing further, such that we now estimate £70m in portfolio investments in FY16 (vs £60m previously). We expect the bulk of investment to be made into the maturing portfolio of unquoted companies, which typically holds greatest potential for unlocking nearer-term hidden value through M&A or IPO. These companies include the likes of Cell Medica, PsiOxus Therapeutics and Veryan Medical, which secured significant investments in FY15 (see Exhibit 1) and are advancing their technologies and products to pivotal stages of development (see Exhibit 2).
Exhibit 1: Key healthcare funding rounds in FY15
Company |
Total funding (£m) |
Cash invested by IVO (£m) |
IVO commitment (£m) |
Net fair value gain (£m) |
Cell Medica |
50 |
7.5 |
15 |
5.6 |
PsiOxus |
25 |
6.2 |
7.0 |
8.5 |
Veryan Medical |
18 |
2.7 |
8.4 |
N/A |
Source: Edison Investment Research, Imperial Innovations
Exhibit 2: Upcoming healthcare company catalysts
Company |
Carrying value (31 July 2015) |
IVO stake (%) |
Description |
Next newsflow/catalyst |
Cell Medica |
21.04 |
27.0 |
Developing T-cell immunotherapy for treatment of virally associated cancer and viral infection post-bone marrow transplant. Cytovir CMV is available in the UK. Lead cancer immunotherapy product is CMD-003. |
■
CMD-003 Phase II CITADEL trial initiated – results expected end 2016/early 2017.
■
Commercial cell therapy manufacturing at Berlin facility has commenced, focused on Cytovir CMV.
■
Expansion of oncology pipeline.
|
PsiOxus |
22.62 |
27.9 |
Developing novel therapies for cancer-related diseases: an oncolytic virus Enadenotucirev (ColoAd1) for solid tumours, AbEnAd (antibody-armed-Enadenotucirev) and Espindaolol (MT-102) for cachexia. |
■
Phase I SPICE trial initiated combining enadenotucirev with pembrolizumab a checkpoint inhibitor (anti-PDL-1 MAb) in metastatic colorectal cancer – results expected 2017.
■
Develop AbEnAd through preclinical studies, while seeking partnerships – announce study start and/or partnership.
|
Veryan Medical |
20.89 |
48.2 |
3D helical stent for peripheral vascular use. Positive 24-month clinical study data vs market comparator. |
■
Secured distribution agreement for BioMimics 3D stent with Biosensors International for ex-US launch.
■
MIMICS-2 FDA PMA study enrolling – initial data expected end-2017 and PMA approval in 2018.
|
Source: Edison Investment Research, Imperial Innovations
Meanwhile the substantial investments recently made into Mission, Inivata and Precision Ocular, all relatively early-stage companies in terms of technology/product status, also show a flexibility to make appropriate investments across the full spectrum of the portfolio. These investments (or committed investments) and other portfolio company investments made so far in FY16 (ie since 31 July 2015) are summarised in Exhibit 3. Of particular note, the £60m committed to Mission Therapeutics is Innovations’ fourth portfolio company to raise over £40m in a single private funding round, and is substantially higher than the $25m average series C round for a European biotech company in 2015 (EvaluatePharma). We assume the recent financing round in Mission was equivalent to a series C, although technically not referred to as such; the last disclosed financing was a £20m series B.
Exhibit 3: Investments in FY16 (31 July 2015 onwards)
Date |
Company |
IVO investment (total raise) |
IVO stake* |
Description |
Feb 2016 |
Precision Ocular |
£6.9m (£13.5m) |
28.5% |
£13.5m funding round alongside existing investors Consort Medical, NeoMed and Hovione Scientia. Retinal implant technology for safer/better delivery of ophthalmic drugs. |
Feb 2016 |
Aqdot |
£3m (£5m) |
46.5% |
£5m series A funding round, alongside Cambridge Enterprise, Parkwalk Advisors and Providence Investment. Technology to encapsulate/protect/release active ingredients across range of sectors; initial focus on household products, fragrances, with future applications in agrochemicals/pharmaceuticals. |
Feb 2016 |
Mission Therapeutics |
£11.3m (£60m) |
21.6% |
£60m funding round, led by IVO and new investor, Woodford Patient Capital Trust, alongside existing shareholders Sofinnova Partners, SR One, Roche Venture Fund and Pfizer Venture Investments. Pre-clinical development of deubiquitinating (DUBs) enzyme inhibitors to treat cancer/neurodegenerative/other diseases. |
Jan 2016 |
Inivata |
£10m (£31.5m) |
30.6% |
£31.5m series A round, alongside existing investors Cambridge Innovation Capital, J&J Innovation, and new investor Woodford Patient Capital Trust. Inivata is developing circulating tumour DNA (ctDNA) analysis technology to improve cancer diagnosis using a simple blood test (‘liquid biopsy’). |
Jan 2016 |
Import.io |
Not disclosed (ND) |
ND |
$13m series A with Wellington Partners, Oxford Capital, Open Ocean, Delin Capital & AME Cloud Ventures. Proprietary technology converting websites into usable data. |
Dec 2015 |
Kesios Therapeutics |
£6m (£19m) |
42% |
£19m Series A round alongside co-investors SV Life Sciences and Abingworth. |
Dec 2015 |
WaveOptics |
ND |
ND |
“‘Multi-million pound” funding round, alongside Robert Bosch Venture Capital, Octopus Ventures, angel investors and Blippar. Augmented Reality technology display developer. |
Oct 2015 |
Telectica |
£1.3m (£1.5m) |
18.3% |
£1.5m seed funding round alongside angel investors. Artificial Intelligence technology to build insights into professional networks from interpreting web content. |
Oct 2015 |
Puridify |
(£2.2m; IVO not disclosed) |
ND |
£2.2m series A round, alongside existing investors SR One and UCL Business. Developer of novel bioprocessing purification technologies for industrial biomolecule manufacture. |
Sep 2015 |
Silicon Microgravity |
ND |
ND |
Seed investment in Sep 2015; followed by $3m funding round in Feb 2016 led by IVO with support from Cambridge Enterprise and UK government grant. Sensor development for oil and gas industry (reservoir management). |
Aug 2015 |
Garrison Technology |
(£2m; IVO not disclosed) |
ND |
£2m seed round alongside angel investors. Cyber security. |
Aug 2015 |
Oxford Biotrans |
£1.25m (£2.5m) |
41% |
£2.5m Series A alongside existing (IP Group / University of Oxford) and new investors (Oxford Innovation & Technology & EIS Fund and De Monchy Aromatics). Commercialisation of biocatalytic processes for production of high value speciality chemicals. |
Aug 2015 |
Orthonika |
£150k |
ND |
£150k seed funding alongside angel investors. Novel knee meniscus replacement. |
Source: Imperial Innovations, Edison Investment Research. Note: *IVO stake at deal date. Shading indicates new portfolio companies.
Novel technology sweet spot
Within the healthcare portfolio, the products/technologies being developed by Mission, Inivata and Precision Ocular demonstrate the sweet spot combination of innovation, market need and potential for disruptive technologies that Innovations seeks.
Mission is an early-stage drug discovery company focused on developing selective inhibitors of deubiquitinating (DUBs) enzymes. DUBs are involved in multiple cellular processes, including DNA damage and cell proliferation, so the inhibition of these enzymes holds potential to treat cancer and other unmet medical needs, including neurodegenerative disease, muscle wasting and infectious disease. Mission is not aware of any DUB inhibitors currently in clinical development, so the recent funding will help to accelerate the development of a series of first-in-class small molecule drugs candidates, targeting specific DUBs, into early clinical development.
Inivata is a cancer genomics company working in the burgeoning field of ‘liquid biopsies’, the concept that a simple blood test can be analysed to help diagnose multiple cancers, triage patient treatment options and monitor treatment response. Inivata’s technology is based on circulating DNA analysis (ctDNA) to detect and analyse genomic material from a cancer patient's cell-free, circulating tumour DNA collected from a blood sample. The fresh funds will be used to accelerate clinical studies to demonstrate the clinical benefits of Inivata’s technology.
Precision Ocular’s technology is focused on the optimum delivery and distribution of existing and new ophthalmic therapeutic agents, with the aim of increasing efficacy while reducing side-effects and minimising frequency of treatment. A wide range of retinal diseases are targeted, including age-related macular degeneration (AMD), diabetic macular edema (DME), retinal vein occlusion (RVO), uveitis and cystoid macular edema (CME). Notable co-investors in the financing round are Consort Medical and Hovione Scientia, specialists in the field of drug-delivery devices and particle engineering/drug encapsulation, respectively, with which Precision already has development collaborations. The funding will be used to develop novel candidates before proceeding into human clinical studies.
As a technology commercialisation and venture investment company, Innovations’ ability to replenish its portfolio of innovative technology companies via its primary/preferred partner status with some of the UK’s leading academic institutions is critical to the group’s long-term future. Operating almost exclusively within the so-called ‘golden triangle’ between London, Oxford and Cambridge (in the UK), Innovations has substantially strengthened its ties with University College London (UCL) and Cambridge University through two recent initiatives, to bolster its core collaboration with Imperial College, London.
In January 2016, Innovations announced that it had committed £24.75m to a new UCL Technology Fund, the first investment fund that UCL has created to commercialise its research. Innovations’ investment will be matched by the European Investment Fund, creating a total fund of £50m to invest over a five-year period, via early-stage proof of concept funding, licensing opportunities and the formation of spin-out companies within life sciences (not therapeutics) and physical sciences. The fund will be managed by Albion Ventures, a UK venture capital investor, while the UCL’s technology transfer company, UCL Business (UCLB), will be the technical advisor to the fund.
As a limited partner in the fund, Innovations now has visibility of potential intellectual property from across UCL’s research base, and will be offered co-investment opportunities or first-refusal rights to invest in projects that the fund decides not to invest in. As such, in addition to its £24.75m commitment to the fund, Innovations expects to also have opportunities to make direct investments into selected UCLB spin-outs that fit its technology and growth profile.
Also in January 2016, Innovations announced that it had committed £3.3m to a new £40m joint venture between AstraZeneca, GlaxoSmithKline, Johnson & Johnson and the technology transfer offices of three top UK universities (Imperial College London, UCL and Cambridge University), namely Innovations, UCLB and Cambridge Enterprise, respectively. The so-called Apollo Therapeutics Fund is a significant new enterprise within the tech-transfer sector, being the first time that global pharmaceutical companies and world-leading universities have collaborated to create this type of fund.
Each pharma company will contribute £10m over six years to the fund, with £3.3m invested from each technology transfer office (Innovations, UCLB, Cambridge Enterprise). The aim of Apollo is to advance academic pre-clinical research from the three universities to a stage at which it can either be taken forward by one of the pharma companies, following an internal bidding process, or be out-licensed. The pharma partners will also provide R&D expertise/resources to help with commercial evaluation and development of projects.
In summary, Innovations’ participation in the Apollo fund and strengthening relationship with UCL significantly enhance the group’s access to intellectual property and novel technologies from a broader university base and provide greater opportunity to collaborate with major pharma companies like AZ, GSK and J&J.
Focus on accelerated growth
As of 31 December 2015, the investment portfolio comprised 103 companies, of which Innovations classified 44 as ‘accelerated growth’ companies, and this sub-group represented 98.9% of the total net portfolio value (£347.2m vs £327.2m at 31 July 2015). The accelerated growth portfolio typically comprises businesses that Innovations has co-founded, actively invests in, holds a board seat and retains a majority interest in (typically 25-40%). A further 31 companies are deemed ‘lighter touch’, with less direct funding required but strategic advice given, while the remaining 28 companies are in the ‘low involvement’ category, where Innovations typically does not invest further without appropriate further development of the product/technology.
Accelerating the development of the private portfolio
As of 31 December 2015, the unquoted portfolio was valued at £239.6m (vs £220.5m at 31 July 2015), with the quoted portfolio valued at £107.7m (vs £106.8m). While the quoted portfolio is simply marked to market value, a substantial portion (c 95%) of the unquoted portfolio is valued at cost or last funding round, with only a small amount of value (c 3%) attributed to the last funding round and adjusted for milestones and impairments. As of 31 July 2015, the carrying value of the unquoted portfolio was just 1.3x the cumulative cash invested into these companies. Consequently, additional investment and the positive outcome of key catalysts have the potential to unlock hidden value.
The development of public companies will typically offer the prospect of significant near-to-medium-term gains/losses as newsflow will have a more pronounced and immediate impact. One obvious near-term example is the Phase III data due in Q216 from Circassia’s Cat-SPIRE study with its allergy immunotherapy technology. However, the unquoted portfolio offers the prospect of longer-term growth, especially as a number of Innovations’ maturing ‘accelerated growth’ companies approach important catalysts. Achieving technical, clinical and commercial milestones should prompt greater valuation uplifts in the future.
We again highlight the potential valuation discrepancy with the likes of Cell Medica and PsiOxus and publicly traded biotech companies focused on cancer immunotherapy companies that are developing similar technologies. The respective implied valuations of these companies (as of 31 July) of £78m and £81m remain significantly lower than peers such as Juno Therapeutics ($3.9bn), Kite Pharma ($2.3bn) and Bellicum Pharmaceuticals ($250m) even after significant recent falls in share prices across much of the NASDAQ biotech sector.
Going public… or heading for an exit
Other mechanisms for unlocking portfolio value from the unquoted portfolio include IPOs or trade sales. Innovations has had success on both fronts. Its four healthcare holdings (Circassia, Abzena, Oxford Immunotec and Ixico) that listed in 2014 accounted for £106.8m (32.6%) of the portfolio (at 31 July 2015), with all except Ixico ranked within the top 10 portfolio investments. The top 20 portfolio companies (as of 31 July 2015) are presented in Exhibit 4.
Exhibit 4: Innovations’ top 20 portfolio companies (as of 31 July 2015)
Company |
Value (£m) |
Invested (£m) |
% share owned |
Sector |
Description |
Circassia |
79.75 |
25.50 |
9.3 |
Therapeutics |
Developing therapies for allergy, asthma and COPD. FTSE250 since Sept 2015. |
Nexeon |
34.09 |
22.37 |
39.3 |
Materials |
Battery and licensing silicon anodes for next generation lithium-ion (Li-ion) batteries; consumer product/electric vehicle markets. |
PsiOxus Therapeutics |
22.62 |
13.68 |
27.9 |
Therapeutics |
Developing novel therapeutics for serious diseases, with a particular focus on oncolytic virus vaccines for cancer. |
Cell Medica |
21.04 |
12.31 |
27.0 |
Therapeutics |
Cellular immunotherapy company developing therapeutics for oncogenic virus-related cancers oncogenic viruses and infections following bone marrow transplant |
Veryan Medical |
20.89 |
13.71 |
48.2 |
Medtech |
Vascular disease specialist that has developed a 3D helical stent, BioMimics 3D, for peripheral vascular use. |
Abzena |
17.77 |
10.48 |
23.4 |
Therapeutics |
Developing site-specific conjugation technologies (proteins, peptides, antibodies etc), low viscosity polymers and targeted drug delivery to enhance biopharmaceuticals. Immunogenicity screening. |
Yoyo Wallet* |
9.513 |
6.97 |
51.4 |
ICT |
‘App’ that allows mobile payments with integrated loyalty schemes. |
Plaxica |
9.45 |
9.00 |
45.7 |
Materials |
Development of polylactic acid-based biopolymers from renewable resources. |
Oxford Immunotec |
8.78 |
7.59 |
4.6 |
Medtech |
Global, commercial stage diagnostics company developing diagnostic tests in the field of immunological disease. Lead product is T-SPOT TB test for latent TB infection, which is approved for sale in >50 countries. |
Autifony Therapeutics |
8.56 |
7.50 |
26.9 |
Therapeutics |
Development of novel pharmaceuticals to treat hearing disorders and CNS disorders. |
Cortexica |
7.73 |
7.85 |
30.0 |
ICT |
Cloud-based image recognition systems and mobile visual search and categorisation technology. |
Abingdon Health |
7.72 |
8.29 |
33.7 |
Diagnostics |
Specialist medical diagnostics company. |
TopiVert |
7.54 |
7.44 |
30.6 |
Therapeutics |
Developing narrow spectrum kinase inhibitor (NSKI) as a topical therapy for inflammatory diseases of the gut and eye. |
Featurespace |
6.79 |
3.89 |
37.5 |
ICT |
Predictive analytics using a behaviour analytics engine (ARIC). |
Crescendo Biologics |
6.50 |
6.50 |
22.7 |
Therapeutics |
Human antibody fragment therapeutics. |
Econic Technologies |
6.15 |
4.40 |
56.1 |
Materials |
Developing novel catalytic processes for polymer manufacture using waste carbon dioxide as feedstock. |
Mission Therapeutics** |
6.01 |
5.83 |
21.2 |
Therapeutics |
Developing cancer therapeutics targetingdeubiquitinating enzymes (DNA damage response). |
Kesios Therapeutics** |
4.61 |
2.85 |
51.4 |
Therapeutics |
Developing therapeutics for multiple myeloma and other haematological cancers based on a novel NFκB signalling pathway drug target. |
Pulmocide |
3.50 |
3.50 |
25.0 |
Therapeutics |
Developing inhaled therapeutics for life threatening respiratory infections. |
Impression Technologies |
3.26 |
1.86 |
59.1 |
Materials |
Aluminium alloy technology formation business for use in the transportation industry. |
Other |
34.97 |
29.15 |
N/A |
|
|
Net total |
327.22 |
210.67 |
|
|
|
Source: Imperial Innovations (FY15 results). Note: Net investment carrying value, cash invested and % ownership at 31 July 2015. Carrying values reflect the net fair value of the investment (gross value less attributable revenue-sharing obligation). Shading indicates public companies. *Previously called Just Yoyo. **Value/investment/% stake not reflective of more recent financing rounds.
2016: A year for rebalancing towards technology
Innovations intends to maintain or increase its current rate of portfolio investment while increasing its capacity for identifying and managing investments. Key hires in its ventures team and positioning as the collaborative partner of choice for technology transfer offices/university venture funds should help achieve this. Extensive expertise in healthcare (therapeutics/medtech) has generated a sector that accounted for 73.7% (£233m) of total portfolio value at 31 July 2015. The focus for 2016 will be on replicating this success in other sectors and rebalancing the investment portfolio by building up activities in the non-therapeutic space. Innovations is seeking to increase the relative contributions of other sectors, in particular ICT/digital, which was only 9.9% (£32.3m) of the portfolio, although this partly reflects the low capital intensity of ICT and the successful execution of three trade sales in past two years. Increased investment in Yoyo, Impression Technologies and Featurespace,2 and the recent additions of Garrison Technology, Import.io, Telectica and WaveOptics to the ICT portfolio demonstrate this intent.
As of 31 December 2015, Innovations’ portfolio consisted of 103 companies, with a net portfolio value of £347.2m (vs £327.2m at 31 July 2015). The £20m portfolio uplift was comprised of investments of £21.2m across 14 companies, less disposals of £0.1m and fair value losses of £1.1m. Since 31 December, and excluding the recently committed investments in Precision Ocular (£6.9m) and Aqdot (£3m), Innovations reports that it invested a further £10.3m into the portfolio. This was offset by £0.9m of impairments in the unquoted portfolio, and a £7.6m reduction in the quoted portfolio (mainly affected by the wider biotech market sell-off), such that the estimated net portfolio value as of 4 February 2016 had increased slightly to £349m.
The recent capital raise, which grossed £100m (£97.5m net estimate) through the placing of 23.5m new shares at 425p, primarily to IVO’s major institutional shareholders (Woodford 56%, Invesco 25%, Lansdowne 7%), significantly increases Innovations’ financial position. When added to the £91.6m held in cash at 29 January 2016 (as reported by IVO) and the £50m EIB loan facility (currently undrawn), we estimate that Innovations has c £239m available for investment.
As such, we now see the investment rate increasing further and estimate £70m in portfolio investments in FY16 (vs £60m previously). We note that £41.4m has been invested, or committed, so far in FY16 (since 1 August 2015), which compares to £60.8m invested during FY15 and £32.8m in FY14. We have now extended our financial forecasts to FY17 (Exhibit 5) and predict a similar portfolio investment rate of £70m in FY17. We currently assume that £30m of the total £50m EIB loan is drawn-down in FY17; this second EIB loan was granted to Innovations in July 2015 and can be drawn in £10m minimum tranches until July 2017. We note that Innovations drew down the full £30m from its first EIB loan (in two £15m tranches in FY14 and FY15).
Our FY16 revenue forecast of £5m (revenues derived from licensing/royalties, services and corporate finance) is maintained in-line with FY15 (£5.1m) at this stage, although we note that Innovations has emphasised the potential for greater revenue growth over the medium to long term. During FY15, 39 new licences were signed and 66 patents filed, demonstrating the ongoing robustness of the Innovations IP portfolio.
With relatively stable operating expenses, Innovations’ profitability is dependent on the level of fair value gains/losses in specific periods taken through the P&L. Gains and losses are inherently difficult to predict. Our change in net fair value estimate for FY16 now reflects an estimated loss of £4m (vs a £10m gain previously), mainly as a result of the reported £9.8m net fair value loss in the quoted portfolio in H116 (1 August 2015 to 29 January 2016). We expect some fair value gains (c £5m) to be recorded in H216 (as portfolio companies progress), but acknowledge that the major swing factor will be the results of Circassia’s Cat-SPIRE Phase III study in Q216, which is likely to have a materially positive or negative impact on Innovations’ fair value for its holding. We estimate a £15m fair value gain in FY17, although this could be conservative in the context of a maturing company portfolio approaching important catalysts.
Exhibit 5: Financial summary
|
|
£'000s |
2013 |
2014 |
2015 |
2016e |
2017e |
Year end 31 July |
|
|
IFRS |
IFRS |
IFRS |
IFRS |
IFRS |
PROFIT & LOSS |
|
|
|
|
|
|
|
Revenue |
|
|
3,290 |
3,636 |
5,099 |
5,041 |
5,165 |
Cost of sales |
|
|
(788) |
(1,005) |
(1,769) |
(1,707) |
(1,759) |
Gross profit |
|
|
2,502 |
2,631 |
3,330 |
3,334 |
3,406 |
EBITDA |
|
|
(6,940) |
(8,385) |
(8,223) |
(8,798) |
(9,333) |
Operating profit (before GW and except.) |
(6,972) |
(8,418) |
(8,237) |
(8,812) |
(9,347) |
Fair value gains/losses |
|
|
10,794 |
40,549 |
21,324 |
(4,000) |
15,000 |
Impairments |
|
|
(3,492) |
0 |
0 |
0 |
0 |
Share-based payment |
|
|
2,358 |
(4,821) |
1,161 |
400 |
(1,500) |
Operating profit |
|
|
2,688 |
27,310 |
14,248 |
(12,412) |
4,153 |
Net interest |
|
|
1,072 |
106 |
817 |
348 |
(218) |
Profit before tax (norm) |
|
|
(5,900) |
(8,312) |
(7,420) |
(8,464) |
(9,565) |
Profit before tax (FRS 3) |
|
|
3,760 |
27,416 |
15,065 |
(12,064) |
3,935 |
Tax |
|
|
0 |
0 |
0 |
0 |
0 |
Profit after tax (norm) |
|
|
(5,900) |
(8,312) |
(7,420) |
(8,464) |
(9,565) |
Profit after tax (FRS 3) |
|
|
3,760 |
27,416 |
15,065 |
(12,064) |
3,935 |
|
|
|
|
|
|
|
|
Average number of shares outstanding (m) |
|
81.2 |
102.4 |
136.2 |
148.9 |
160.7 |
EPS - normalised (p) |
|
|
(7.3) |
(8.1) |
(5.4) |
(5.7) |
(6.0) |
EPS - FRS 3 (p) |
|
|
4.6 |
26.8 |
11.1 |
(8.1) |
2.4 |
Dividend per share (p) |
|
|
0.0 |
0.0 |
0.0 |
0.0 |
0.0 |
|
|
|
|
|
|
|
|
BALANCE SHEET |
|
|
|
|
|
|
|
Fixed assets |
|
|
188,261 |
258,327 |
333,936 |
400,263 |
485,275 |
Tangible assets |
|
|
36 |
26 |
29 |
35 |
46 |
Intangible assets |
|
|
0 |
0 |
0 |
0 |
0 |
Investment Portfolio |
|
|
187,649 |
257,105 |
333,268 |
399,268 |
484,268 |
UCSF (University Challenge Seed Fund) investments |
517 |
543 |
460 |
460 |
460 |
UCSF loans |
|
|
0 |
0 |
0 |
0 |
0 |
Other |
|
|
59 |
653 |
179 |
500 |
501 |
Financial asset |
|
|
0 |
0 |
0 |
0 |
0 |
Current assets |
|
|
67,130 |
177,800 |
130,506 |
146,759 |
94,850 |
Cash and cash equivalents |
|
|
65,597 |
176,462 |
128,097 |
144,378 |
92,410 |
Financial asset |
|
|
0 |
0 |
0 |
0 |
0 |
Accounts receivable, net |
|
|
1,533 |
1,338 |
2,409 |
2,382 |
2,440 |
Current liabilities |
|
|
(3,391) |
(4,900) |
(5,732) |
(5,732) |
(5,732) |
Trade accounts payable |
|
|
(3,391) |
(4,900) |
(4,232) |
(4,232) |
(4,232) |
Short-term borrowings |
|
|
0 |
0 |
(1,500) |
(1,500) |
(1,500) |
Long-term liabilities |
|
|
(21,542) |
(26,445) |
(38,639) |
(35,245) |
(62,123) |
Long-term borrowings |
|
|
(14,814) |
(14,830) |
(27,222) |
(24,500) |
(52,050) |
UCSF |
|
|
(605) |
(640) |
(666) |
(666) |
(666) |
Provisions |
|
|
(6,123) |
(10,975) |
(10,751) |
(10,079) |
(9,407) |
Net assets |
|
|
230,458 |
404,782 |
420,071 |
506,046 |
512,270 |
NAV/share (p) |
|
|
231 |
295 |
306 |
315 |
319 |
|
|
|
|
|
|
|
|
CASH FLOW |
|
|
|
|
|
|
|
Operating cash flow |
|
|
(7,465) |
(6,523) |
(9,331) |
(8,825) |
(9,274) |
Net Interest |
|
|
921 |
44 |
875 |
348 |
(218) |
Tax |
|
|
0 |
0 |
0 |
0 |
0 |
Capex |
|
|
(4) |
(23) |
(17) |
(20) |
(25) |
Purchase of trade investments |
|
|
(22,185) |
(32,826) |
(59,957) |
(70,000) |
(70,000) |
Proceeds from sale of trade investments |
|
|
396 |
3,370 |
6,190 |
0 |
0 |
Revenue share paid on asset realisations in trade investments |
|
|
(172) |
0 |
0 |
0 |
0 |
Equity financing |
|
|
36,990 |
146,823 |
0 |
97,500 |
0 |
Short term liquidity investments |
|
|
(1,581) |
0 |
0 |
0 |
0 |
Net cash flow |
|
|
6,900 |
110,865 |
(62,240) |
19,003 |
(79,518) |
Opening net debt/(cash) |
|
|
(43,883) |
(50,783) |
(161,632) |
(99,375) |
(118,378) |
Other |
|
|
0 |
(16) |
(17) |
0 |
0 |
Closing net debt/(cash) |
|
|
(50,783) |
(161,632) |
(99,375) |
(118,378) |
(38,860) |
Source: Imperial Innovations, Edison Investment Research
Edison, the investment intelligence firm, is the future of investor interaction with corporates. Our team of over 100 analysts and investment professionals work with leading companies, fund managers and investment banks worldwide to support their capital markets activity. We provide services to more than 400 retained corporate and investor clients from our offices in London, New York, Frankfurt, Sydney and Wellington. Edison is authorised and regulated by the Financial Conduct Authority (www.fsa.gov.uk/register/firmBasicDetails.do?sid=181584). Edison Investment Research (NZ) Limited (Edison NZ) is the New Zealand subsidiary of Edison. Edison NZ is registered on the New Zealand Financial Service Providers Register (FSP number 247505) and is registered to provide wholesale and/or generic financial adviser services only. Edison Investment Research Inc (Edison US) is the US subsidiary of Edison and is regulated by the Securities and Exchange Commission. Edison Investment Research Limited (Edison Aus) [46085869] is the Australian subsidiary of Edison and is not regulated by the Australian Securities and Investment Commission. Edison Germany is a branch entity of Edison Investment Research Limited [4794244]. www.edisongroup.com DISCLAIMER
Copyright 2016 Edison Investment Research Limited. All rights reserved. This report has been commissioned by Imperial Innovations and prepared and issued by Edison for publication globally. All information used in the publication of this report has been compiled from publicly available sources that are believed to be reliable, however we do not guarantee the accuracy or completeness of this report. Opinions contained in this report represent those of the research department of Edison at the time of publication. The securities described in the Investment Research may not be eligible for sale in all jurisdictions or to certain categories of investors. This research is issued in Australia by Edison Aus and any access to it, is intended only for "wholesale clients" within the meaning of the Australian Corporations Act. The Investment Research is distributed in the United States by Edison US to major US institutional investors only. Edison US is registered as an investment adviser with the Securities and Exchange Commission. Edison US relies upon the "publishers' exclusion" from the definition of investment adviser under Section 202(a)(11) of the Investment Advisers Act of 1940 and corresponding state securities laws. As such, Edison does not offer or provide personalised advice. We publish information about companies in which we believe our readers may be interested and this information reflects our sincere opinions. The information that we provide or that is derived from our website is not intended to be, and should not be construed in any manner whatsoever as, personalised advice. Also, our website and the information provided by us should not be construed by any subscriber or prospective subscriber as Edison’s solicitation to effect, or attempt to effect, any transaction in a security. The research in this document is intended for New Zealand resident professional financial advisers or brokers (for use in their roles as financial advisers or brokers) and habitual investors who are “wholesale clients” for the purpose of the Financial Advisers Act 2008 (FAA) (as described in sections 5(c) (1)(a), (b) and (c) of the FAA). This is not a solicitation or inducement to buy, sell, subscribe, or underwrite any securities mentioned or in the topic of this document. This document is provided for information purposes only and should not be construed as an offer or solicitation for investment in any securities mentioned or in the topic of this document. A marketing communication under FCA Rules, this document has not been prepared in accordance with the legal requirements designed to promote the independence of investment research and is not subject to any prohibition on dealing ahead of the dissemination of investment research. Edison has a restrictive policy relating to personal dealing. Edison Group does not conduct any investment business and, accordingly, does not itself hold any positions in the securities mentioned in this report. However, the respective directors, officers, employees and contractors of Edison may have a position in any or related securities mentioned in this report. Edison or its affiliates may perform services or solicit business from any of the companies mentioned in this report. The value of securities mentioned in this report can fall as well as rise and are subject to large and sudden swings. In addition it may be difficult or not possible to buy, sell or obtain accurate information about the value of securities mentioned in this report. Past performance is not necessarily a guide to future performance. Forward-looking information or statements in this report contain information that is based on assumptions, forecasts of future results, estimates of amounts not yet determinable, and therefore involve known and unknown risks, uncertainties and other factors which may cause the actual results, performance or achievements of their subject matter to be materially different from current expectations. For the purpose of the FAA, the content of this report is of a general nature, is intended as a source of general information only and is not intended to constitute a recommendation or opinion in relation to acquiring or disposing (including refraining from acquiring or disposing) of securities. The distribution of this document is not a “personalised service” and, to the extent that it contains any financial advice, is intended only as a “class service” provided by Edison within the meaning of the FAA (ie without taking into account the particular financial situation or goals of any person). As such, it should not be relied upon in making an investment decision. To the maximum extent permitted by law, Edison, its affiliates and contractors, and their respective directors, officers and employees will not be liable for any loss or damage arising as a result of reliance being placed on any of the information contained in this report and do not guarantee the returns on investments in the products discussed in this publication. FTSE International Limited (“FTSE”) © FTSE 2016. “FTSE®” is a trade mark of the London Stock Exchange Group companies and is used by FTSE International Limited under license. All rights in the FTSE indices and/or FTSE ratings vest in FTSE and/or its licensors. Neither FTSE nor its licensors accept any liability for any errors or omissions in the FTSE indices and/or FTSE ratings or underlying data. No further distribution of FTSE Data is permitted without FTSE’s express written consent. |
Frankfurt +49 (0)69 78 8076 960 Schumannstrasse 34b 60325 Frankfurt Germany |
London +44 (0)20 3077 5700 280 High Holborn London, WC1V 7EE United Kingdom |
New York +1 646 653 7026 245 Park Avenue, 39th Floor 10167, New York US |
Sydney +61 (0)2 9258 1161 Level 25, Aurora Place 88 Phillip St, Sydney NSW 2000, Australia |
Wellington +64 (0)48 948 555 Level 15, 171 Featherston St Wellington 6011 New Zealand |
Frankfurt +49 (0)69 78 8076 960 Schumannstrasse 34b 60325 Frankfurt Germany |
London +44 (0)20 3077 5700 280 High Holborn London, WC1V 7EE United Kingdom |
New York +1 646 653 7026 245 Park Avenue, 39th Floor 10167, New York US |
Sydney +61 (0)2 9258 1161 Level 25, Aurora Place 88 Phillip St, Sydney NSW 2000, Australia |
Wellington +64 (0)48 948 555 Level 15, 171 Featherston St Wellington 6011 New Zealand |
|