Last close As at 05/08/2026
GBP1.04
▲ 6.95 (7.15%)
Market capitalisation
GBP2,539m
Research: Metals & Mining
On 29 July, Pan African Resources (PAF) announced it had produced 186,039oz gold in FY24 at an all-in sustaining cost (AISC) of US$1,350/oz. This was within the previously guided range of 186–190koz at an AISC of US$1,325–1,350/oz and was 212oz (0.1%) above our expectation of 185,827oz. Production guidance for FY25 was reiterated at 215–225koz (cf Edison’s unchanged and relatively conservative forecast of 216.6koz). Our financial forecasts for FY24 remain little changed as a result of PAF’s announcement. However, we have increased our forecasts for FY25 to reflect the gold price remaining high into H2 CY24.
Pan African Resources |
Hitting expectations |
FY24 production outcome |
Metals and mining |
31 July 2024 |
Share price performance
Business description
Next events
Analyst
Pan African Resources is a research client of Edison Investment Research Limited |
|||||||||||||||||||||||||||||||||||||||||||||||||||||||||||||||
On 29 July, Pan African Resources (PAF) announced it had produced 186,039oz gold in FY24 at an all-in sustaining cost (AISC) of US$1,350/oz. This was within the previously guided range of 186–190koz at an AISC of US$1,325–1,350/oz and was 212oz (0.1%) above our expectation of 185,827oz. Production guidance for FY25 was reiterated at 215–225koz (cf Edison’s unchanged and relatively conservative forecast of 216.6koz). Our financial forecasts for FY24 remain little changed as a result of PAF’s announcement. However, we have increased our forecasts for FY25 to reflect the gold price remaining high into H2 CY24.
Year |
Revenue |
PBT* |
EPS* |
DPS |
P/E |
Yield |
06/22 |
376.4 |
117.2 |
4.44 |
1.04 |
8.1 |
2.9 |
06/23 |
321.6 |
92.9 |
3.54 |
0.95 |
10.2 |
2.6 |
06/24e |
390.7 |
142.0 |
5.72 |
0.98 |
6.3 |
2.7 |
06/25e |
473.9 |
211.4 |
8.02 |
0.98 |
4.5 |
2.7 |
Note: *PBT and EPS are normalised, excluding amortisation of acquired intangibles and exceptional items.
MTR ahead on time and budget
All operations outperformed our prior expectations except for Evander, which experienced a delay in commissioning the ventilation shaft for hoisting at eight shaft underground operations. In addition to its production and cost numbers, PAF also reported that ‘exceptional progress’ had been made in the construction of its new Mogale Tailings Retreatment (MTR) project, which is nearing its final stages within budget and ahead of schedule. Plant commissioning and first gold production is now anticipated ahead of schedule in October 2024, with steady state production in December 2024.
Valuation: Trending higher
Given our updated forecasts, our core (absolute) valuation of Pan African has increased from 48.08c per share to 48.41c per share (37.72p), based on projects either sanctioned or already in production. This valuation rises by a further 22.35–27.37c if other assets (eg Egoli and the Soweto cluster) are also taken into account. Alternatively, if PAF’s historical average price to normalised headline earnings per share (HEPS) ratio of 8.4x in the period FY10–23 is applied to our FY24 and FY25 forecasts, it implies a value of 37.41p in FY24, followed by 52.43p in FY25. As such, PAF’s current share price of 28.15p could be interpreted as discounting normalised HEPS falling to 4.31c per share (cf our forecasts of 5.72c/share for FY24 and 8.02c/share for FY25). In the meantime, PAF remains cheaper than its principal London- and South African-listed gold mining peers on at least 69% of commonly used valuation measures, regardless of whether they are based on Edison or consensus forecasts. Performing a relative valuation analysis, its peers imply a comparable valuation for PAF of 52.31p based on our year one EPS estimate and one of 48.49p based on our year two EPS estimate. Separately, we estimate that PAF has the 24th highest dividend yield of the 61 precious metals mining companies expected to pay dividends to shareholders over the next 12 months (globally). Finally, we calculate that PAF is trading at an enterprise value that equates to just US$19.72 per resource ounce of gold.
Updated FY24 financial forecasts
Pan African’s group production for FY24 was very close to our prior expectation, albeit reflecting general outperformance at its Barberton operations and Elikhulu and underperformance at Evander, where a delay in commissioning the ventilation shaft for hoisting at eight shaft underground operations adversely affected production in May and June.
Exhibit 1: Pan African production, H121–FY25e (oz)
Operation |
H121 |
H221 |
H122 |
H222 |
H123 |
H223 |
H124 |
H224e (prior) |
H224e (current) |
Variance (%) |
Variance (oz) |
FY24e (current) |
FY25e |
Barberton UG |
42,350 |
42,476 |
39,991 |
35,747 |
32,022 |
32,564 |
36,780 |
33,175 |
34,690 |
+4.6 |
+1,515 |
71,470 |
79,235 |
BTRP |
10,004 |
8,235 |
9,126 |
10,434 |
10,012 |
9,863 |
9,864 |
8,500 |
9,024 |
+6.2 |
+524 |
18,888 |
10,000 |
Barberton |
52,354 |
50,711 |
49,117 |
46,181 |
42,034 |
42,427 |
46,644 |
41,675 |
43,714 |
+4.9 |
+2,039 |
90,358 |
89,235 |
Evander UG |
12,607 |
23,409 |
27,312 |
21,538 |
19,173 |
10,359 |
21,307 |
19,693 |
17,161 |
-12.9 |
-2,532 |
38,468 |
53,196 |
Evander surface |
6,560 |
4,677 |
5,756 |
3,564 |
5,270 |
5,373 |
2,401 |
99 |
0 |
-100.0 |
-99 |
2,401 |
0 |
Evander |
19,169 |
28,086 |
33,068 |
25,102 |
24,443 |
15,732 |
23,708 |
19,792 |
17,161 |
-13.3 |
-2,631 |
40,869 |
53,196 |
Elikhulu |
26,863 |
24,596 |
25,900 |
26,320 |
25,830 |
24,743 |
28,106 |
25,902 |
26,706 |
+3.1 |
+804 |
54,812 |
48,219 |
MTR |
25,956 |
||||||||||||
Total |
98,386 |
103,391 |
108,085 |
97,603 |
92,307 |
82,902 |
98,458 |
87,369 |
87,581 |
+0.2 |
+212 |
186,039 |
216,606 |
Source: Edison Investment Research, Pan African Resources. Note: Totals may not add up owing to rounding. UG, underground. BTRP, Barberton Tailings Retreatment Project.
The resulting effect on our financial forecasts for FY24 was, therefore, minimal, as shown in Exhibit 2, below:
Exhibit 2: Pan African P&L statement by half year (H122–H224e)
US$000s* |
H122 |
H222 |
H123 |
H223 |
H124 |
H224e (prior) |
H224e (current) |
Variance (%) |
FY24e (current) |
FY24e (prior) |
Revenue |
193,574 |
182,797 |
156,489 |
165,117 |
193,947 |
196,376 |
196,763 |
0.2 |
390,710 |
390,323 |
Cost of production |
(108,368) |
(118,077) |
(99,282) |
(99,508) |
(110,292) |
(98,695) |
(98,789) |
0.1 |
(209,081) |
(208,987) |
Depreciation |
(13,268) |
(13,160) |
(11,122) |
(9,277) |
(10,768) |
(11,146) |
(11,144) |
0.0 |
(21,912) |
(21,914) |
Mining profit |
71,938 |
51,560 |
46,085 |
56,332 |
72,887 |
86,535 |
86,831 |
0.3 |
159,718 |
159,422 |
Other income/(expenses) |
(7,711) |
(2,117) |
(3,610) |
(3,737) |
(7,231) |
(23,720) |
(22,474) |
(5.3) |
(29,705) |
(30,951) |
Loss in associate etc |
0 |
0 |
0 |
0 |
0 |
0 |
0 |
N/A |
0 |
0 |
Loss on disposals |
0 |
0 |
0 |
0 |
0 |
0 |
0 |
N/A |
0 |
0 |
Impairments |
0 |
(467) |
0 |
0 |
0 |
0 |
0 |
N/A |
0 |
0 |
Royalty costs |
(1,316) |
(780) |
(468) |
(495) |
(1,242) |
(2,460) |
(2,465) |
0.2 |
(3,707) |
(3,702) |
Net income before finance |
62,910 |
48,197 |
42,007 |
52,100 |
64,414 |
60,354 |
61,891 |
2.5 |
126,305 |
124,768 |
Finance income |
661 |
434 |
456 |
683 |
760 |
N/A |
||||
Finance costs |
(1,945) |
(3,381) |
(3,464) |
(6,228) |
(5,594) |
N/A |
||||
Net finance income |
(1,285) |
(2,946) |
(3,008) |
(5,545) |
(4,834) |
(9,201) |
(9,201) |
0.0 |
(14,035) |
(14,035) |
Profit before taxation |
61,626 |
45,250 |
38,999 |
46,555 |
59,580 |
51,154 |
52,691 |
3.0 |
112,271 |
110,734 |
Taxation |
(15,573) |
(16,351) |
(10,063) |
(14,754) |
(17,223) |
(14,845) |
(15,297) |
3.0 |
(32,520) |
(32,068) |
Effective tax rate (%) |
25.3 |
36.1 |
25.8 |
31.7 |
28.9 |
29.0 |
29.0 |
0.0 |
29.0 |
29.0 |
PAT (continuing ops) |
46,053 |
28,899 |
28,936 |
31,801 |
42,357 |
36,309 |
37,393 |
3.0 |
79,750 |
78,666 |
Minority interest |
(185) |
(136) |
(266) |
(224) |
0 |
0 |
N/A |
(224) |
(224) |
|
Ditto (%) |
(0.6) |
(0.5) |
(0.8) |
(0.5) |
0.0 |
0.0 |
N/A |
(0.3) |
(0.3) |
|
Attributable profit |
29,084 |
29,072 |
32,067 |
42,581 |
36,309 |
37,393 |
3.0 |
79,974 |
78,890 |
|
|
|
|||||||||
Headline earnings |
46,053 |
29,551 |
29,072 |
31,392 |
42,581 |
36,309 |
37,393 |
3.0 |
79,974 |
78,890 |
Est normalised headline earnings |
53,764.1 |
31,668 |
32,682 |
35,129 |
49,812 |
60,029 |
59,867 |
(0.3) |
109,679 |
109,841 |
|
|
|
||||||||
EPS (c) |
2.39 |
1.51 |
1.52 |
1.67 |
2.22 |
1.89 |
1.95 |
3.2 |
4.17 |
4.12 |
HEPS** (c) |
2.39 |
1.54 |
1.52 |
1.63 |
2.22 |
1.89 |
1.95 |
3.2 |
4.17 |
4.12 |
Normalised HEPS (c) |
2.79 |
1.65 |
1.71 |
1.83 |
2.60 |
3.13 |
3.12 |
(0.3) |
5.72 |
5.73 |
Source: Pan African Resources, Edison Investment Research. Note: As reported basis. *Unless otherwise indicated. **HEPS, headline earnings per share (South African company adjusted basis).
Net debt was reported to be US$106.4m, which was slightly above our prior forecast of US$93.8m, but included an additional US$9.9m capex during the year for the group’s solar power initiative at Fairview, which is not typically included in our models.
Group production
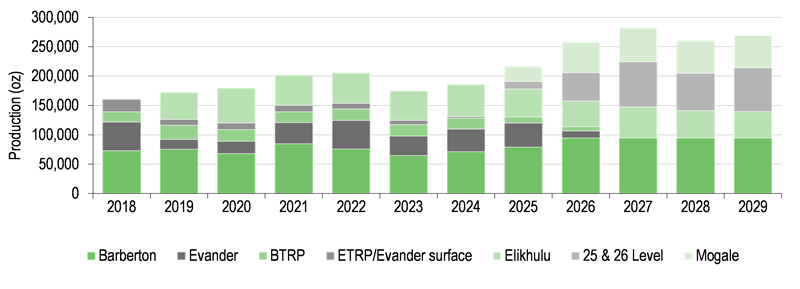
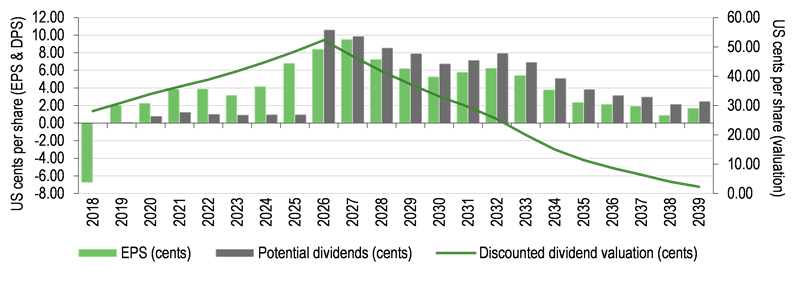
In the wake of the company’s FY24 production and cost update, our longer-term forecasts remain unchanged, with output expected to break the 250ktpa barrier in FY26, driving normalised HEPS beyond 6.00c per share and potentially as high as 9.00c per share (see Exhibit 4).
|
Exhibit 3: Estimated Pan African group gold production profile, FY18–FY29e |
|
|
Source: Edison Investment Research, Pan African Resources |
Updated (absolute) valuation
In the light of PAF’s announcement, our absolute valuation of the company (based on its existing four producing assets plus the 25 and 26 Level project and Mogale) has increased from 48.08c previously to 48.41c, based on the present value of the estimated maximum potential stream of dividends payable to shareholders over the life of its mining operations (applying a 10% discount rate).
|
Exhibit 4: Pan African estimated life of operations’ EPS and (maximum potential*) DPS |
|
|
Source: Pan African Resources, Edison Investment Research. Note: Excludes discretionary exploration investment. *From FY26. |
Including its other growth projects and assets, our updated total valuation of PAF is as follows:
Exhibit 5: Pan African absolute valuation summary
Project |
Current valuation |
Previous valuation |
Existing producing assets (including 24 Level and 25 & 26 Level and Mogale projects) |
48.41 |
48.08 |
Cum-FY24 dividend |
0.98 |
0.99 |
Royal Sheba* |
0.98 |
0.93 |
Other |
1.70 |
1.61 |
Sub-total |
52.07 |
51.61 |
EGM underground resource |
0.22–5.24 |
0.22–5.24 |
Sub-total |
52.29–57.31 |
51.83–56.85 |
Egoli |
16.98 |
16.94 |
Soweto cluster |
1.49 |
1.48 |
Total |
70.76–75.78 |
70.25–75.27 |
Source: Edison Investment Research. Note: Numbers may not add up owing to rounding. *Resource based valuation.
Historical relative and current peer group valuation
Historical relative valuation
Exhibit 6 depicts PAF’s average share price in each of its financial years from FY10 to FY23 and compares this with HEPS in the same year. For FY24e and FY25e, the current share price (28.15p) is compared with our forecast normalised HEPS for those years. PAF’s price to normalised HEPS ratios of 6.3x and 4.5x for FY24 and FY25, respectively (based on our forecasts, see Exhibits 2 and 8) remain firmly towards the bottom of the range of recent historical P/E ratios of 4.1x (in FY20) to 14.8x (in FY15) for the period FY10–23.
|
Exhibit 6: Pan African historical price to normalised HEPS** ratio, FY10–FY25e |
|
|
Source: Edison Investment Research, Pan African Resources. Note: *Completed historical years calculated with respect to average share price within the year shown and normalised HEPS; zero normalisation assumed before 2016. **HEPS shown in pence prior to 2018 and US cents thereafter. |
If PAF’s average year one price to normalised EPS ratio of 8.4x for the period FY10–23 is applied to our normalised earnings forecasts, it implies a share price for PAF of 37.41p in FY24 (cf 38.30p previously), followed by one of 52.43p in FY25 (cf 41.94p previously). Stated alternatively, PAF’s current share price of 28.15p, at prevailing forex rates, appears to be discounting FY24 and/or FY25 normalised HEPS of 4.31c per share (cf 3.54c reported in FY23 and 5.72c and 8.02c forecast in FY24 and FY25, respectively).
Relative peer group valuation
It may be seen that PAF remains cheaper than its London- and South Africanlisted gold mining peers on at least 72% of comparable common valuation measures (26 out of 36 individual measures in the table below) on the basis of Edison’s forecasts or 69% (25 out of 26 individual measures) on the basis of consensus forecasts:
Exhibit 7: Comparative valuation of Pan African with South African and London peers
Company |
EV/EBITDA (x) |
P/E (x) |
Yield (%) |
|||
Year 1 |
Year 2 |
Year 1 |
Year 2 |
Year 1 |
Year 2 |
|
AngloGold Ashanti |
5.3 |
4.7 |
10.9 |
9.3 |
1.6 |
1.8 |
Gold Fields |
5.4 |
4.1 |
12.5 |
8.0 |
3.3 |
4.8 |
Sibanye Stillwater |
3.5 |
2.8 |
16.8 |
5.8 |
0.0 |
0.0 |
Harmony |
5.2 |
4.0 |
9.4 |
7.0 |
1.6 |
2.6 |
Centamin |
2.8 |
2.3 |
8.7 |
7.5 |
3.3 |
7.1 |
Endeavour Mining |
4.5 |
3.8 |
11.0 |
8.3 |
3.9 |
4.6 |
Average (excluding PAF) |
4.4 |
3.6 |
11.6 |
7.6 |
2.3 |
3.5 |
PAF (Edison) |
4.2 |
2.9 |
6.3 |
4.5 |
2.7 |
2.7 |
PAF (consensus) |
4.8 |
3.4 |
8.4 |
5.7 |
2.7 |
4.2 |
Source: Edison Investment Research, LSEG Data & Analytics. Note: Consensus and peers priced on 29 July 2024.
Stated alternatively, applying PAF’s peers’ average year one P/E ratio of 11.6x to our forecast normalised HEPS forecast of 5.72c per share for FY24 implies a share price for the company of 52.31p at prevailing forex rates. Applying its peers’ average year two P/E ratio of 7.6x to our forecast normalised HEPS forecast of 8.02c per share (cf 6.28c previously) implies a share price of 48.49p.
Exhibit 8: Financial summary
US$'000s |
2022 |
2023 |
2024e |
2025e |
|||||
Year end 30 June |
IFRS |
IFRS |
IFRS |
IFRS |
|||||
PROFIT & LOSS |
|||||||||
Revenue |
|
|
376,371 |
321,606 |
390,710 |
473,855 |
|||
Cost of sales |
(226,445) |
(198,790) |
(209,081) |
(210,791) |
|||||
Gross profit |
149,926 |
122,816 |
181,630 |
263,064 |
|||||
EBITDA |
|
|
147,830 |
121,853 |
177,922 |
256,969 |
|||
Operating profit (before amort. and excepts.) |
|
|
121,402 |
101,454 |
156,010 |
221,002 |
|||
Intangible amortisation |
0 |
0 |
0 |
0 |
|||||
Exceptionals |
(10,295) |
(7,347) |
(29,705) |
(22,612) |
|||||
Other |
0 |
0 |
0 |
0 |
|||||
Operating profit |
111,107 |
94,107 |
126,305 |
198,390 |
|||||
Net interest |
(4,231) |
(8,553) |
(14,035) |
(9,576) |
|||||
Profit Before Tax (norm) |
|
|
117,171 |
92,901 |
141,975 |
211,426 |
|||
Profit before tax (FRS 3) |
|
|
106,876 |
85,554 |
112,271 |
188,814 |
|||
Tax |
(31,924) |
(24,817) |
(32,520) |
(57,726) |
|||||
Profit after tax (norm) |
85,247 |
68,084 |
109,455 |
153,700 |
|||||
Profit after tax (FRS 3) |
74,952 |
60,737 |
79,750 |
131,088 |
|||||
Average Number of Shares Outstanding (m)* |
1,926.1 |
1,916.5 |
1,916.5 |
1,916.5 |
|||||
EPS - normalised (c) |
|
|
4.44 |
3.54 |
5.72 |
8.02 |
|||
EPS - FRS 3 (c) |
|
|
3.90 |
3.19 |
4.17 |
6.84 |
|||
Dividend per share (c) |
1.04 |
0.95 |
0.98 |
0.98 |
|||||
Gross margin (%) |
39.8 |
38.2 |
46.5 |
55.5 |
|||||
EBITDA margin (%) |
39.3 |
37.9 |
45.5 |
54.2 |
|||||
Operating margin (before GW and except.) (%) |
32.3 |
31.5 |
39.9 |
46.6 |
|||||
BALANCE SHEET |
|||||||||
Fixed assets |
|
|
401,139 |
439,676 |
585,050 |
620,390 |
|||
Intangible assets |
44,210 |
44,429 |
46,633 |
48,856 |
|||||
Tangible assets |
355,802 |
395,247 |
538,417 |
571,534 |
|||||
Investments |
1,127 |
0 |
0 |
0 |
|||||
Current assets |
|
|
55,953 |
61,263 |
42,598 |
135,822 |
|||
Stocks |
9,977 |
9,567 |
13,024 |
15,806 |
|||||
Debtors |
17,546 |
15,182 |
27,831 |
33,778 |
|||||
Cash |
26,993 |
34,771 |
0 |
84,495 |
|||||
Current liabilities |
|
|
(58,989) |
(77,386) |
(97,583) |
(119,397) |
|||
Creditors |
(57,117) |
(65,884) |
(80,827) |
(112,346) |
|||||
Short-term borrowings |
(1,872) |
(11,502) |
(16,756) |
(7,052) |
|||||
Long-term liabilities |
|
|
(103,494) |
(128,957) |
(174,468) |
(168,878) |
|||
Long-term borrowings |
(37,088) |
(45,334) |
(89,644) |
(82,390) |
|||||
Other long-term liabilities |
(66,406) |
(83,623) |
(84,824) |
(86,488) |
|||||
Net assets |
|
|
294,609 |
294,596 |
355,598 |
467,937 |
|||
CASH FLOW |
|||||||||
Operating Cash Flow |
|
|
142,879 |
132,941 |
111,738 |
218,721 |
|||
Net Interest |
(2,794) |
(5,121) |
(14,035) |
(9,576) |
|||||
Tax |
(8,520) |
(7,722) |
(4,242) |
(24,890) |
|||||
Capex |
(81,951) |
(109,952) |
(167,286) |
(71,307) |
|||||
Acquisitions/disposals |
563 |
(2,779) |
0 |
0 |
|||||
Financing |
(3,222) |
0 |
(0) |
0 |
|||||
Dividends |
(21,559) |
(19,975) |
(21,200) |
(18,749) |
|||||
Net cash flow |
25,396 |
(12,608) |
(95,025) |
94,199 |
|||||
Opening net debt/(cash) |
|
|
23,553 |
11,967 |
22,065 |
106,400 |
|||
Exchange rate movements |
(4,401) |
(4,481) |
0 |
0 |
|||||
Other |
(9,409) |
6,991 |
10,690 |
7,254 |
|||||
Closing net debt/(cash) |
|
|
11,967 |
22,065 |
106,400 |
4,947 |
|||
Source: Edison Investment Research, company accounts. Note: *2,222.9m shares in issue, of which 306.4m held in treasury, such that a net 1,916.5m are in issue post-consolidation.
|
|
Research: TMT
CLIQ Digital has lowered its financial outlook for FY24 due to the transition to new sales channels in H124. This was coupled with elevated churn following a change in refund programmes from credit card providers, flagged in Q124, which allows subscribers to cancel more easily. The transition to the ‘Magnificent Seven’ sales channels, which aims to diversify CLIQ’s marketing channels from traditional display advertising to search engine advertising, affiliation and business-to-business (B2B) partnerships, has meant new customer acquisitions have been slower than previously anticipated. We have cut our FY24 forecasts, which are now towards the lower end of management’s guidance. Our reduced FY25 revenue estimate is below company guidance; we will review our forecasts with subsequent trading updates.