Last close As at 05/08/2026
—
— 0.00 (0.00%)
Market capitalisation
—
CREALOGIX’s strong momentum in FY17 reflects buoyant digital transformation trends across the European banking sector, notably in Germany, and the benefits of the group’s recent heavy investment to extend the product offerings into wider international markets. Results outstripped expectations, leading us to upgrade our revenue forecasts by 6-7%, while EBITDA rises by 23% in FY18 and 11% in FY19. Given the attractive industry dynamics, and with CREALOGIX ideally positioned to capitalise, the shares look attractive on c 17x our FY20 EPS.
Written by
CREALOGIX Group |
Heavy investment is beginning to pay off |
Annual report |
Software & comp services |
1 November 2017 |
Share price performance
Business description
Next events
Analysts
CREALOGIX Group is a research client of Edison Investment Research Limited |
|||||||||||||||||||||||||||||||||||||||||||||||||||
CREALOGIX’s strong momentum in FY17 reflects buoyant digital transformation trends across the European banking sector, notably in Germany, and the benefits of the group’s recent heavy investment to extend the product offerings into wider international markets. Results outstripped expectations, leading us to upgrade our revenue forecasts by 6-7%, while EBITDA rises by 23% in FY18 and 11% in FY19. Given the attractive industry dynamics, and with CREALOGIX ideally positioned to capitalise, the shares look attractive on c 17x our FY20 EPS.
Year |
Revenue (CHFm) |
PBT* |
EPS* |
DPS |
P/E |
Yield |
06/16 |
63.3 |
2.2 |
1.65 |
0.00 |
82.6 |
N/A |
06/17 |
74.9 |
5.0 |
2.67 |
0.50 |
51.0 |
0.4 |
06/18e |
82.3 |
8.1 |
5.24 |
1.00 |
26.0 |
0.7 |
06/19e |
89.7 |
10.5 |
6.89 |
1.50 |
19.7 |
1.1 |
Note: *PBT and EPS are normalised, excluding amortisation of acquired intangibles, exceptional items and share-based payments.
Digital banking is in a very strong growth phase
Global digital banking is in a major growth phase, boosted by increasing use of smart phones and tablets and pressure on banks to streamline their bank branches to reduce costs. These factors, along with regulatory requirements such as PSD2, are driving increasing spend on front-end systems by CREALOGIX customers. Global front-end system spend is forecast to rise to c 50% of banks’ total IT spend by 2020, according to Gartner, from c 10% in 2010.
FY17 results: Strong results, targets raised
FY17 results easily outstripped market expectations. Group revenues rose 18% to CHF74.9m, while EBITDA almost doubled to CHF7.3m, at a margin of 9.8% (FY16: 5.8%). With free cash flow of CHF7.0m, net cash rose to CHF9.8m. The convertible bonds are now well in the money, and have started to convert; if all were to convert the group would have net cash of nearly CHF34m. CREALOGIX has resumed dividend payments after a three-year break and raised its medium-term targets.
Forecasts: Significant upgrades
We have increased our FY18 revenue forecasts by 7% to CHF82.3m, while FY19 rises by 6% to CHF89.7m. EBITDA increases by 23% to CHF9.9m in FY18, and by 11% to CHF12.2m in FY19. We forecast net cash to rise to CHF18.4m by the end of FY18, increasing to CHF23.5m as at end-FY19 after the remaining payment for Elaxy FS&S and swelling to CHF53.9m at end FY20 after the assumed conversion of the remaining convertible bonds.
Valuation: Upside with growth and margin expansion
Following several years of heavy investment, CREALOGIX has established a highly attractive software proposition for banking sector digital transformation and the key components are in place to underpin strong revenue growth. Our DCF model suggests a valuation of CHF199-271 (WACC ranging from 8-10%, 10% CAGR over 10 years and 15% operating margins), which indicates significant upside potential.
Investment summary: Digital transformation tech
Company description: Global digital fintech enabler
CREALOGIX is a global market leader in digital banking solutions, ranked in IDC’s global fintech top 100 list. Based in Zurich, it was founded in 1996 by Bruno Richle, Richard Dratva, Daniel Hiltebrand and Peter Süsstrunk, who all continue to work with the company and together own 68% of the share capital. With c 417 employees, CREALOGIX provides front-end banking software solutions that operate through multiple channels (essentially mobile phones, tablets and PCs). It has a leading position in the Swiss market, where 11 of the 30 largest Swiss banks are exclusively using its core online/mobile applications. Its strategic aim is to internationalise. It has offices in Germany, Austria, the UK and Singapore, with plans to extend operations further in Asia and North America. Half of FY17 sales were international and its medium-term target is to raise this to 70%.
Financials: Heavy investment is starting to pay off
The group has an excellent profitability track record. After slipping into loss in FY15 due to planned accelerated investment, the heavy investment phase is now paying off, with FY17 revenues up 18%, EBITDA nearly doubling to CHF7.3m, and free cash flow of CHF7.0m. We forecast revenues to rise 10% in FY18, with EBITDA jumping 23% as the margin continues to expand. End June net cash was CHF9.8m; assuming the outstanding convertible bonds convert, this cash pile would swell to c CHF34m, providing the group with ample financial flexibility to make tuck-in acquisitions.
|
Exhibit 1: Revenue and operating margin trends |
|
|
Source: CREALOGIX (historics), Edison Investment Research (forecasts) |
Sensitivities: Fintech competition and budget deferrals
Economic and regulatory uncertainties, including Brexit, could defer investment decisions by CREALOGIX’S customers and slow the pace of change in CREALOGIX's traditional banking sector customer base. There is a competitive risk that nimble fintechs and challenger banks could make a bigger inroad into the traditional banking sector, where consolidation could also reduce the potential customer base. Major back-end software vendors and ERP software providers could become more active in the front-end, while specialist direct competitors could develop better solutions or more attractive business models. There is execution and integration risk in the acquisition strategy and increasing currency risk as the company expands abroad.
Valuation: Heavily invested high-growth fintech
The stock trades on 26.0x our earnings in FY18e, which falls to 19.7x in FY19e and to c 17.4x in FY20e. On our base revenue growth assumptions, our DCF model suggests a valuation range of CHF199 to CHF271 per share. Our valuation data have been adjusted for the dilution impact from the convertible bonds, which we estimate reduces the valuations by c 10%.
Company description: Digital banking enabler
CREALOGIX develops and implements software solutions that enable digital banking for “the digital bank of tomorrow”. This market is dynamic and fast changing and the group’s solutions are typically used by traditional banks to enable their journey to digitalisation, through the provision of a sophisticated, modern, omni-channel offering to their clients. The group’s products are front-end solutions that integrate with the customers’ back end systems, such as a core banking system from Temenos, Avaloq or Infosys. CREALOGIX’s primary target customers are traditional retail, commercial and wealth banks that need to upgrade their legacy in-house systems to maintain competitiveness, reduce cost, differentiate and provide greater flexibility in a constantly evolving (swiftly digitalising) marketplace. CREALOGIX has a “customer centric focus” to optimise the user experience across the areas of mobility, security, personalised advice and education. CREALOGIX sees itself as a pioneer in digital banking, having launched the first internet banking solution in Switzerland with Credit Suisse in 1997. It has offices in Germany, Austria, the UK and Singapore, with plans to extend operations further in Asia and North America. Half of FY17 sales were outside Switzerland and its medium-term target is to raise international revenues to 70%.
The group has c 417 employees, including c 100 in research and development, c 215 in project and implementation and c 25 in sales (including pre-sales engineers). Development work is carried out in countries where the group is active, with around a third of the work handled from a nearshore development centre in Belgrade (with more than 100 employees).
The group’s technology has been winning awards, including Best Online Development at the Systems in the City Awards 2017, Best of Show Award at FinovateEurope 2017 with its virtual banking app ‘The ARCs’ and Best Online Development for the Secure Client Portal with outstanding user experience within the mobile app at Goodacre’s Systems in The City 2017. In September, it won “Best Digital Financial Advisory Firm” West Europe at the Wealth&Finance 2017 FinTech Awards. We also note that CREALOGIX was listed in IDC Financial Insights’ Fintech100 Rankings at number 84, up from 94 in 2016.
Management changes
In January 2016 Bruno Richle stepped down as CEO, with Thomas Avedik taking on the CEO role. Mr Avedik has been with CREALOGIX for 10 years, having previously heading up the group’s e-banking operations. Mr Richle retains the position of chairman. Philippe Wirth joined the group in May 2017 as CFO, replacing Rolf Lichtin who took on a new role outside the group.
Strategy: Dynamic customer focus; internationalisation
CREALOGIX has established a strong track record of delivering software solutions to the banking industry in Switzerland through its established operations and it is transitioning and expanding the business to the international markets. The group went through a heavy investment phase, which peaked in FY15. It has been investing in the development of its software platform to address the challenges to the banking sector, spending 21.5% of sales on R&D in FY15, which resulted in an EBITDA loss of CHF10.6m. R&D declined to 13% of sales in FY16 and rose to 17% of sales in FY17 as a result of a reduction in freelancers and the shift to near/offshore centres. The organic investment was supplemented by the strategic acquisition of Elaxy in FY16, which significantly boosted the group’s position in the important German market and added additional functionality, notably on the wealth management side with the “Digital Financial Advisory” solution. The aim now is to seek the benefits from scaling the platform across a much larger international customer base, and to be at the forefront in matching its software solutions to banking customers facing the challenges of meeting the needs of the dynamic and fast changing digitalisation markets.
Internationalisation: Medium-term target is for international to be >70% of revenues
Half of CREALOGIX sales in FY17 (45% in FY16) were outside Switzerland (see Exhibit 2) and the group has a medium-term target to expand this to 70%. Currently, its clients are served mainly from offices in its core hub, Switzerland, as well as from Germany, Austria and the UK. The next strategic aim is to expand service provision in Asia and in North America.
|
Exhibit 2: CREALOGIX is focused on growing its international revenues |
|
|
Source: CREALOGIX 2017 |
Acquisitions add breadth
Selective acquisitions play a role in the group’s strategy, and CREALOGIX has made several acquisitions to gain access to new geographic markets and technologies. We expect further bolt on acquisitions in the future. In January 2015, CREALOGIX acquired MBA Systems, providing strong experience in wealth management and adding c 30 clients using hosting in the UK, subsequently extended to CREALOGIX’s entire platform.
In October 2015, CREALOGIX announced a long-term commercial agreement with Fiducia & GAD IT, the IT-service provider owned by the German Volksbank and Raiffeisenbank co-operatives. The deal also involved CREALOGIX acquiring 80% of Elaxy Financial Software & Solutions (Elaxy FS&S) and 20% of Elaxy Business Solution & Services (Elaxy BS&S) from Fiducia & GAD, effective 1 January 2016. CREALOGIX has a call option to acquire the 80% outstanding shares in Elaxy BS&S, which is exercisable in the first half of CY18. There is a put option over the 20% outstanding shares in Elaxy FS&S exercisable in the first half of CY20 and a call option over the shares exercisable in the first half of CY21.
In September 2017, CREALOGIX announced that it had acquired the artificial intelligence technology of Koemei for an undisclosed sum. Koemei's solution utilises machine learning technology to enable the automated conversion of audio and video content into text data. This makes it easier to exploit multimedia content as users are able to find and jump straight to the relevant statements in any video. CREALOGIX intends to integrate the technology with its digital banking and digital learning products for analytics and optimisation. This deal was a very small bolt-on acquisition for CREALOGIX.
Market position: Leader in digital banking
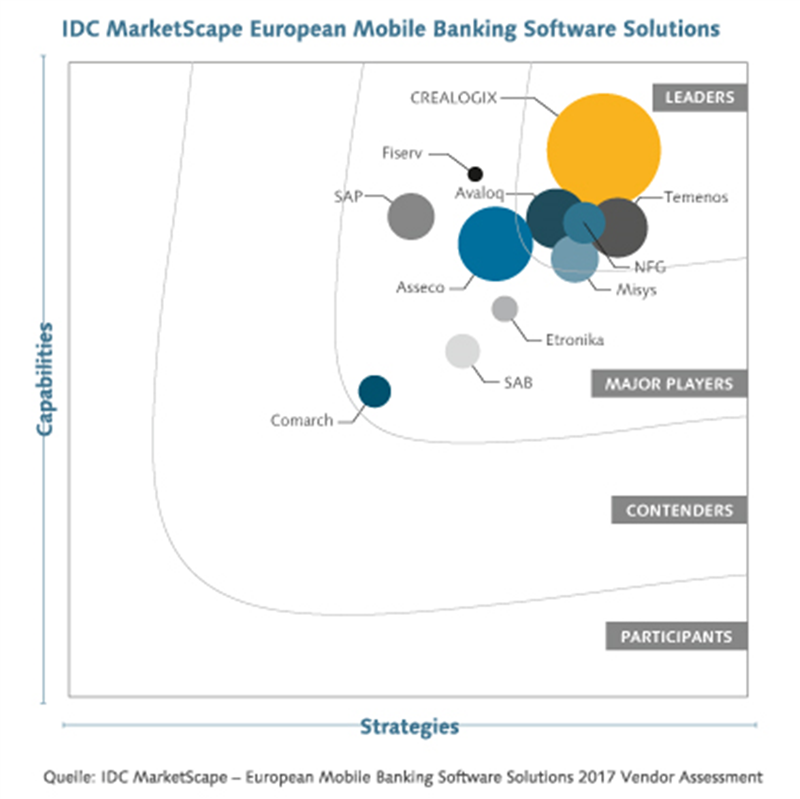
CREALOGIX is in the top 100 global fintech list and is a leader in the digital banking space. IDC, the market research company, named CREALOGIX as the leading provider in its 2017 comparison of vendors of mobile banking software solutions (see Exhibit 3 below). CREALOGIX’s position on the top right reflects its particular strength in the increasingly important mobile space.
We discuss the dynamics of the industry background in the following sections, which focus on the strong growth underway in digital banking as CREALOGIX’s customer base, banks and financial institutions, strive to meet, on one side, their own customer-driven demand for digital delivery of services and, on the other, regulatory-triggered changes coming with MiFID II and the January 2018 implementation of PSD2. Amid this, the traditional banking sector is consolidating.
|
Exhibit 3: CREALOGIX is a leader in the space |
|
|
Source: Source: IDC |
Competitive environment – spread across five categories
We divide the market for front-end solutions provided to the financial services industry into five separate categories:
■
IT departments of banks, which suffer cost and flexibility disadvantages against software vendors;
■
specialist software providers, eg, Intelligent Environments (UK private company), Backbase (Dutch private company), Misys (UK-based, owned by private equity), Sopra Banking Software (part of Sopra Steria [EPA:SOP]);
■
core banking software providers, eg, Temenos (SWX:TEMN), FIS (NYSE:FIS), Infosys (Bombay listed, NSE:INFY) and Avaloq (Swiss private), which are focused on back-end systems and typically have little presence or less sophisticated solutions for the front-end;
■
ERP giants SAP (ETR:SAP) or Oracle (NYSE:ORCL) are able to offer solutions; and
■
systems integrators such as IBM (NYSE:IBM) that work on a time and materials basis and typically will partner with specialist software vendors.
In our view, CREALOGIX has a number of advantages over other specialist software providers, including the greater depth of its platform (eg some lack the banking functionality or the quality of the user experience), the proven experience gained in the Swiss market with top-class references and the transparency associated with being a public company, along with the strong balance sheet. In the client-centric game of front-end systems, it is all about building the best user interface, which gives specialist players an opportunity, and CREALOGIX has been able to develop comprehensive functionality.
The group’s wealth management offering competes with small local players and IRESS (ASX:IRE).
Industry background
Digital banking is in a major growth phase globally
Digital banking remains in a major growth phase globally, boosted by the advent of smartphones and tablets; smartphones are expected to take 80% of the online banking market by 2020 (AT Kearney). Further, digital banking has overtaken compliance as the area of highest importance within banking sector IT budgets. Regulatory changes, such as PSD2 (Payment Services Directive), put additional pressure on banks to upgrade their front-end systems.
In a white paper published by CREALOGIX, it cites a Visa Digital Payment study that shows the number of Europeans who regularly use a mobile device (eg a smartphone, tablet or wearable device) to make payments has tripled within a single year to 54% of respondents compared with 18% in 2016.
The changing backdrop is driving increasing spend by banks and financial providers on front-end systems and Gartner forecasts the front-end system spend to rise to c 50% of banks’ total IT spend by 2020, from c 10% in 2010. The front-end solutions in this space need to be more agile than the back-end core banking systems and must offer a seamless experience. Innovation is clearly much more prevalent in the front end than at the back end.
The global banking sector is in a state of flux
The global banking sector is facing unprecedented challenges. Increased regulation in the wake of the global financial crisis means banks must hold significantly higher levels of capital against their assets, which puts huge pressure on profitability. The implementation of MiFID II and PSD2 in January 2018 adds further complexity. Under EU regulation PSD2, EU banks are required to provide legitimate third parties with access to their customers’ account data, enabling them to aggregate data and initiate payments. This means that credit institutions in the form of banks will have to have the requisite IT interfaces in the form of APIs (as provided by CREALOGIX software solutions). At the same time their customer bases are being targeted by challenger banks entering the space as well as a plethora of new fintechs offering alternative products (such as peer to peer lending, crowd funding, bitcoin and various investing solutions). To maintain competitiveness, traditional banks must be able to offer modern solutions. While the large global banks have the financial resources to develop their own solutions in-house, the rest have no choice but to purchase technology if they wish to stay in the game. We also note that the number of banks has been in long-run structural decline across the globe, eg, in Switzerland the number of banks has fallen by 16% from 2004 to 2013, to 283. Traditional banks also have costly branch networks that can be streamlined with the help of digital banking. A recent report from Autonomous pointed out that Germany has over 32,000 bank branches compared with 7,370 supermarkets, and this number is expected to fall dramatically in coming years.
CREALOGIX’s response – The Digital Banking Hub
Following a period of significant investment, the group launched its Digital Banking Hub in 2015. It gives small and mid-sized banks the opportunity to offer highly competitive digital banking offerings. The hub is a modular system that has been tailored for customers, having been developed in conjunction with them. It is a comprehensive platform for online banking across all channels (essentially PC, tablet and mobile phones). It covers eight fields of expertise, as shown in Exhibit 4. Each field covers a range of products, which are broken down into separate modules. It has a modern interface and APIs and includes pre-built out-of-the box modules. The APIs enable it to integrate fintechs, third-party modules and in-house built widgets.
|
Exhibit 4: The new software platform – functionalities for the Digital Banking Hub |
|
|
Source: CREALOGIX |
The hub enables financial institutions to integrate specific product offerings from fintechs into their complex IT landscape and connect them with existing solutions. Consequently financial institutions can achieve significant improvements in the banking experience for their customers. An example for this is “The Arcs” application from the CREALOGIX innovation workshop “WowLab". The modern virtual reality application combines emotion, creativity and logic in a playful manner and allows customers to experience their daily banking visually in a new way – in 3D.
The platform’s primary areas are Transaction & API Banking, Mobile Banking, Digital Payment and Digital Learning. Customers will take both the flagship online Transaction & API Banking and Mobile Banking solutions to create a multichannel offering. Additionally, CREALOGIX offers a range of online and mobile security products. The Digital Banking Hub is open and can be integrated into all systems; a user friendly navigation concept can link in various CREALOGIX modules and third-party applications. The product is white labelled, with each client bank adapting the style to suit its existing design. It is cost effective, because the system is based on a lean and open architecture and is perfectly compatible with all standard devices. The group uses java and HTML5 programme languages, with java in the back end and HTML5 up front. The product uses modern concepts including responsive design (resizes with different devices) and zero footprint (no software installation required on the device). The product offering has a six-month upgrade cycle.
Digital Banking is the group’s broadest offering and, along with related modules, generated c 80% of FY17 revenues, up from c 60% in FY15, while Digital Payment generated c 10% of revenues and Digital Learning c 10%. The Digital Learning module is an LMS (learning management system) used by the group’s banking customers to train their clients and employees (typically young professionals) in financial literacy. It replaces paper-based systems, so helps reduce risk.
The implementation of the group’s solutions helps IT departments shift their focus from development to supporting the business and this is an attractive proposition from the business end of the bank. This is because banks need greater flexibility to cope with regulatory changes and to position themselves strategically to deal with fintechs. They also need the latest technology to help them in the fight to win new customers.
Exhibit 5 shows the advent of new fintechs has disintermediated banking and CREALOGIX’s platform enables banks to bring these functions back into their own ecosystem.
|
Exhibit 5: CREALOGIX’s platform enables banks to bring disintermediated functions back into their own ecosystem |
|
|
Source: CREALOGIX |
Financials
Business model: Perpetual licence, term licence & hosted SaaS
The company offers a range of revenue models to its customers. The group’s traditional Swiss client base are all on the perpetual licence model plus implementation along with annual support and maintenance fees (in the range of 18% to 21% depending on the overall solution). We note that many banks in continental Europe prefer an onsite solution, due to attitudes towards security risks. The group’s UK clients (c 30 customers acquired via MBA) operate on hosted SaaS basis, committed for five years. We note that MBA has been incorporated into the Digital Banking Hub, and the entire platform is now available on a hosted basis. CREALOGIX also offers a SaaS licence for five to seven years while one company is onsite rental. CREALOGIX regularly receives change requests from clients (eg adding functionality, acquire an entire hub or a more general adaptation), which generates additional licence and services revenues.
Additionally, CREALOGIX is using the systems-integration reseller route to market which enables it to cover the entire value chain through consultancy and conception to suitable solutions as well as integration and operation. CREALOGIX’s systems-integrator partners include Hewlett-Packard Enterprise (NYSE:HPE), CGI (TSE:GIB.A), Cognizant (NASDAQ:CTSH) and Adesso (ETR:ADN1) and the SIs take the services work.
The company sells to both the business side and the IT department. However, the position of chief digital officer is becoming much more common in banks and is typically the most effective person to sell to. The sales cycle is typically in the range of six to 18 months and averages 12 months. There will typically be a proof of concept, but the scale of this will depend on the requirements of the customer. For example, the customer might simply be concerned with the look or feel for the end customer. Alternatively, they may wish to integrate third-party software or in-house widgets, or customise it so it looks and functions like the customer’s other corporate websites. Ultimately, the customer needs to make the decision of whether to invest in-house or in new front-end software.
Recurring revenues consist of support and maintenance (CHF23.8m or 63% of licence revenues in FY17), along with hosting SaaS services (CHF4.7m in FY17). In total, this came to 38% of FY17 revenues, but we expect this to continue to rise on that back of hosted/SaaS growth.
Goods represents hardware used for secure online invoice payments. This consists of a payment scanning device and a payment slip reader. We assume this area declines as the company focuses on software.
Balance sheet and capital structure; cash flow generative
The group’s balance sheet has strengthened considerably over the year on the back of the strong profitability. Net assets grew by CHF4.4m to CHF29.5m, while the group swung to an adjusted net cash position. The final payment for MBA Systems has been made and the outstanding acquisition liabilities relate to ELAXY FS&S. The company also has a call option over the balance of ELAXY BS&S. We expect cash flow to continue to remain strong on the back of revenue growth and see R&D/sales abating. The strength in the share price means that it is increasingly probable that the group’s convertible bonds will convert and this would further strengthen the balance sheet.
The company issued CHF25m nominal of 2.375% four-year convertible bonds in November 2015. These bonds have a conversion price of CHF104.5 and given the recent strength in the CREALOGIX share price, investors have begun to convert bonds to equity. CHF1.27m nominal of bonds were converted during FY17 and a further CHF1.89m have converted after the period end. This leaves CHF21.8m nominal outstanding. Assuming all the outstanding bonds convert, it would require the issuing of c 209k new shares, representing 16% of the expanded share capital. Based on pro forma numbers, that would push the group to c CHF34m net cash while boosting net assets to c CHF54m.
Exhibit 6: Capital structure
CHF000s |
30/06/15 |
30/12/15 |
30/06/16 |
31/12/16 |
30/06/17 |
30/06/17 |
Bonds convert |
||||||
Cash & ST securities |
(10,815) |
(36,658) |
(27,495) |
(29,433) |
(33,775) |
(33,775) |
Short-term borrowings |
0 |
0 |
0 |
0 |
0 |
0 |
Long-term borrowings |
0 |
0 |
0 |
0 |
0 |
0 |
Convertible bonds |
0 |
23,995 |
24,141 |
24,260 |
24,005 |
0 |
Net cash |
(10,815) |
(12,663) |
(3,354) |
(5,173) |
(9,770) |
(33,775) |
Short-term securities |
(2,322) |
0 |
0 |
0 |
0 |
0 |
MBA deferred payment |
2,630 |
2,654 |
2,370 |
0 |
0 |
0 |
Assumed ELAXY FS&S deferred payment |
0 |
0 |
2,387 |
2,387 |
2,387 |
2,387 |
Adjusted net debt (cash) |
(10,507) |
(10,009) |
1,403 |
(2,786) |
(7,383) |
(31,388) |
Net assets |
26,682 |
25,335 |
25,102 |
27,124 |
29,515 |
53,520 |
Debt/equity |
(39.4%) |
(39.5%) |
5.6% |
(10.3%) |
(25.0%) |
(58.6%) |
Source: CREALOGIX accounts, Edison Investment Research assumptions
There are call and put options over the remaining 20% of Elaxy FS&S, which we assume will be exercised for CHF2.4m. CREALOGIX has a call option on the remaining 80% of Elaxy BS&S, effective on 1 July 2018, which we have not included in Exhibit 6. Given the favourable trading at Elaxy BS&S, we believe it is likely that CREALOGIX will purchase the remaining 80% stake.
As at 30 June, the company had 1,100,266 shares in issue. This includes 5,402 treasury shares and 1,094,864 shares with voting rights.
Results and forecasts
FY17 results: 18% sales growth with strong cash generation
FY17 results reported in September easily beat market expectations and were accompanied by management raising its medium-term targets (Exhibit 9) and reinstating dividend payments. For FY18 it guides to revenue of at least CHF82.3m and EBITDA of at least CHF8.2m, albeit reminding investors of potential economic uncertainties, for example Brexit and geopolitical issues. Key features of the results included strong cash generation and an increase in international sales to 50%, from 45% in FY16.
Group revenues rose by 18% to CHF74.9m (we forecasted CHF71.6m), while EBITDA doubled to CHF7.3m (well above our forecast CHF6.0m), as the margin rose by 400bp to 9.8%. While SaaS revenue suffered from Brexit (the subsequent decline in the pound sterling along with business deferrals), licensing fees were considerably better than expected. Device sales also performed well, but this is not an area of management focus. The company now breaks out maintenance revenue, which grew by 24% to CHF23.8m. This includes a full period from Elaxy’s significant maintenance book, which contributed for just six months in FY16. The group generated free cash flow of CHF7.0m, and net cash rose by CHF6.4m over the year to CHF9.8m. CREALOGIX has resumed dividend payments after a three-year break, with a CHF0.50 final dividend. Although well covered, the company does not have a definitive dividend policy, and future dividend levels are likely to be influenced by any acquisitions.
|
Exhibit 7: Revenue by category |
Exhibit 8: FY17 revenue by category |
|
|
|
Source: CREALOGIX |
Source: CREALOGIX |
|
Exhibit 7: Revenue by category |
|
|
Source: CREALOGIX |
|
Exhibit 8: FY17 revenue by category |
|
|
Source: CREALOGIX |
Outlook: Medium-term EBITDA margin guidance moves up
Management remains buoyant on the outlook in spite of continuing uncertainties (including Brexit and geopolitical issues) that could delay customer decision making. It expects double-digit revenue growth in FY18 with an EBITDA margin of at least 10%. It has raised the medium-term EBITDA margin target from 10% to 15% and now expects international revenues to exceed 70% of group revenue in the medium term. Most of the near-term growth is expected to come from Germany and there is also some stabilisation in the UK after the June 2016 EU referendum, which led to a decline in sterling against the Swiss franc, eliciting some customer deferrals.
Exhibit 9: Management guidance
Targets for FY17/18 |
Mid-term targets |
|
Revenue growth |
>10% |
>20% |
Product revenue share |
>60% |
>70% |
International revenue share |
>50% |
>70% |
Profitability (EBITDA margin) |
>10% |
>15% |
Source: CREALOGIX
Forecast changes: Significant upgrades
We have increased our FY18 revenue forecasts by 7% to CHF82.3m, while FY19 rises by 6% to CHF89.7m. EBITDA increases by 23% to CHF9.9m in FY18, and by 11% to CHF12.2m in FY19. We forecast net cash to rise to CHF18.4m by the end of FY18, from CHF9.8m at the end of FY17, increasing to CHF23.7m as at end-FY19 after the remaining payment for Elaxy FS&S and swelling to CHF54.4m as at end FY20 after the assumed conversion of the remaining convertible bonds.
We continue to expect the growth to be led by licensing and hosting/SaaS revenue segments, with services broadly flat and hardware sales declining. For FY18, we forecast licensing fees to jump 26% to CHF17.9m, hosting/SaaS to rise by 43% to CHF7.6m, while services ease to CHF28.2m and goods fall 10% to CHF3.5m. We forecast product revenues (licence, maintenance and hosting/SaaS) to rise to 62% of group revenue in FY18 (57% in FY17), and to 66% in FY19.
We forecast operating costs (including depreciation) to rise 9% to CHF57.3m in FY18 and by 9% to CHF62.6m in FY18. We note that CREALOGIX expenses all its R&D costs. We are forecasting operating margins to rise to 10.4% in FY18, to 12.2% in FY19 and to 13.2% in FY20 as the group scales up its international revenues.
Associates represent ELAXY BS&S, which generated c CHF407k in FY17, and Qontis, which is very difficult to forecast. We are conservatively maintaining our FY18 and FY19 forecasts at CHF250k and CHF263k, respectively. Net interest expense includes the coupon on the CHF21.8m convertible bonds outstanding, which amounts to c CHF518k per year.
The minority interest represents the 20% outstanding in ELAXY FS&S, which we expect will be acquired by CREALOGIX during FY19.
We have increased our tax rate assumptions because Germany is outperforming other regions. We note the group has c CHF3m in tax losses, most of which are in Germany.
We forecast operating cash flow before interest and tax of CHF10.3m, out of which we expect interest, tax, capex, and dividends to absorb CHF0.8m, CHF1.2m, CHF1.1m and CHF0.5m, respectively. Thereafter, absent any significant acquisitions, we expect CREALOGIX to show strongly increasing cash generation, including our forecast CHF14.5m from operations in FY20. We expect capex to run at around 1.4% of sales from FY20 and apply working capital reductions of 0.5% per year, representing the cash generating upfront licence and hosted SaaS revenues.
Exhibit 10: Forecast changes
Year end 30 June |
Previous |
Actual |
Change |
Previous |
New |
Change |
Previous |
New |
Change |
New |
Revenues (CHF'000s) |
2017e |
2017 |
(%) |
2018e |
2018e |
(%) |
2019e |
2019e |
(%) |
2020e |
Licensing |
13,226 |
14,188 |
7 |
16,631 |
17,920 |
8 |
20,062 |
21,382 |
7 |
23,146 |
Maintenance |
22,204 |
23,820 |
7 |
23,387 |
25,200 |
8 |
25,023 |
26,670 |
7 |
28,560 |
Hosting and SaaS services |
4,590 |
4,660 |
2 |
7,560 |
7,560 |
0 |
10,530 |
10,800 |
3 |
14,580 |
Services |
28,582 |
28,340 |
(1) |
26,657 |
28,200 |
6 |
26,248 |
27,737 |
6 |
27,998 |
Goods |
2,998 |
3,850 |
28 |
2,698 |
3,465 |
28 |
2,563 |
3,119 |
22 |
2,807 |
Total Group revenues |
71,600 |
74,858 |
5 |
76,932 |
82,345 |
7 |
84,426 |
89,707 |
6 |
97,090 |
Growth (%) |
13.1 |
18.2 |
|
7.4 |
10.0 |
|
9.7 |
8.9 |
|
8.2 |
Gross profit |
58,139 |
59,695 |
3 |
65,339 |
67,198 |
3 |
73,962 |
74,814 |
1 |
82,428 |
Gross margin(%) |
81.2 |
79.7 |
|
84.9 |
81.6 |
|
87.6 |
83.4 |
|
84.9 |
Opex before depn & amortis’n |
(52,139) |
(52,391) |
0 |
(57,311) |
(57,319) |
0 |
(63,041) |
(62,645) |
(1) |
(68,445) |
EBITDA |
6,000 |
7,304 |
22 |
8,028 |
9,879 |
23 |
10,922 |
12,170 |
11 |
13,983 |
EBITDA margin (%) |
8.4 |
9.8 |
|
10.4 |
12.0 |
|
12.9 |
13.6 |
|
14.4 |
Normal depreciation |
(1,250) |
(1,388) |
11 |
(1,150) |
(1,300) |
13 |
(1,050) |
(1,250) |
19 |
(1,200) |
Adjusted operating profit |
4,750 |
5,916 |
25 |
6,878 |
8,579 |
25 |
9,872 |
10,920 |
11 |
12,783 |
Operating margin (%) |
6.6 |
7.9 |
|
8.9 |
10.4 |
|
11.7 |
12.2 |
|
13.2 |
Growth (%) |
109.8 |
161.3 |
|
44.8 |
45.0 |
|
43.5 |
27.3 |
|
17.1 |
Associates |
0 |
(21) |
0 |
250 |
250 |
0 |
263 |
263 |
0 |
276 |
Net interest |
(850) |
(936) |
10 |
(725) |
(750) |
3 |
(625) |
(650) |
4 |
(100) |
Profit before tax norm |
3,900 |
4,959 |
27 |
6,403 |
8,079 |
26 |
9,509 |
10,532 |
11 |
12,959 |
Amortisation of acq’d intangibles |
(1,700) |
(1,799) |
6 |
(1,400) |
(1,799) |
29 |
(1,400) |
(1,799) |
29 |
(1,799) |
Profit before tax |
2,200 |
3,160 |
44 |
5,003 |
6,280 |
26 |
8,109 |
8,733 |
8 |
11,160 |
Taxation |
(1,463) |
(1,751) |
20 |
(1,600) |
(2,192) |
37 |
(2,312) |
(2,876) |
24 |
(3,551) |
Minority interest |
(305) |
(360) |
18 |
(164) |
(198) |
21 |
(90) |
(108) |
20 |
(58) |
Net income |
432 |
1,049 |
143 |
3,239 |
3,890 |
20 |
5,707 |
5,750 |
1 |
7,550 |
Statutory EPS (CHF) |
0.41 |
0.98 |
141 |
3.06 |
3.58 |
17 |
5.39 |
5.25 |
(3) |
6.30 |
Adjusted EPS (CHF) |
2.01 |
2.67 |
32 |
4.38 |
5.24 |
20 |
6.71 |
6.89 |
3 |
7.80 |
P/E - Adjusted EPS |
|
51.7 |
|
26.0 |
|
19.7 |
17.4 |
Source: CREALOGIX (historics), Edison Investment Research (forecasts)
Sensitivities: Fintech is a swiftly evolving space
We highlight the following sensitivities:
■
Economic slowdown – economic and regulatory uncertainties, including Brexit, could defer investment decisions by CREALOGIX’S customers and slow the pace of change in CREALOGIX's traditional banking sector customer base.
■
Competitive environment – there is a risk that nimble fintechs and challenger banks could make a bigger inroad into the traditional banking sector over the longer term. Consolidation in the traditional banking sector could reduce the potential customer base. Major back-end software vendors and ERP providers could take a more active approach in the front-end, while specialist direct competitors could develop superior solutions or more attractive business models.
■
Customer/currency concentration – the group has a high exposure to Swiss-based banks and the Swiss currency. However, this is gradually being diversified as the group broadens its customer base internationally. CREALOGIX is not overly exposed to any particular company.
■
Acquisition risk – there is implementation/integration risk in the acquisition strategy and increasing currency risk as the company expands abroad.
■
Low free float – this means there is liquidity risk for investors.
Valuation: Strategy is beginning to deliver
The group's strategy is now beginning to bear fruit as exhibited by the strong FY17 revenue growth and margin expansion, aided by the buoyant digital banking backdrop. We believe there are several reasons why revenues and margins can continue to rise:
■
regulatory requirements such as MiFID II and PSD2 are driving increasing spend on front-end systems and CREALOGIX is ideally positioned to benefit from this;
■
the group has a much stronger focus than was the case historically, on the financial services sector;
■
the group has a broader solution suite (eg, “Digital Financial Advisory” solution) and increased opportunities for cross-selling;
■
the benefits from economies of scale created by acquisitions;
■
the solution suite consists of more off-the-shelf solutions, which are higher margin, and high-margin product is expected to represent a higher percentage of revenues; and
■
it is making greater use of cost-effective near/far shore sites for R&D and delivery.
We highlight the following points on the group’s valuation:
■
Traditional P/E valuation: the stock trades on 26.0x our earnings forecasts in FY18, falling to 19.7x in FY19 and to 17.4x in FY20.
■
Cash flow: We forecast a CHF7.3m free cash outflow in FY18, rising to CHF8.6m in FY19 and to CHF10.2m FY20.
Exhibit 11: Cash flow
CHF000s |
FY13 |
FY14 |
FY15 |
FY16 |
FY17 |
FY18e |
FY19e |
FY20e |
Adjusted operating profit |
3,056 |
501 |
(11,815) |
2,264 |
5,916 |
8,579 |
10,920 |
12,783 |
Depreciation |
1,149 |
1,209 |
1,260 |
1,432 |
1,388 |
1,300 |
1,250 |
1,200 |
Adjusted EBITDA |
4,205 |
1,710 |
(10,555) |
3,696 |
7,304 |
9,879 |
12,170 |
13,983 |
Working capital |
(3,221) |
3,952 |
3,036 |
(3,202) |
2,564 |
412 |
449 |
486 |
Pension |
(103) |
(228) |
1,635 |
1,082 |
0 |
0 |
0 |
0 |
Provisions |
0 |
0 |
1,444 |
(296) |
(133) |
0 |
0 |
0 |
Exceptional items/misc |
6 |
83 |
(63) |
0 |
0 |
0 |
0 |
0 |
Operating cash flow |
887 |
5,517 |
(4,503) |
1,280 |
9,735 |
10,291 |
12,618 |
14,469 |
Net interest |
60 |
34 |
91 |
5 |
(616) |
(750) |
(650) |
(100) |
Tax paid |
(232) |
(293) |
(269) |
(144) |
(1,273) |
(1,178) |
(2,181) |
(2,844) |
Purchase tangible assets |
(1,391) |
(859) |
(1,018) |
(486) |
(862) |
(1,070) |
(1,211) |
(1,359) |
Free cash flow |
(676) |
4,399 |
(5,699) |
655 |
6,984 |
7,292 |
8,576 |
10,166 |
Source: CREALOGIX (historics), Edison Investment Research (forecasts)
■
DCF scenario analysis. In Exhibit 12, we show the sensitivity of valuations to changes in WACCs, margins and growth assumptions. Starting from our base scenario (10% total net sales revenue growth), applying a WACC of 10% and an operating margin of 15%, the table shows that a 5% increase in the margin assumption increases the valuation by 27% from CHF199 to CHF252. A 5% rise in the growth assumption increases the valuation by 57% to CHF312, and a 2% reduction in the WACC boosts the valuation by 36% to CHF271.
Exhibit 12: DCF scenario analysis
WACC 8% |
WACC 10% |
WACC 12% |
||||||||||||||||
Medium-term operating margin targets |
||||||||||||||||||
Revenue scenarios (see notes below) |
|
10.0% |
15.0% |
20.0% |
10.0% |
15.0% |
20.0% |
10.0% |
15.0% |
20.0% |
||||||||
Out-performance |
CHF310 |
CHF444 |
CHF576 |
CHF220 |
CHF312 |
CHF401 |
CHF170 |
CHF236 |
CHF301 |
|||||||||
Base scenario |
CHF193 |
CHF271 |
CHF346 |
CHF144 |
CHF199 |
CHF252 |
CHF116 |
CHF158 |
CHF197 |
|||||||||
Under-performance |
CHF127 |
CHF173 |
CHF217 |
CHF100 |
CHF134 |
CHF166 |
CHF84 |
CHF111 |
CHF136 |
|||||||||
Revenue scenarios as follows: |
|
|
|
|
|
|
|
|
|
|||||||||
Out-performance |
Out-performance. Compound group net sales revenue growth of 15% over FY17-27, fading thereafter to 2%. |
|||||||||||||||||
Base Scenario |
Compound group net sales revenue growth of 10% over FY17-27 and growth fading thereafter to 2%. |
|||||||||||||||||
Under-performance |
Compound group net sales revenue growth of 5% over FY17-27, fading thereafter to 2%. |
|||||||||||||||||
Source: Edison Investment Research
■
Peer comparison: Following the rebound in earnings, and given the healthy outlook, the stock now looks much more attractively priced relative to its peers, although we recognise that there are wide variations in business models across this selection. Nonetheless, the modest EV/sales and EV/EBITDA ratios indicate significant upside potential if CREALOGIX can maintain the margin progression.
Exhibit 13: Peer group valuation
Share price |
Market cap |
EV/sales |
EBITDA margins |
EV/EBITDA (x) |
PE (x) |
||||||
Local curr |
Local curr m |
CHFm |
Year 1 |
Year 2 |
Year 1 |
Year 2 |
Year 1 |
Year 2 |
Year 1 |
Year 2 |
|
CREALOGIX |
136.00 |
149 |
149 |
1.6 |
1.5 |
12.0% |
13.6% |
13.7 |
11.1 |
26.0 |
19.7 |
A) Large, diverse, banking software suppliers |
|||||||||||
FIS |
96.07 |
31,935 |
31127 |
4.5 |
4.4 |
33.3% |
34.7% |
13.4 |
12.7 |
22.4 |
19.7 |
Infosys |
14.89 |
34,202 |
33337 |
2.6 |
2.4 |
26.9% |
26.9% |
9.8 |
9.1 |
15.0 |
14.2 |
Jack Henry |
110.54 |
8,537 |
8321 |
5.6 |
5.3 |
35.3% |
35.4% |
15.9 |
14.9 |
33.6 |
31.2 |
Temenos |
114.80 |
8,134 |
8134 |
11.6 |
10.3 |
38.3% |
39.1% |
30.4 |
26.4 |
46.4 |
39.0 |
Sopra Steria |
161.90 |
3,326 |
3843 |
1.0 |
1.0 |
9.4% |
10.0% |
11.1 |
10.0 |
16.4 |
14.8 |
Iress |
11.75 |
2,013 |
1534 |
5.0 |
4.6 |
27.9% |
29.5% |
18.0 |
15.6 |
25.7 |
22.9 |
Bottomline Tech |
32.41 |
1,309 |
1276 |
3.7 |
3.3 |
22.8% |
22.8% |
16.0 |
14.7 |
30.5 |
25.4 |
Polaris Consulting |
281.80 |
28,807 |
432 |
N/A |
N/A |
N/A |
N/A |
N/A |
N/A |
N/A |
N/A |
Medians |
|
4.5 |
4.4 |
27.9% |
29.5% |
15.9 |
14.7 |
25.7 |
22.9 |
||
B) European banking-related fintech peers |
|||||||||||
Temenos |
114.80 |
8,134 |
8134 |
11.6 |
10.3 |
38.3% |
39.1% |
30.4 |
26.4 |
46.4 |
39.0 |
Sopra Steria |
161.90 |
3,326 |
3843 |
1.0 |
1.0 |
9.4% |
10.0% |
11.1 |
10.0 |
16.4 |
14.8 |
First Derivatives |
3640.00 |
921 |
1183 |
5.3 |
4.7 |
17.9% |
17.6% |
29.8 |
26.9 |
56.2 |
51.9 |
FinTech Group |
23.43 |
394 |
455 |
N/A |
N/A |
N/A |
N/A |
N/A |
N/A |
21.0 |
16.4 |
GFT |
12.89 |
339 |
392 |
1.0 |
1.0 |
9.0% |
9.9% |
11.6 |
10.2 |
19.1 |
15.5 |
RS2 |
1.64 |
281 |
325 |
N/A |
N/A |
N/A |
N/A |
N/A |
N/A |
N/A |
N/A |
Gresham Technologies |
200.00 |
135 |
174 |
6.3 |
5.9 |
25.8% |
27.3% |
24.6 |
21.7 |
31.7 |
30.3 |
Lombard Risk |
7.13 |
29 |
37 |
0.8 |
0.6 |
12.2% |
17.0% |
6.2 |
3.7 |
71.3 |
11.9 |
Medians |
|
3.2 |
2.9 |
15.0% |
17.3% |
18.1 |
15.9 |
31.7 |
16.4 |
||
C) Quoted Swiss IT companies |
|||||||||||
Temenos |
114.80 |
8,134 |
8134 |
11.6 |
10.3 |
38.3% |
39.1% |
30.4 |
26.4 |
46.4 |
39.0 |
Kudelski |
12.20 |
663 |
663 |
0.9 |
0.8 |
8.5% |
9.7% |
10.2 |
8.5 |
21.1 |
14.1 |
Medians |
|
6.2 |
5.6 |
23.4% |
24.4% |
20.3 |
17.5 |
33.7 |
26.5 |
||
Source: Bloomberg consensus data. Note: Prices at 31 October 2017.
Exhibit 14: Financial summary
CHF'000s |
2015 |
2016 |
2017 |
2018e |
2019e |
2020e |
|
Year end 30 June |
Swiss GAAP |
Swiss GAAP |
Swiss GAAP |
Swiss GAAP |
Swiss GAAP |
Swiss GAAP |
|
PROFIT & LOSS |
|||||||
Revenue |
|
49,307 |
63,317 |
74,858 |
82,345 |
89,707 |
97,090 |
Gross Profit |
37,017 |
51,693 |
59,695 |
67,198 |
74,814 |
82,428 |
|
EBITDA |
|
(10,555) |
3,696 |
7,304 |
9,879 |
12,170 |
13,983 |
Adjusted Operating Profit |
|
(11,815) |
2,264 |
5,916 |
8,579 |
10,920 |
12,783 |
Amortisation of acquired intangibles |
(1,616) |
(2,634) |
(1,799) |
(1,799) |
(1,799) |
(1,799) |
|
Exceptionals |
0 |
0 |
0 |
0 |
0 |
0 |
|
Operating Profit |
(13,431) |
(370) |
4,117 |
6,780 |
9,121 |
10,984 |
|
Associates |
(837) |
517 |
(21) |
250 |
263 |
276 |
|
Net Interest |
95 |
(630) |
(936) |
(750) |
(650) |
(100) |
|
Profit Before Tax (norm) |
|
(12,557) |
2,151 |
4,959 |
8,079 |
10,532 |
12,959 |
Profit Before Tax (Statutory) |
|
(14,173) |
(483) |
3,160 |
6,280 |
8,733 |
11,160 |
Tax |
3,899 |
(130) |
(1,751) |
(2,192) |
(2,876) |
(3,551) |
|
Profit After Tax (norm) |
(8,658) |
2,021 |
3,208 |
5,887 |
7,657 |
9,407 |
|
Profit After Tax (Statutory) |
(10,274) |
(613) |
1,409 |
4,088 |
5,858 |
7,608 |
|
Minority interest |
0 |
(270) |
(360) |
(198) |
(108) |
(58) |
|
Net income (norm) |
(8,658) |
1,751 |
2,848 |
5,689 |
7,549 |
9,349 |
|
Net income (Statutory) |
(10,274) |
(883) |
1,049 |
3,890 |
5,750 |
7,550 |
|
Average Number of Shares Outstanding (m) |
1.06 |
1.06 |
1.07 |
1.09 |
1.09 |
1.20 |
|
EPS - normalised (CHF) |
|
(8.13) |
1.65 |
2.67 |
5.24 |
6.89 |
7.80 |
EPS - Statutory (CHF) |
|
(9.65) |
(0.83) |
0.98 |
3.58 |
5.25 |
6.30 |
Dividend per share (CHF) |
2.00 |
0.00 |
0.50 |
1.00 |
1.50 |
2.00 |
|
Gross Margin (%) |
75.1 |
81.6 |
79.7 |
81.6 |
83.4 |
84.9 |
|
EBITDA Margin (%) |
(21.4) |
5.8 |
9.8 |
12.0 |
13.6 |
14.4 |
|
Op Margin (before GW and except.) (%) |
(24.0) |
3.6 |
7.9 |
10.4 |
12.2 |
13.2 |
|
BALANCE SHEET |
|||||||
Fixed Assets |
|
20,371 |
28,910 |
26,430 |
24,401 |
22,564 |
20,924 |
Intangible assets and deferred tax |
14,115 |
21,004 |
18,119 |
16,320 |
14,521 |
12,722 |
|
Tangible Assets |
1,869 |
1,595 |
1,385 |
1,155 |
1,117 |
1,276 |
|
Investments & pensions |
4,387 |
6,311 |
6,926 |
6,926 |
6,926 |
6,926 |
|
Current Assets |
|
28,217 |
48,275 |
52,495 |
60,847 |
67,792 |
78,161 |
Stocks |
3,447 |
3,661 |
3,419 |
3,761 |
4,097 |
4,434 |
|
Debtors |
11,633 |
17,119 |
15,301 |
16,831 |
18,336 |
19,845 |
|
Cash |
10,815 |
27,495 |
33,775 |
40,255 |
45,358 |
53,882 |
|
Current Liabilities |
|
(19,183) |
(24,752) |
(24,219) |
(26,546) |
(50,716) |
(31,253) |
Creditors |
(19,183) |
(24,752) |
(24,219) |
(26,546) |
(28,879) |
(31,253) |
|
Short term borrowings |
0 |
0 |
0 |
0 |
(21,837) |
0 |
|
Long Term Liabilities |
|
(2,723) |
(27,331) |
(25,191) |
(22,043) |
(206) |
(206) |
Long term borrowings |
0 |
(24,141) |
(24,005) |
(21,837) |
0 |
0 |
|
Other long term liabilities |
(2,723) |
(3,190) |
(1,186) |
(206) |
(206) |
(206) |
|
Net Assets |
|
26,682 |
25,102 |
29,515 |
36,660 |
39,434 |
67,626 |
CASH FLOW |
|||||||
Operating Cash Flow |
|
(4,503) |
1,281 |
9,735 |
10,291 |
12,618 |
14,469 |
Net Interest |
91 |
5 |
(616) |
(750) |
(650) |
(100) |
|
Tax |
(269) |
(144) |
(1,273) |
(1,178) |
(2,181) |
(2,844) |
|
Capex |
(1,018) |
(486) |
(862) |
(1,070) |
(1,211) |
(1,359) |
|
Acquisitions/disposals |
(4,158) |
(9,350) |
(346) |
0 |
(2,387) |
0 |
|
Financing |
925 |
1,504 |
(215) |
1,890 |
0 |
21,837 |
|
Dividends |
(2,126) |
0 |
0 |
(534) |
(1,086) |
(1,642) |
|
Net Cash Flow |
(11,058) |
(7,190) |
6,423 |
8,648 |
5,103 |
30,360 |
|
Opening net debt/(cash) |
|
(21,724) |
(10,815) |
(3,354) |
(9,770) |
(18,418) |
(23,521) |
Other |
149 |
(271) |
(7) |
0 |
0 |
0 |
|
Closing net debt/(cash) |
|
(10,815) |
(3,354) |
(9,770) |
(18,418) |
(23,521) |
(53,882) |
Source: CREALOGIX (historics), Edison Investment Research (forecasts). Note: The FY19 outflow represents the final payment for Elaxy FS&S. We have treated the convertible bond conversions in FY18 and FY20 as equity financing inflows.
|
|||||||||||||||||||||||||||||||||||||||||||||||
|
|
Green Dragon Gas (GDG) has announced that it has progressed discussions with the majority of its debt holders to extend existing debt maturities to 20 November 2018. Extensions are subject to the execution of amendments and an inter-creditor agreement between debt holders, and are expected to be finalised on or before 15 November 2017. GDG’s Nordic Bond (US$88m) will be extended to 20 November 2018 and the put option on GDG’s convertible bond (US$50m) will be extended to allow for conclusion of an inter-creditor agreement to provide it with the same security as the Nordic Bond Trustee but subordinated. Our current valuation and financial forecasts (shown below) are under review.