H1 results reflect the progress 7digital Group has made over the last year and the initial impact of the transformative 24-7 acquisition, with exit monthly recurring revenues (MRR) up 113%. The step change in revenues forecast in H2 looks underpinned and the integration of 24-7 has started, key to moving to positive cash flow in H218 – a target reiterated by management. We expect this to trigger a re-rating of the shares, which trade on 4.1x FY18e EBITDA, a fraction of its B2B video streaming peers.
Written by
7digital Group |
H2 step increase in revenues underpinned |
Interim update |
Media |
29 September 2017 |
Share price performance
Business description
Next events
Analysts
7digital Group is a research client of Edison Investment Research Limited |
|||||||||||||||||||||||||||||||||||||||||||||||
H1 results reflect the progress 7digital Group has made over the last year and the initial impact of the transformative 24-7 acquisition, with exit monthly recurring revenues (MRR) up 113%. The step change in revenues forecast in H2 looks underpinned and the integration of 24-7 has started, key to moving to positive cash flow in H218 – a target reiterated by management. We expect this to trigger a re-rating of the shares, which trade on 4.1x FY18e EBITDA, a fraction of its B2B video streaming peers.
Year end |
Revenue (£m) |
EBITDA |
PBT* |
EPS* |
DPS |
EV/EBITDA |
P/E |
12/15 |
10.4 |
(2.1) |
(7.6) |
(7.1) |
0.0 |
N/A |
N/A |
12/16 |
11.9 |
(3.5) |
(4.7) |
(4.1) |
0.0 |
N/A |
N/A |
12/17e |
19.1 |
(1.7) |
(2.9) |
(1.8) |
0.0 |
N/A |
N/A |
12/18e |
24.9 |
3.0 |
2.1 |
1.2 |
0.0 |
4.1 |
5.3 |
Note: *PBT and EPS are normalised, excluding amortisation of acquired intangibles, exceptional items and share-based payments.
Strong client momentum and 24-7 deal
Revenues increased 9%, or 17% before foreign currency translation effects. Despite the consolidation of one month of 24-7, the cost base decreased 4% enabling a 36% reduction in EBITDA losses to £1.7m. While this acquisition was the main contributor to the 113% increase in the annualised exit MRR to £11.5m, the group has also made solid organic progress. £4m of new business was won in H1 from strategically significant customers across a range of sectors. Furthermore, the high-quality MQA audio format supported by 7digital, the only B2B service to do so, is gaining momentum. It is now supported by over 80% of global music labels, spurring interest across the sector for HD audio streaming services.
Good visibility in revenues
Management targets EBITDA profitability in 2018. This is predicated on more than doubling revenues in the second half of this year and full integration of 24-7 (by H218). With 65% of revenue forecasts already contracted, and most of our forecast for licensing revenues considered highly secure, it appears on track. There is still much work to be done to deliver the cost synergies associated with 24-7; here, management can draw on its experience following the acquisition of Snowite last year. Cash reserves at the end of June were £0.9m. Together with an additional £4.9m of guaranteed pre-payments in H2, this should bring the group to, or close to, the point at which it becomes cash flow positive, which we forecast in H218.
Valuation: Progress warrants re-rating
7digital is well positioned to benefit from the strong growth in the market for streamed music (H117 streaming revenues +180%). The 4.1x FY18e EV/EBITDA multiple, which is low for an operationally geared growth company’s first year of profitability, is a fraction of the average 14.4x rating of its (more mature) peer set of video streaming companies. As the group moves towards targeted EBITDA profitability in FY18, which is contingent on the successful integration of 24-7, we expect to see a significant re-rating.
H1 results highlights
Total revenues increased by 9% to £5.9m and 17% before foreign currency translational effects. 24-7, acquired in June, contributed £530k to revenues, which implies solid organic constant currency revenue growth of approximately 7%. With the bulk of revenue growth from higher-margin licensing and creative revenues, gross margins expanded to 71% (H116: 61%) and gross profit increased by 27% to £4.2m. Despite the consolidation of one month of 24-7’s cost base, operating expenses decreased by 4%, as the group continues to see the benefit of the efficiency programme initiated last year and cost synergies following last year’s acquisition of Snowite. Consequently, the H117 EBITDA loss was reduced to £1.7m (H116: £2.6m).
Exhibit 1: Summary H117 results and forecasts, £000s
Revenues |
H116 |
H117 |
Change |
H217e |
FY17e |
FY18e |
FY19e |
Licence sales |
3,043 |
4,036 |
33% |
10,685 |
14,721 |
20,557 |
23,191 |
Content |
1,367 |
1,117 |
-18% |
728 |
1,845 |
1,660 |
1,494 |
Creative |
837 |
982 |
17% |
1,312 |
2,294 |
2,639 |
2,902 |
Other |
196 |
(198) |
-201% |
448 |
250 |
0 |
0 |
Total revenues |
5,443 |
5,937 |
9% |
13,173 |
19,110 |
24,856 |
27,587 |
Revenue growth |
60.6% |
30.1% |
11.0% |
||||
Gross profit: |
|||||||
Licensing |
2,771 |
3,526 |
27% |
9,723 |
13,249 |
18,501 |
20,872 |
Content |
127 |
31 |
-76% |
172 |
203 |
183 |
164 |
Creative |
423 |
546 |
29% |
601 |
1,147 |
1,319 |
1,451 |
FX |
3 |
132 |
118 |
250 |
0 |
0 |
|
Total gross profit |
3,324 |
4,235 |
27% |
10,614 |
14,849 |
20,003 |
22,487 |
Gross margin |
61.1% |
71.3% |
80.6% |
77.7% |
80.5% |
81.5% |
|
Operating expenses |
(5,952) |
(5,921) |
-1% |
(10,675) |
(16,596) |
(17,038) |
(17,842) |
EBITDA |
(2,628) |
(1,686) |
-36% |
(61) |
(1,747) |
2,965 |
4,646 |
EBITDA margin |
-48.3% |
-28.4% |
-0.5% |
-9.1% |
11.9% |
16.8% |
|
Normalised EBITA |
(3,079) |
(2,333) |
-24% |
(542) |
(2,875) |
2,145 |
3,762 |
Normalised PBT |
(3,074) |
(2,333) |
-24% |
(542) |
(2,875) |
2,130 |
3,762 |
Reported PBT |
(3,174) |
(2,975) |
-6% |
(1,292) |
(4,267) |
478 |
3,762 |
Source: Historics - 7digital, forecasts - Edison Investment Research
Review by division
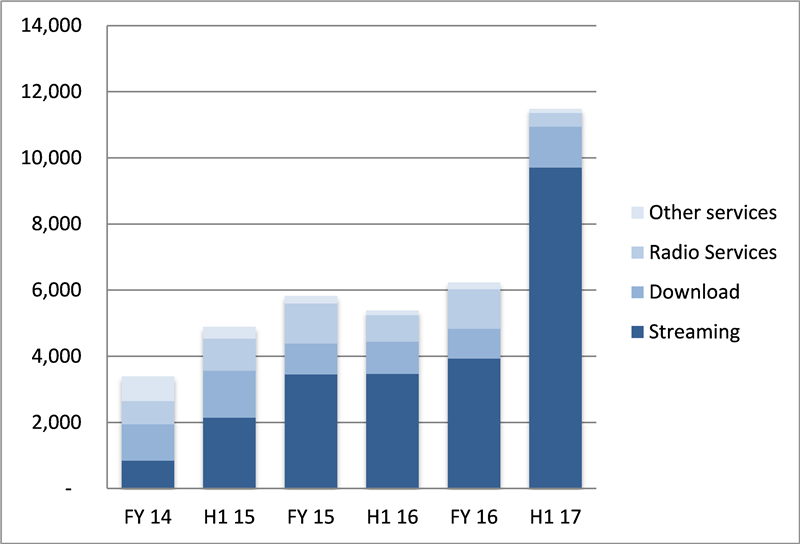
Licensing revenues increased by 33% to £4.0m, and MRR (monthly recurring revenues, which excludes one-off revenues, ORR) increased 38% to £3.2m. The annualised exit MRR, which is more relevant for gauging the group’s outlook, increased by 113% to £11.5m, of which streaming MRR increased by 180%. Much of this increase is due to the acquisition of 24-7, which is expected to contribute £5m to revenues this year (mainly in H217) and £8m next year. However, there was also solid organic growth momentum across a number of verticals:
■
Hardware: A three- year deal with Ubithings to power Prizm, its subscription streaming service on its smart audio player, initially in France with other territories to follow. Prizm devices come with unlimited music access for a year before reverting to an annual subscription of €40. Two other hardware deals signed in the period include Onkyo, to redesign its digital music stores, and DTS, related to the development of a high-resolution audio solution prototype for the automotive market.
■
Direct to consumer services: The relaunch of TriPlay’s eMusic service in the US and the HDtracks music service, which post launch in H2 will use the MQA standard supported by 7digital (the only B2B provider to currently do so). It also extended its agreement with hugely popular social media music service musical.ly, doubling the number of territories covered to 60.
■
Music labels: 7digital is the only B2B platform that supports the high-resolution master quality authenticated (MQA) file format, which has received support from all the main record labels and is now gaining momentum. Its expertise in this area has also resulted in additional work for the major record labels and their artists in the period.
■
During the period, the group also acquired Flow Radio’s technology platform and certain customers from Imagination Technologies. Flow Radio is an internet radio aggregation service that provides consumer access to over 25k radio stations worldwide.
Creative revenues increased 17% to £1.0m driven by renewals of long-terms clients (BBC Radio 2’s Pick of the Pops, The Folk Show, The Golden Hour) as well as new clients and services; for example, it is starting to see some synergies between divisions with the use of its curation skills for the creation of playlists for its streaming customers (Electric Jukebox).
Content revenues decreased by 18% to £1.1m and continue to provide a headwind to total top line growth. The prior year comparison includes project based revenues from a major label to use 7digital's platform for the sale of music downloads direct from an artist's own website. Excluding these revenues (which are now classified as B2B revenues within licensing), content revenues decreased by a more moderate 3%. These are very low-margin revenues and have little impact at the group’s gross profit level. The H117 gross margin was 3.2%, lower than the 5-10% typical margin due to the catch up of expensing credit card charges.
Outlook: Full 24-7 impact in H2 and client momentum moving into H217
Excluding MMS, contracts with a lifetime value of c £4m were signed in H1 (some of which are renewals), which will contribute to revenues from H2. Furthermore, since the period end, 7digital has announced several client wins: Global Eagle Entertainment (Nasdaq-listed inflight entertainment content to the airline industry), Deedo SAS (for a new music streaming service across 27 markets in Africa and Asia) and US group Fan Label. In parallel with its results announcement, 7digital also disclosed a new contract with Fender (a leading musical instruments company).
The second half of the year will also see the full benefit from the acquisition of 24-7. As well as the ongoing business acquired (three-year contract to run the Juke! music services and other third-party business for £6m pa), MediaMarktSaturn (MMS) has widened its relationship with 7digital, committing to a new contract worth £6m to develop new digital music services. Management has reiterated its expectation that the 24-7 acquisition will add £5m of revenues, mostly in the second half of this year and more than £8m in 2018. In total, 24-7 brings approximately £18m of contracted revenues over the coming three years. This estimate excludes the potential to develop the acquired business, an area where the group is feeling increasingly confident it can drive concrete revenue synergies; for example, additional work is currently under discussion with MMS.
Good revenue visibility: A significant share of licensing contracted
Overall, the solid H1 performance, a developed pipeline and the full impact of the 24-7 deal should result in a step change in revenues in the second half, in line with our forecasts. While the cost base will also rise as 24-7 is integrated for the entire period (we factor in an 80% increase in the cost base in H217 from H1), the synergy opportunities are considerable; work is underway to consolidate the technology platforms and a full review of all of 7digital’s European offices should lead to additional savings next year. Consequently, from the second half of 2018, we expect the majority of new revenues to convert to EBITDA, underpinning our forecast for EBITDA profitability and positive operating cash flow next year.
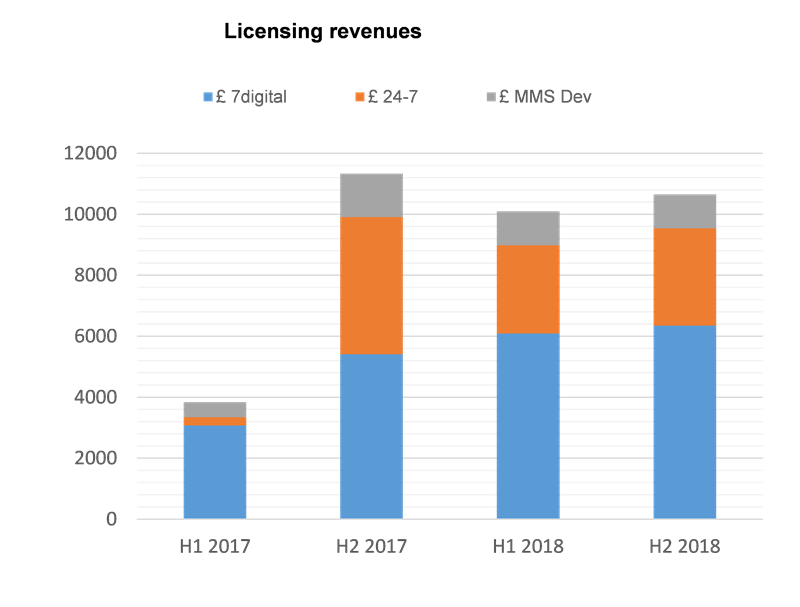
Revenue visibility is good. Approximately 65% (£7m) of our H2 revenue forecast is contracted and all of our £11m H2 forecast licensing revenues are considered “highly secure” (Exhibit 3). Growth in creative revenues is tracking ahead of our full year forecasts and the reduction in content revenues is as expected. We make no change to our estimates.
|
Exhibit 2: Annualised exit MRR (£000s) |
Exhibit 3: Licensing revenues outlook – highly secure and contracted (£000s) |
|
|
|
Source: 7digital interim 2017 presentation |
|
Exhibit 2: Annualised exit MRR (£000s) |
|
|
Source: 7digital interim 2017 presentation |
|
Exhibit 3: Licensing revenues outlook – highly secure and contracted (£000s) |
|
|
Source: 7digital interim 2017 presentation |
Cash flow and balance sheet
Net debt at June was £0.5m, including cash reserves of £0.9m (FY16: net debt £0.7m, cash £0.8m). This includes only £0.8m of the £5.7m pre-payment for existing services and setup fees agreed as part of the MMS contract. A further £2.2m was received in July, £1.4m in August and £1.3m is expected in October. This also explains the £3m increase in trade debtors and corresponding increase in accruals and deferred income.
While the cost base is forecast to increase significantly in H217, this should be covered by the incremental revenues and we expect operating cash outflow to decrease. On this basis, the extra working capital from MMS should, if carefully managed, be sufficient to see it through to Q118 or Q218. That said, it is dependent upon astute working capital management and the integration process proceeding to plan. Given the already long payables cycle, additional short-term facilities may be advisable to provide some flexibility until the anticipated cost savings (as a result of the integration of 24-7) are fully realised, which we expect to bring the group to positive cash flow in H218, in line with management’s target. We have assumed an additional £2.0m short-term financing is drawn in our FY18 estimates (we had previously assumed £0.5m).
Valuation
7digital offers unique exposure to the rapidly growing music streaming segment in Europe (H117 streaming MRR +180%), which will be increasingly in focus following Spotify’s mooted IPO later this year.
The group has made considerable strategic and operational progress over the past year. The transition to a licensing business is complete, a number of strategically significant customer wins have been announced and the acquisition of 24-7 consolidates the group’s leading position and should enhance profitability. Via this acquisition and a focus on higher tier customers, the quality of 7digital’s revenue base has improved considerably, which should also help mitigate past issues relating to customer loss through bankruptcy.
There is still work to be done to deliver to forecasts; however, revenue visibility is strong and provided management’s EBITDA targets can be met in FY18, the shares look very attractive.
■
Based on our forecasts, 7digital trades on an FY18e EV/sales multiple of 0.5x, an EV/EBITDA of 4.1x and a P/E of 5.3x. On a standalone basis, we believe these multiples are very attractive for an operationally geared company, with a strong market position in its first year of profitability. The valuation looks similarly attractive in the context of its peer set, which trades on an average FY18 EV/sales multiple of 1.7x and an EV/EBITDA multiple of 14.4x. If 7digital were to trade towards the lower end of its peer set on 8x FY18 forecast EBITDA, this would offer upside towards 14p/share. An average EBITDA multiple would imply a value per share of approximately 23p.
■
We are forecasting an EBITDA margin of 12% in FY18 and 17% in FY19 and consider a peak EBITDA margin of 20% to be achievable by FY20. If we assume moderate revenue growth of 5% pa for the seven years to FY26, our DCF returns a value of 13.7p. A slightly more aggressive growth rate over this period of 10% returns a value of 17.9p.
Please refer to our initiation report Stand and deliver for more information on 7digital.
Exhibit 4: Financial summary
£'000s |
2014 |
2015 |
2016 |
2017e |
2018e |
2019e |
||
31-December |
IFRS |
IFRS |
IFRS |
IFRS |
IFRS |
IFRS |
||
INCOME STATEMENT |
||||||||
Revenue |
|
|
10,212 |
10,392 |
11,899 |
19,110 |
24,856 |
27,587 |
Cost of Sales |
(4,882) |
(3,308) |
(3,451) |
(4,261) |
(4,853) |
(5,100) |
||
Gross Profit |
5,330 |
7,084 |
8,448 |
14,849 |
20,003 |
22,487 |
||
EBITDA |
|
|
(3,108) |
(2,102) |
(3,528) |
(1,747) |
2,965 |
4,646 |
Normalised operating profit |
|
|
(3,775) |
(2,862) |
(4,684) |
(2,875) |
2,145 |
3,762 |
Amortisation of acquired intangibles |
0 |
0 |
(321) |
(552) |
(552) |
0 |
||
Exceptionals |
(388) |
(128) |
(464) |
(840) |
(1,100) |
0 |
||
Share-based payments |
(340) |
(137) |
4 |
0 |
0 |
0 |
||
Reported operating profit |
(4,503) |
(3,127) |
(5,465) |
(4,267) |
493 |
3,762 |
||
Net Interest |
3 |
11 |
(13) |
0 |
(15) |
0 |
||
Joint ventures & associates (post tax) |
0 |
0 |
0 |
0 |
0 |
0 |
||
Exceptionals |
1,888 |
(4,767) |
0 |
0 |
0 |
0 |
||
Profit Before Tax (norm) |
|
|
(1,884) |
(7,618) |
(4,697) |
(2,875) |
2,130 |
3,762 |
Profit Before Tax (reported) |
|
|
(2,612) |
(7,883) |
(5,478) |
(4,267) |
478 |
3,762 |
Reported tax |
(17) |
(3) |
(12) |
0 |
0 |
(376) |
||
Profit After Tax (norm) |
(1,901) |
(7,621) |
(4,709) |
(2,875) |
2,130 |
3,386 |
||
Profit After Tax (reported) |
(2,629) |
(7,886) |
(5,490) |
(4,267) |
478 |
3,386 |
||
Minority interests |
0 |
0 |
0 |
0 |
0 |
0 |
||
Discontinued operations |
3,004 |
0 |
0 |
0 |
0 |
0 |
||
Net income (normalised) |
(1,901) |
(7,621) |
(4,709) |
(2,875) |
2,130 |
3,386 |
||
Net income (reported) |
375 |
(7,886) |
(5,490) |
(4,267) |
478 |
3,386 |
||
Basic average number of shares outstanding (m) |
87 |
108 |
114 |
160 |
183 |
183 |
||
EPS - basic normalised (p) |
|
|
(2.2) |
(7.1) |
(4.1) |
(1.8) |
1.2 |
1.9 |
EPS - diluted normalised (p) |
|
|
(2.2) |
(7.1) |
(4.1) |
(1.8) |
1.2 |
1.9 |
EPS - basic reported (p) |
|
|
0.4 |
(7.3) |
(4.8) |
(2.7) |
0.3 |
1.9 |
Dividend (p) |
0.00 |
0.00 |
0.00 |
0.00 |
0.00 |
0.00 |
||
Revenue growth (%) |
N/A |
1.8 |
14.5 |
60.6 |
30.1 |
11.0 |
||
Gross Margin (%) |
52.2 |
68.2 |
71.0 |
77.7 |
80.5 |
81.5 |
||
EBITDA Margin (%) |
N/A |
N/A |
N/A |
N/A |
11.9 |
16.8 |
||
Normalised Operating Margin |
N/A |
N/A |
N/A |
N/A |
8.6 |
13.6 |
||
BALANCE SHEET |
||||||||
Fixed Assets |
|
|
7,661 |
1,121 |
2,778 |
3,508 |
2,836 |
2,673 |
Intangible Assets |
345 |
417 |
2,303 |
3,013 |
2,541 |
2,548 |
||
Tangible Assets |
691 |
704 |
475 |
495 |
295 |
125 |
||
Investments & other |
6,625 |
0 |
0 |
0 |
0 |
0 |
||
Current Assets |
|
|
8,451 |
6,220 |
4,590 |
5,327 |
7,838 |
8,358 |
Stocks |
44 |
62 |
177 |
177 |
177 |
177 |
||
Debtors |
3,095 |
4,502 |
3,575 |
4,712 |
6,129 |
6,802 |
||
Cash & cash equivalents |
5,312 |
1,656 |
838 |
438 |
1,532 |
1,378 |
||
Other |
0 |
0 |
0 |
0 |
0 |
0 |
||
Current Liabilities |
|
|
(4,984) |
(3,975) |
(7,193) |
(8,652) |
(8,198) |
(7,354) |
Creditors |
(4,796) |
(3,804) |
(6,731) |
(8,190) |
(7,736) |
(6,892) |
||
Tax and social security |
0 |
0 |
0 |
0 |
0 |
0 |
||
Short term borrowings |
0 |
0 |
0 |
0 |
0 |
0 |
||
Other |
(188) |
(171) |
(462) |
(462) |
(462) |
(462) |
||
Long Term Liabilities |
|
|
0 |
0 |
(1,746) |
(1,561) |
(3,376) |
(1,191) |
Long term borrowings |
0 |
0 |
(1,519) |
(1,334) |
(3,149) |
(964) |
||
Other long term liabilities |
0 |
0 |
(227) |
(227) |
(227) |
(227) |
||
Net Assets |
|
|
11,128 |
3,366 |
(1,571) |
(1,378) |
(900) |
2,486 |
Minority interests |
0 |
0 |
0 |
0 |
0 |
0 |
||
Shareholders' equity |
|
|
11,128 |
3,366 |
(1,571) |
(1,378) |
(900) |
2,486 |
CASH FLOW |
||||||||
Op Cash Flow before WC and tax |
(3,108) |
(2,102) |
(3,528) |
(1,747) |
2,965 |
4,646 |
||
Working capital |
(2,788) |
(2,439) |
4,098 |
322 |
(1,871) |
(1,518) |
||
Exceptional & other |
(391) |
(150) |
(1,024) |
(840) |
(1,100) |
0 |
||
Tax |
(17) |
(3) |
(12) |
0 |
0 |
(376) |
||
Net operating cash flow |
|
|
(6,304) |
(4,694) |
(466) |
(2,265) |
(6) |
2,751 |
Capex |
(345) |
(848) |
(447) |
(800) |
(700) |
(720) |
||
Acquisitions/disposals |
3,718 |
1,828 |
108 |
0 |
0 |
0 |
||
Net interest |
2 |
11 |
(13) |
0 |
(15) |
0 |
||
Equity financing |
6,952 |
0 |
0 |
2,850 |
0 |
0 |
||
Dividends |
0 |
0 |
0 |
0 |
0 |
0 |
||
Other |
(1) |
0 |
0 |
0 |
0 |
0 |
||
Net Cash Flow |
4,022 |
(3,703) |
(818) |
(215) |
(721) |
2,031 |
||
Opening net debt/(cash) |
|
|
(1,290) |
(5,312) |
(1,656) |
681 |
896 |
1,617 |
FX |
0 |
48 |
0 |
0 |
0 |
0 |
||
Other non-cash movements |
0 |
0 |
(1,519) |
0 |
0 |
0 |
||
Closing net debt/(cash) |
|
|
(5,312) |
(1,656) |
681 |
896 |
1,617 |
(414) |
Source: 7digital (historics), Edison Investment Research (forecasts)
|
|
Air Partner (AIR) is on a journey of transformation, with a clear, long-term strategy to become a world-class global aviation services group. While AIR’s market includes some inherent volatility, the group is international, broadly based and diversified – increasingly so as the younger Consulting & Training business scales up. Cash-rich, it is well-placed both to add and grow complementary businesses.