Last close As at 21/08/2026
GBP1.14
▲ 0.50 (0.44%)
Market capitalisation
GBP327m
Research: TMT
Boku reported 24% y-o-y revenue growth in H124, with both digital wallet/account-to-account (A2A) payments and direct carrier billing (DCB) payments growing at double-digit rates. Adjusted EBITDA grew 18% y-o-y with a margin of 30.1%. With ambitions to become the best localised payment partner for global commerce, Boku continues to invest in enhancing its product portfolio and strengthening its compliance and treasury functions. A pipeline of new digital wallet/A2A launches for major merchants and seasonal factors support continued strong growth in H224 and 2025. With FY24 outlook maintained, our revenue and adjusted EBITDA forecasts are unchanged.
Boku |
H124 revenue growth supports FY24 outlook |
H124 results |
Software and comp services |
24 September 2024 |
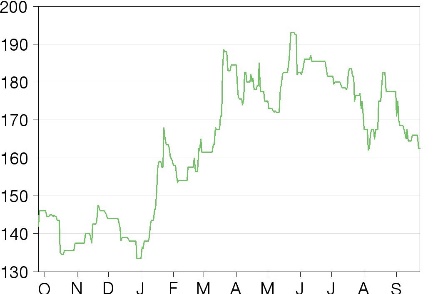
Share price performance
Business description
Next event
Analyst
Boku is a research client of Edison Investment Research Limited |
|||||||||||||||||||||||||||||||||||||||||||||
Boku reported 24% y-o-y revenue growth in H124, with both digital wallet/account-to-account (A2A) payments and direct carrier billing (DCB) payments growing at double-digit rates. Adjusted EBITDA grew 18% y-o-y with a margin of 30.1%. With ambitions to become the best localised payment partner for global commerce, Boku continues to invest in enhancing its product portfolio and strengthening its compliance and treasury functions. A pipeline of new digital wallet/A2A launches for major merchants and seasonal factors support continued strong growth in H224 and 2025. With FY24 outlook maintained, our revenue and adjusted EBITDA forecasts are unchanged.
Year |
Revenue |
EBITDA* |
Diluted EPS* |
DPS |
P/E |
EV/EBITDA |
12/22 |
63.8 |
20.2 |
3.9 |
0.0 |
54.7 |
26.5 |
12/23 |
82.7 |
25.8 |
5.6 |
0.0 |
38.9 |
20.8 |
12/24e |
96.6 |
30.6 |
6.8 |
0.0 |
32.0 |
17.5 |
12/25e |
107.1 |
35.8 |
7.7 |
0.0 |
28.1 |
15.0 |
Note: *EBITDA and EPS are normalised, excluding amortisation of acquired intangibles, exceptional items and share-based payments.
Other LPM revenue up 64% to 25% of total revenue
Boku reported H124 revenue of $47.3m, up 24% y-o-y (30% at constant exchange rates, CER). Total payment volume (TPV) of $5.8bn was 16% higher yo-y (26% CER), resulting in a take rate of 0.81% versus 0.76% in H123, reflecting the increasing proportion of digital wallet/A2A transactions. DCB revenue grew 14% y-o-y, while an 86% y-o-y increase in other local payment method (LPM) monthly active users (MAUs) drove other LPM revenue growth of 64% y-o-y. Adjusted EBITDA of $14.2m was 18% higher y-o-y, reflecting continued investment to support scaling of the business.
FY24 outlook maintained
Management expects to meet consensus forecasts for FY24, with adjusted EBITDA margins broadly flat versus 2023. We maintain our revenue and adjusted EBITDA forecasts, with changes to reported operating profit and EPS reflecting higher share-based payments and other one-off items. With all major merchants signed up to use Boku digital wallet/A2A connections, we expect the rollout of these connections to drive material growth in the short to medium term.
Valuation: LPM adoption to drive upside
Boku is trading at a premium to its peer group on FY24/25 EV/EBITDA multiples. Via a reverse discounted cash flow that uses our forecasts to FY26 and a WACC of 8%, we estimate the share price is factoring in revenue growth of 3% and average EBITDA margins of 25% for FY27–33, which in our view is extremely conservative considering the potential of the digital wallet/A2A market and the current level of profitability. A growing contribution from Amazon, continued adoption of LPM and new major merchant sign-ups would be the main drivers of longer-term growth and profits.
Review of H124 results
Exhibit 1 summarises H124 results.
Exhibit 1: H124 results highlights
$m |
H124 |
H123 |
y-o-y |
Revenue |
47.3 |
38.2 |
24% |
Gross profit |
45.9 |
36.9 |
25% |
Adjusted EBITDA |
14.2 |
12.1 |
18% |
Normalised operating profit |
11.5 |
9.6 |
20% |
Reported operating profit |
(0.4) |
2.1 |
N/A |
Normalised net income |
10.3 |
7.8 |
31% |
Reported net income |
(1.1) |
1.8 |
N/A |
Normalised diluted EPS ($) |
0.0330 |
0.0239 |
38% |
Reported basic EPS ($) |
(0.0036) |
0.0060 |
N/A |
Net cash |
148.5 |
113.9 |
30% |
Gross margin |
97.1% |
96.6% |
0.6pp |
EBITDA margin |
30.1% |
31.6% |
-1.6pp |
Normalised EBIT margin |
24.3% |
25.1% |
-0.8pp |
Reported operating margin |
-0.8% |
5.6% |
-6.4pp |
Source: Boku, Edison Investment Research
In its July trading update, Boku expected to report H124 revenue of at least $47m and adjusted EBITDA margins broadly flat versus 2023. H124 reported revenue of $47.3m was 24% higher y-o-y and 30% higher at CER. Adjusted EBITDA increased 18% y-o-y to $14.2m with a margin of 30.1%, which compares to 31.6% in H123 and 31.2% in FY23, and met the company target for a margin of at least 30%. Underlying operating costs increased 28% y-o-y to $31.7m as the company focused on enhancing the product offering and strengthening its delivery capability to support scaling the business. This includes building a sophisticated treasury platform to manage cross-border cash flows and provide best-in-market payments capability and foreign exchange rates for merchants. The company has also strengthened the management team, adding Victoria Rogers as chief people officer, Paul Jarrett as global head of banking, and Rob Whittick as CFO to replace Keith Butcher who recently retired.
Normalised operating profit, which excludes amortisation of acquired intangibles, share-based payments and one-off items (including FX gains/losses), increased 20% y-o-y to $11.5m (margin 24.3%).
The company reported an operating loss of $0.4m due to the following items:
■
Share based payments: this increased to $5.8m from $4.0m a year ago. The company issues restricted stock units (RSUs), which vest in full over three years and the charge reflects the higher share price (181.5p at end H124, 193.0p high during H124 vs 136.5p at end H123 and 153.5p high during H123). This figure also includes the national insurance accrual on the RSUs which will depend on the share price at the end of the period.
■
Amortisation: the company has accelerated the amortisation of part of the Fortumo platform, classified as an acquired intangible. Amortisation increased to $2.8m from $2.1m a year ago. The platform should be fully amortised by the end of FY25.
■
FX gains/losses: the company reported a $4.8m currency loss on the revaluation of non-US dollar balances. This was a loss of $3.1m a year ago.
After net interest income of $1.5m and a fair value loss of $3.3m for the Amazon warrants (due to Boku’s higher share price), the company reported a loss before tax of $2.2m and a net loss of $1.1m.
Boku closed H124 with total cash of $148.5m, including $24.8m in restricted cash. Of total cash, the company estimates that $75.2m was ‘own cash’ (ie not money due to merchants as part of the settlement process). This compares to $54.4m at the end of H123 and $70.4m at the end of FY23. The average daily cash balance during June 2024 was $138.6m compared to $105.8m in June 2023.
The company bought back 700,000 shares in H124 at a cost of $1.6m, more than offset by the $3m received from Danal’s exercise of 1,634,699 warrants relating to the acquisition of Danal in 2019. The company’s share buyback programme expired on 30 June 2024 at which point the company held 747,451 shares in treasury. These will be used to satisfy RSUs.
Continued strong growth of digital wallets and A2A
Exhibit 2 summarises the key performance metrics of the business.
Exhibit 2: Key performance metrics
H124 |
H123 |
Growth y-o-y |
|
TPV ($bn) |
5.8 |
5.0 |
16% |
Take rate |
0.81% |
0.76% |
0.05pp |
Monthly active users (MAU) |
79.6m |
61.2m |
30% |
New users |
39.9m |
32.7m |
22% |
Other Local Payment Methods (LPM): |
|||
MAUs |
8.8m |
4.7m |
86% |
New users |
9.2m |
6.3m |
46% |
Other LPM MAU/Total MAU |
11.1% |
7.7% |
|
Other LPM new users/total new users |
23.1% |
19.3% |
|
Revenue from other LPMs ($m) |
11.9 |
7.3 |
64% |
Revenue from DCB & bundling ($m) |
35.4 |
30.9 |
14% |
Other LPM revenue/group revenue |
25% |
19% |
Source: Boku
Total payment volume increased 16% y-o-y (26% CER). The company launched more than 50 new connections in H124 with new and existing merchants, including Netflix, Sony and Google.
The take rate increased 5bp to 0.81% as the proportion of higher take rate digital wallet/A2A volumes increased. Overall, MAUs increased 30% y-o-y and 18% h-o-h, with other LPMs MAUs growing 86% y-o-y and 31% h-o-h. New users increased 22% y-o-y or 19% h-o-h with other LPM new users up 46% y-o-y or 23% h-o-h. Other LPMs now make up 11.1% of MAUs up from 7.7% a year ago. Revenue from other LPMs grew 64% y-o-y to $11.9m, making up 25% of group revenue versus 19% a year ago. DCB maintained strong growth, with revenue up 14% y-o-y.
Major merchant adoption of other LPMs driving strong growth
For H224 and 2025, there are multiple factors that should support continued growth of other LPM volumes and revenue. In August, the game ‘Black Myth: Wukong’ was launched in China for PlayStation 5 and Windows. Boku supports Sony in China with Alipay and WeChatPay payment options. H2 is typically seasonally stronger, partly due to the launch of EA Sports FC (previously FIFA) games in September each year. The company noted in March that all of its major merchants had signed up to implement other LPMs. We expect the rollout of these connections to drive growth in new and monthly active users, TPV and revenue over at least the next two years.
New RSU plan reflects growth ambitions
On 11 September, shareholders approved a new incentive plan for the executive management team. This is a stretch RSU plan that vests on the following basis, using the base share price of 180.4p and the tested share price (40-day volume weighted average price following the release of FY27 results):
Exhibit 3: RSU vesting schedule
Tested share price vs base share price |
|||||
<3x |
3x |
3-5x |
5x |
||
Vesting |
0% |
25% |
straight line basis between 25% and 100% |
100% |
|
Source: Boku
The aggregate number of shares that will be allocated to this plan will not exceed 9,090,858 shares (3% of issued share capital on 31 July 2024).
Outlook and changes to forecasts
The company maintained its outlook, expecting solid top-line growth, with adjusted EBITDA margins broadly flat versus 2023, and is confident of achieving market consensus forecasts for the full year.
We have revised our forecasts to reflect H124 results and below-EBITDA items, including amortisation, share-based payments and FX losses.
Exhibit 4: Changes to forecasts
$m |
FY24e |
FY24e |
FY25e |
FY25e |
FY26e |
FY26e |
|||||||
Old |
New |
Change |
y-o-y |
Old |
New |
Change |
y-o-y |
Old |
New |
Change |
y-o-y |
||
Revenue |
96.2 |
96.6 |
0.5% |
16.8% |
106.8 |
107.1 |
0.3% |
10.8% |
117.1 |
117.4 |
0.3% |
9.6% |
|
Gross profit |
93.8 |
94.3 |
0.5% |
16.9% |
103.6 |
103.9 |
0.3% |
10.2% |
113.6 |
113.9 |
0.3% |
9.6% |
|
Gross margin |
97.5% |
97.6% |
0.1% |
0.0% |
97.0% |
97.0% |
0.0% |
-0.6% |
97.0% |
97.0% |
0.0% |
0.0% |
|
Adjusted EBITDA |
30.6 |
30.6 |
0.0% |
18.5% |
35.8 |
35.8 |
0.0% |
17.1% |
40.5 |
40.5 |
0.0% |
13.1% |
|
Adjusted EBITDA margin |
31.8% |
31.6% |
-0.5% |
0.5% |
33.5% |
33.4% |
-0.3% |
1.8% |
34.6% |
34.5% |
-0.3% |
1.1% |
|
Normalised operating profit |
23.8 |
23.8 |
-0.1% |
16.7% |
27.8 |
27.9 |
0.0% |
16.9% |
31.6 |
31.7 |
0.0% |
13.6% |
|
Normalised operating margin |
24.8% |
24.7% |
-0.1% |
0.0% |
26.1% |
26.0% |
-0.1% |
1.3% |
27.0% |
27.0% |
-0.1% |
1.0% |
|
Reported operating profit |
14.3 |
5.8 |
-59.3% |
-40.0% |
18.6 |
18.9 |
1.5% |
224.5% |
23.1 |
23.2 |
0.0% |
22.4% |
|
Reported operating margin |
14.9% |
6.0% |
-8.9% |
-5.7% |
17.5% |
17.7% |
0.2% |
11.6% |
19.8% |
19.7% |
0.0% |
2.1% |
|
Normalised PBT |
26.5 |
26.9 |
1.5% |
21.8% |
30.5 |
30.9 |
1.4% |
15.0% |
34.3 |
34.7 |
1.2% |
12.3% |
|
Reported PBT |
17.0 |
5.6 |
-67.0% |
-50.9% |
21.3 |
22.0 |
3.3% |
292.5% |
25.8 |
26.2 |
1.6% |
19.3% |
|
Normalised net income |
20.9 |
21.2 |
1.5% |
21.8% |
24.1 |
24.4 |
1.4% |
15.0% |
27.1 |
27.4 |
1.2% |
12.3% |
|
Reported net income |
13.9 |
5.3 |
-62.0% |
-47.6% |
16.8 |
17.4 |
3.3% |
228.3% |
20.4 |
20.7 |
1.6% |
19.3% |
|
Normalised basic EPS ($) |
0.070 |
0.071 |
1.5% |
21.6% |
0.080 |
0.081 |
1.4% |
13.8% |
0.089 |
0.090 |
1.2% |
11.2% |
|
Normalised diluted EPS ($) |
0.067 |
0.068 |
1.5% |
21.6% |
0.076 |
0.077 |
1.4% |
13.9% |
0.085 |
0.086 |
1.2% |
11.2% |
|
Reported basic EPS ($) |
0.047 |
0.018 |
-62.0% |
-47.7% |
0.056 |
0.058 |
3.3% |
225.0% |
0.067 |
0.068 |
1.6% |
18.1% |
|
Net debt/(cash) excluding restricted cash |
(178.3) |
(164.5) |
-7.7% |
40.2% |
(213.7) |
(200.1) |
-6.3% |
21.7% |
(252.1) |
(238.8) |
-5.3% |
19.3% |
|
Net debt/(cash) |
(199.4) |
(198.0) |
-0.7% |
31.2% |
(234.8) |
(233.6) |
-0.5% |
18.0% |
(273.2) |
(272.3) |
-0.3% |
16.6% |
|
TPV ($bn) |
11.94 |
11.96 |
0.1% |
13.7% |
13.07 |
13.09 |
0.1% |
9.5% |
14.18 |
14.20 |
0.1% |
8.5% |
|
Take rate |
0.81% |
0.81% |
0.00% |
0.02% |
0.82% |
0.82% |
0.00% |
0.01% |
0.83% |
0.83% |
0.00% |
0.01% |
Source: Edison Investment Research
Exhibit 5: Financial summary
$m |
2019 |
2020 |
2021 |
2022 |
2023 |
2024e |
2025e |
2026e |
||
31-December |
IFRS |
IFRS |
IFRS |
IFRS |
IFRS |
IFRS |
IFRS |
IFRS |
||
INCOME STATEMENT |
||||||||||
Revenue |
|
|
50.1 |
56.4 |
62.1 |
63.8 |
82.7 |
96.6 |
107.1 |
117.4 |
Cost of Sales |
(5.6) |
(4.9) |
(1.6) |
(1.8) |
(2.1) |
(2.4) |
(3.2) |
(3.5) |
||
Gross Profit |
44.6 |
51.5 |
60.5 |
62.0 |
80.7 |
94.3 |
103.9 |
113.9 |
||
Adjusted EBITDA |
|
|
10.7 |
15.3 |
22.9 |
20.2 |
25.8 |
30.6 |
35.8 |
40.5 |
Normalised operating profit |
|
|
4.5 |
11.6 |
18.6 |
15.8 |
20.4 |
23.8 |
27.9 |
31.7 |
Amortisation of acquired intangibles |
(1.6) |
(2.2) |
(1.9) |
(1.0) |
(2.2) |
(2.2) |
(1.3) |
(0.9) |
||
Exceptionals |
(0.3) |
(21.1) |
0.4 |
(1.6) |
(0.9) |
(5.0) |
0.0 |
0.0 |
||
Share-based payments |
(6.8) |
(4.9) |
(6.4) |
(5.2) |
(7.6) |
(10.8) |
(7.6) |
(7.6) |
||
Reported operating profit |
(4.1) |
(16.7) |
10.6 |
8.0 |
9.7 |
5.8 |
18.9 |
23.2 |
||
Net Interest |
(0.4) |
(0.6) |
(0.7) |
(0.5) |
1.6 |
3.0 |
3.0 |
3.0 |
||
Joint ventures & associates (post tax) |
0.0 |
0.0 |
0.0 |
0.0 |
0.0 |
0.0 |
0.0 |
0.0 |
||
Exceptionals |
0.0 |
0.0 |
0.0 |
(3.5) |
0.1 |
(3.3) |
0.0 |
0.0 |
||
Profit Before Tax (norm) |
|
|
4.1 |
11.0 |
17.8 |
15.3 |
22.1 |
26.9 |
30.9 |
34.7 |
Profit Before Tax (reported) |
|
|
(1.3) |
(17.3) |
9.9 |
4.1 |
11.4 |
5.6 |
22.0 |
26.2 |
Reported tax |
1.7 |
(1.5) |
1.9 |
0.2 |
(1.3) |
(0.3) |
(4.6) |
(5.5) |
||
Profit After Tax (norm) |
3.2 |
8.8 |
14.3 |
12.2 |
17.4 |
21.2 |
24.4 |
27.4 |
||
Profit After Tax (reported) |
0.4 |
(18.8) |
11.8 |
4.3 |
10.1 |
5.3 |
17.4 |
20.7 |
||
Minority interests |
0.0 |
0.0 |
0.0 |
0.0 |
0.0 |
0.0 |
0.0 |
0.0 |
||
Discontinued operations |
0.0 |
0.0 |
(5.5) |
24.6 |
0.0 |
0.0 |
0.0 |
0.0 |
||
Net income (normalised) |
3.2 |
8.8 |
14.3 |
12.2 |
17.4 |
21.2 |
24.4 |
27.4 |
||
Net income (reported) |
0.4 |
(18.8) |
6.3 |
28.9 |
10.1 |
5.3 |
17.4 |
20.7 |
||
Basic ave. number of shares outstanding (m) |
246.8 |
273.8 |
294.0 |
298.3 |
297.9 |
298.6 |
301.6 |
304.6 |
||
EPS - basic normalised ($) |
|
|
0.01 |
0.03 |
0.05 |
0.04 |
0.06 |
0.07 |
0.08 |
0.09 |
EPS - diluted normalised ($) |
|
|
0.01 |
0.03 |
0.05 |
0.04 |
0.06 |
0.07 |
0.08 |
0.09 |
EPS - basic reported ($) |
|
|
0.00 |
(0.07) |
0.02 |
0.10 |
0.03 |
0.02 |
0.06 |
0.07 |
Dividend ($) |
0.00 |
0.00 |
0.00 |
0.00 |
0.00 |
0.00 |
0.00 |
0.00 |
||
Revenue growth (%) |
42.2 |
12.5 |
10.1 |
2.7 |
29.7 |
16.8 |
10.8 |
9.6 |
||
Gross Margin (%) |
88.9 |
91.3 |
97.5 |
97.2 |
97.5 |
97.6 |
97.0 |
97.0 |
||
EBITDA Margin (%) |
21.3 |
27.1 |
36.9 |
31.7 |
31.2 |
31.6 |
33.4 |
34.5 |
||
Normalised Operating Margin |
9.0 |
20.5 |
30.0 |
24.7 |
24.7 |
24.7 |
26.0 |
27.0 |
||
BALANCE SHEET |
||||||||||
Fixed Assets |
|
|
52.2 |
69.8 |
84.4 |
77.2 |
77.3 |
77.8 |
77.5 |
77.1 |
Intangible Assets |
46.8 |
65.6 |
63.1 |
56.2 |
56.6 |
57.2 |
56.9 |
56.4 |
||
Tangible Assets |
3.5 |
3.8 |
5.3 |
3.9 |
3.5 |
3.4 |
3.4 |
3.5 |
||
Investments & other |
1.8 |
0.5 |
16.0 |
17.0 |
17.1 |
17.1 |
17.1 |
17.1 |
||
Current Assets |
|
|
89.2 |
155.2 |
145.3 |
212.8 |
299.5 |
348.6 |
403.9 |
460.5 |
Stocks |
0.0 |
0.0 |
0.0 |
0.0 |
0.0 |
0.0 |
0.0 |
0.0 |
||
Debtors |
53.6 |
92.5 |
82.9 |
90.5 |
148.5 |
150.5 |
170.1 |
188.0 |
||
Cash & cash equivalents |
34.7 |
61.3 |
56.7 |
99.6 |
117.4 |
164.5 |
200.1 |
238.8 |
||
Other |
0.9 |
1.4 |
5.8 |
22.8 |
33.6 |
33.6 |
33.6 |
33.6 |
||
Current Liabilities |
|
|
(81.8) |
(139.7) |
(122.1) |
(157.8) |
(234.9) |
(263.8) |
(293.8) |
(321.7) |
Creditors |
(78.0) |
(136.8) |
(119.6) |
(156.3) |
(233.0) |
(261.9) |
(291.9) |
(319.8) |
||
Tax and social security |
0.0 |
0.0 |
0.0 |
(0.2) |
(0.5) |
(0.5) |
(0.5) |
(0.5) |
||
Short term borrowings |
(2.1) |
(1.4) |
(1.1) |
0.0 |
0.0 |
0.0 |
0.0 |
0.0 |
||
Other |
(1.7) |
(1.4) |
(1.3) |
(1.3) |
(1.4) |
(1.4) |
(1.4) |
(1.4) |
||
Long Term Liabilities |
|
|
(2.6) |
(13.6) |
(12.3) |
(8.7) |
(8.4) |
(8.4) |
(8.4) |
(8.4) |
Long term borrowings |
0.0 |
(10.8) |
(6.7) |
0.0 |
0.0 |
0.0 |
0.0 |
0.0 |
||
Other long term liabilities |
(2.6) |
(2.8) |
(5.7) |
(8.7) |
(8.4) |
(8.4) |
(8.4) |
(8.4) |
||
Net Assets |
|
|
57.0 |
71.8 |
95.3 |
123.6 |
133.5 |
154.3 |
179.2 |
207.5 |
Minority interests |
0.0 |
0.0 |
0.0 |
0.0 |
0.0 |
0.0 |
0.0 |
0.0 |
||
Shareholders' equity |
|
|
57.0 |
71.8 |
95.3 |
123.6 |
133.5 |
154.3 |
179.2 |
207.5 |
CASH FLOW |
||||||||||
Op Cash Flow before WC and tax |
7.4 |
15.3 |
22.9 |
20.2 |
25.8 |
30.6 |
35.8 |
40.5 |
||
Working capital |
3.0 |
20.1 |
(7.1) |
27.9 |
17.9 |
26.9 |
10.4 |
10.0 |
||
Exceptional & other |
(1.3) |
(3.8) |
(3.5) |
1.8 |
(2.7) |
(5.0) |
0.0 |
0.0 |
||
Tax |
(0.1) |
(0.3) |
(0.4) |
(0.3) |
(0.3) |
(0.3) |
(4.6) |
(5.5) |
||
Net operating cash flow |
|
|
9.0 |
31.3 |
11.9 |
49.7 |
40.6 |
52.1 |
41.6 |
45.0 |
Capex |
(2.1) |
(3.4) |
(5.8) |
(5.3) |
(5.9) |
(8.1) |
(7.7) |
(8.1) |
||
Acquisitions/disposals |
(0.7) |
(36.6) |
0.0 |
26.5 |
5.6 |
0.0 |
0.0 |
0.0 |
||
Net interest |
(0.4) |
(1.0) |
(0.6) |
(0.2) |
1.6 |
3.0 |
3.0 |
3.0 |
||
Equity financing |
0.6 |
26.2 |
1.1 |
(1.4) |
(7.1) |
1.4 |
0.0 |
0.0 |
||
Dividends |
0.0 |
0.0 |
0.0 |
0.0 |
0.0 |
0.0 |
0.0 |
0.0 |
||
Other |
(1.5) |
(2.6) |
(6.1) |
(12.7) |
(18.0) |
(1.3) |
(1.3) |
(1.3) |
||
Net Cash Flow |
4.857 |
13.8 |
0.5 |
56.6 |
16.9 |
47.1 |
35.6 |
38.7 |
||
Opening net debt/(cash) |
|
|
(28.9) |
(32.6) |
(49.0) |
(48.8) |
(99.6) |
(117.4) |
(164.5) |
(200.1) |
FX |
(1.1) |
1.3 |
(0.6) |
(5.6) |
0.9 |
0.0 |
0.0 |
0.0 |
||
Other non-cash movements |
(0.0) |
1.2 |
(0.1) |
(0.3) |
0.0 |
0.0 |
0.0 |
0.0 |
||
Closing net debt/(cash)* |
|
|
(32.6) |
(49.0) |
(48.8) |
(99.6) |
(117.4) |
(164.5) |
(200.1) |
(238.8) |
Source: Boku, Edison Investment Research *Net cash excluding restricted cash
|
|
Research: Metals & Mining
Metals One is a junior metals explorer with assets in Finland and Norway. After listing on the London Stock Exchange last year, it has moved quickly to double the resource at its Black-Schist project in Finland, on which it is now completing a preliminary economic assessment (PEA) by the year’s end. We calculate that the existing resource is currently capable of supporting a low capex, low opex bio-heap leach mine (akin to its neighbour Terrafame) to produce c 14,000tpa nickel sulphate for the EV battery market over c 20 years and could be in production as early as 2030 at a carbon intensity of 1.75t CO2 equivalent per tonne of nickel sulphate (cf c 40–90t/t Ni for nickel pig iron, c 40t/t Ni for HPAL and <10t/t Ni for traditional nickel sulphide processing routes).