Globalworth Real Estate Investments
Globalworth Real Estate Investments |
Developing well |
Reviewing progress |
Real estate |
8 August 2016 |
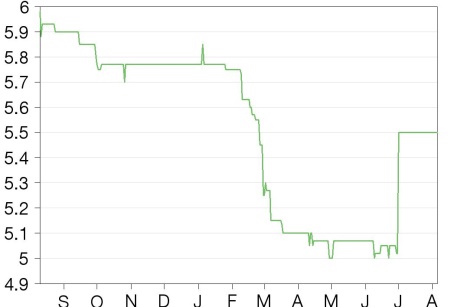
Share price performance
Business description
Next events
Analysts
Globalworth Real Estate Investments is a research client of Edison Investment Research Limited |
|||||||||||||||||||||||||||||||||||||||||||||||||||
Globalworth Real Estate Investments (GWI) made strategic and financial progress in FY15. The portfolio grew strongly through acquisitions and development progress, with construction of the flagship Globalworth Tower completed by year-end and the property delivered in Q116. NOI and cash flow both increased significantly and we forecast further strong growth as acquisitions fully contribute and remaining developments complete. EPRA NAV per share grew 12.2% during the year despite share issuance and the pro forma year-end LTV was 44.3% (43.5% reported for Q116). Meanwhile the Romanian economy and the Bucharest commercial real estate market remain supportive. Against this backdrop and our forecasts for growing cash flow, the failure of the NAV discount to narrow seems unwarranted.
Year |
NOI* |
PBT** |
EPS** |
EPRA NAV/ share (€) |
DPS |
P/NAV |
Yield |
12/14 |
12.9 |
(9.4) |
(21.0) |
8.09 |
0.0 |
0.68 |
N/A |
12/15 |
28.4 |
(4.0) |
(7.6) |
9.08 |
0.0 |
0.61 |
N/A |
12/16e |
40.7 |
4.9 |
7.7 |
9.39 |
10.0 |
0.59 |
1.8 |
12/17e |
60.0 |
25.2 |
39.0 |
9.82 |
20.0 |
0.56 |
3.6 |
12/18e |
68.7 |
33.3 |
51.5 |
10.21 |
30.0 |
0.54 |
5.5 |
Note: *NOI is net operating income. **PBT and EPS are normalised, excluding valuation movements, bargain purchase gains, and share-based payments.
Maturing portfolio creating cash flow and NAV growth
Four let properties were added in FY15, and together with capex and revaluation gains the portfolio value reached €931m (FY14: €599m). Portfolio progress is the key to delivering the growing cash flows that we forecast for FY16-18. Including the newly completed Globalworth Tower, there are now 11 standing let assets with an average occupancy of 82.2% and a contracted rent roll of €43.7m. Further potential comes from occupancy improvement and development completions. Globalworth Campus is the main ongoing development with an NOI potential of c €15m. The maturing portfolio and increasing free cash flow support our assumption that GWI will soon commence dividend distributions.
Healthy economy and supportive market dynamics
Romania has the second-fastest growing EU economy behind Ireland. With little impact from the Ukrainian crisis and Russian recession, the IMF forecasts GDP to grow by 4.2% in 2016 after 3.7% in 2015. Demand for quality, modern commercial property continued to exceed new supply in 2015 and while valuation yields have tightened they remain well ahead of those in more established CEE capitals.
Valuation: Widening discount with cash flow building
The shares are trading at a c 46% discount to our 2018e EPRA NAV per share of €10.2. With cash flow building, we anticipate that dividends may commence and forecast a 2018e yield of 5.5%. Further tightening in valuation yields would be an additional positive not included in our estimates, and we explore the sensitivity on page 12.
Investment summary: Developing well
FY15 showed a continuation of the rapid operational and financial progress that GWI has made since it first listed on the AIM market of the London Stock Exchange in July 2013. In 2015 GWI continued to build its portfolio and was one of the most active real estate investors in Romania. It now has a portfolio of 15 assets, a mix of completed, income-generating assets (11), development projects (two) and land plots (two), with an externally appraised value of €931m (2014: €599m) at 31 December 2015 (€19m higher at 31 March 2016 due to capex with no revaluation undertaken). Assuming full completion of current and intended development projects the value was €1,084m at 31 December (2014: €890m). Significant progress on financing was made in 2015 and the early months of 2016, including new debt and equity, with an LTV of 43.5% as at 31 March 2016. Importantly, the technically challenging flagship development Globalworth Tower was completed and delivered in Q116, substantially (59.5% at the end of Q1) pre-let. The completion of Globalworth Tower increased the share of income-producing properties in the portfolio from 74.7% at 31 December 2015 to 89.6%, which represents a significant de-risking of the portfolio. As acquisitions begin to fully contribute to income and developments complete, GWI should be able to generate strongly growing cash flows that can support shareholder distributions. There is good potential for NAV to benefit from a convergence of property yields towards those seen in more established CEE capitals.
Financials: Cash flow and NAV growth
Net operating income (NOI) increased by 120% to €28.4m in FY15, driven by the acquisition of yielding properties. In Q116 it continued to increase, reaching €6.5m. Administrative and acquisition costs fell and, despite higher finance expense (more debt to fund the growing portfolio and the relatively high cost of short-term financing), the PBT loss, excluding revaluation and bargain purchase gains, decreased to €4.0m from €9.4m in Q115. Operating cash flow turned to a small positive. Our forecasts show NOI continuing to grow strongly during FY16-18 as the recent acquisitions fully contribute to income and as developments complete and are let. This forms the basis for potentially strong growing free cash flow that would support distributions to shareholders. EPRA net assets grew 31% in FY15 and after share issuance (€54m raised at €6 per share) by 12% in per share terms. We expect further growth in NAV but have only included development gains reflected in the external valuation.
Valuation: Growing cash flow and NAV
GWI has indicated an intention to pay out up to 90% of available free cash. We estimate operating cash flow after financing costs will increase to 51.9 cents per share in FY18, with development spending on current projects complete, and that this may support an FY18 DPS of 30 cents per share (a c 60% pay-out), equivalent to a 5.5% yield on the current share price. The shares are trading at a substantial discount (c 46%) to a growing NAV, with potential additional benefit (not included in our estimates) from yield convergence on more established markets like Warsaw and Prague, where yields have declined to c 5.75% from 6% a year ago. We show a sensitivity analysis on page 12.
Sensitivities: Business risks reducing as portfolio matures
In addition to the usual development risks and funding risks, we highlight on page 12 the significant role played by GWI’s founder and major shareholder, as well as Romania’s reputation for weak political and business transparency. Risks include:
■
Key individual risk, mitigated by GWI’s growing team of more than 65 property professionals.
■
Property development risk, substantially reduced by completion of the Globalworth Tower.
■
Funding risks, mitigated by the recent refinancing of expensive short-term debt facilities.
Solid platform for growth
GWI is a real estate investment company that focuses on property investment opportunities in South-Eastern Europe and Central and Eastern Europe, but primarily in Romania, where all of the current assets are located and where it is one of leading players in the commercial real estate market. It was incorporated in Guernsey in July 2013 and listed on the London AIM market in July 2013. With 65 property professionals on the ground in Romania, GWI operates as a fully integrated real estate investment company. Its investment strategy seeks a balance of yield and capital appreciation based on:
■
high-quality, well-located assets, existing or to be developed, capable of providing current or expected high cash flow generation capacity from creditworthy tenants (multinationals and large local corporates) on long-term, triple net, annually indexed, euro-denominated leases.
■
Identifying underperforming and undervalued properties that can be repositioned into performing and marketable assets through intensive asset management.
By managing a portfolio of existing and development assets, GWI can provide turnkey commercial real estate solutions for its clients, helping them to manage their requirements over time as their own businesses develop and grow.
In 2015 GWI continued to build its portfolio and was one of the most active real estate investors in Romania. It now has a portfolio of 15 assets, a mix of completed, income-generating assets, development projects and land plots with an externally appraised value of €931m (2014: €599m) at 31 December 2015 (€19m higher at 31 March 2016 due to capex with no revaluation undertaken). Assuming full completion of current and intended development projects, the value was €1,084m at 31 December (2014: €890m).
Portfolio overview
From listing in 2013, GWI moved quickly to assemble its initial portfolio, which at the end of 2014 had reached 11 assets, of which six were standing let assets. During 2015 portfolio growth continued, with four new assets acquired, all standing and let, while two additional pre-let extensions were internally developed and delivered. Total assets at the end of 2015 were 15, of which 10 were standing assets, three were assets are under development and two were land assets for future development. In Exhibit 1 below we show the flagship Globalworth Tower development as completed, reflecting its delivery in Q116.
During the year GWI invested €244m in growing the portfolio, c €70m in capex on development projects (including TAP, Globalworth Tower, Globalworth Campus, and Gara Herastrau) and the balance on acquisitions (UniCredit HQ, Nusco Tower, Green Court A and Green Court B).
The highest concentration of the portfolio is in Bucharest, and particularly within the new central business district (CBD). Of the 15 assets in the portfolio, nine are located in the new CBD, which is located in the northern part of Bucharest, and benefits from its connectivity and infrastructure (metro, road, bus and tram services, and close proximity to both Bucharest airports). The Bucharest portfolio also includes TCI, a landmark asset in the historical CBD, for which we believe it would now be impossible to obtain planning consent (due to both restrictions on height and building intensity), UniCredit HQ (a landmark tower leased to UniCredit on a long-term basis) and City Offices, a recently refurbished office building with good transport links, two metro stops south of the city centre. Outside of Bucharest, GWI owns the TAP light industrial park in Timisoara, one of the country’s principal peripheral industrial hubs. TAP was extended to accommodate existing tenants in 2015 and is undergoing similar additional extension.
Exhibit 1: Current portfolio (€m), using 31 December 2015 valuations
Property |
Status |
Investment cost |
Carried value |
Capex to completion |
Valuation uplift |
Estimated completion value |
BOB |
Completed |
42.0 |
51.6 |
0.0 |
51.6 |
|
BOC |
Completed |
110.0 |
144.0 |
0.0 |
144.0 |
|
TCI |
Completed |
58.0 |
76.5 |
0.0 |
76.5 |
|
City Offices |
Completed |
51.0 |
62.1 |
0.0 |
62.1 |
|
Upground Towers |
Completed |
58.0 |
107.3 |
0.0 |
107.3 |
|
UniCredit HQ |
Completed |
42.6 |
52.6 |
0.0 |
52.6 |
|
Nusco Tower |
Completed |
44.9 |
57.7 |
0.0 |
57.7 |
|
Green Court "A" |
Completed |
41.3 |
50.1 |
0.0 |
50.1 |
|
Green Court "B" |
Completed |
44.5 |
50.2 |
0.0 |
50.2 |
|
TAP |
Completed/part dev. |
37.0 |
44.7 |
10.2 |
4.3 |
59.2 |
Globalworth Tower |
Completed* |
79.8 |
139.5 |
15.0 |
0.6 |
155.1 |
Globalworth Campus |
Development |
26.2 |
57.6 |
98.8 |
16.5 |
172.9 |
Gara Herastrau |
Development |
8.3 |
19.0 |
7.3 |
0.0 |
26.3 |
Land |
Land |
13.3 |
18.2 |
0.0 |
18.2 |
|
Total portfolio |
656.9 |
931.1 |
131.3 |
21.4 |
1,083.8 |
Source: Globalworth Real Estate Investments, valuation data prepared by CBAR Research and Valuation Advisors, Edison Investment Research. Note: Valuations as at 31 December 2015. *Globalworth Tower completed as at Q116.
The tenant mix is diversified, with more than 85 different multinational and national tenants from more than 15 different countries. At the end of 2015, 88.9% of leases were with multinational tenants, 5.5% with mostly large national tenants and 5.6% with local state-owned enterprises. Leases are on a triple net basis, which means the tenant covers local tax, insurance and maintenance expenses, denominated in euros and index-linked on an annual basis to European inflation.
The weighted average lease length (WALL) on commercial lease space at 31 December 2015 was 6.9 years. The WALL for the majority of commercial leases signed over the past 18 months or so has been above eight years, in line with management’s “longer lease” policy which, as well as providing security of income to GWI, can also appeal to relocating multinationals, which in some cases may find it easier to access subsidies when their application is supported by a longer lease, an explicit sign of their commitment to the country.
Standing properties
There were 10 standing let properties, fully owned by GWI at 31 December 2015, while Globalworth Tower was completed and delivered by the end of Q116. Including Globalworth Tower, these properties represent €836.3m of the €931.1m property valuation at year end, covering c 410,000sqm of gross lettable area (GLA). All the properties are located in Bucharest, with the exception of the TAP logistics park in Timisoara, and all are modern or have been completed or refurbished since 2008. Globalworth Tower is GWI’s flagship development project in the heart of the new CBD. It was completed on schedule at the end of 2015 and was delivered for operation at the end of Q116. At completion, 51% of the c 55,000sqm GLA was pre-let, and in May 2016 occupancy had increased to 66.7%.
In addition to the Bucharest office properties, there is one residential complex, Upground Towers, a modern, two-tower residential complex with 435 apartments, well situated in close proximity to the CBD office properties. Leased apartments at Upground Towers generate NOI of c €1.5m, but as the residential market continues to gradually improve, GWI has continued to sell surplus apartments (12 in 2015 at an average €129k).
Development projects and land
Following the delivery of Globalworth Tower, the main current development project is the two-phase Globalworth Campus project, which on completion will offer three Class “A” office towers with a total c 89,000sqm GLA, with an estimated value at completion of €172.9m. Phase A comprises two towers of c 57,000 GLA and Phase B is the third, central, tower. Construction of the core of tower 1 has been finished and the shell is nearly complete. In addition, the excavations and ground preparation for Tower 2 are complete. Tower 1 is scheduled for completion in Q416 and Tower 2 in Q217.
On a smaller scale, Gara Herastrau is a c 12,000sqm GLA Class “A” office development located in the northern part of Bucharest, with an estimated value at completion of €26.3m. It is adjacent to Green Court Building A and c 200 metres from the Nusco Tower and Bucharest One. The building is now complete and the first tenants moved in in June; as at May 2016 it was 50.6% pre-let (NOI c €1.0m).
The light industrial complex at Timisoara (TAP) has been developed in phases and in 2015 added c 55,000sqm of space to take the total to c 81,000sqm, let to Valeo, Continental, and Elster (part of Honeywell Group). Valeo has exercised the option to expand further and c15,000sqm are currently being built for the company. Elster and Continental each have options to expand further too, possibly taking TAP to c 124,000sqm, which GWI believes would represent one of the largest logistics parks in the country. GWI expects the options to be exercised in the next two years and for the additional space to be delivered at an investment cost of €10.2m.
Two land plots in prime locations (Luterana Street and Herastrau), carried at a value of €18.2m, are undergoing planning and permitting work. Luterana in particular presents a scarce opportunity for an office development, given its large size and location in the centre of Bucharest.
Romania: Growing occupier market and attractive investment yield
The commercial real estate environment in Romania remains supportive. With 3.7% GDP growth in 2015, the second-highest in the EU after Ireland, and the IMF estimating 4.2% growth in 2016, the Romanian economy continues to be one of the fastest growing in Europe. Future growth is underpinned by the availability of European funding and the current, second phase of funding, running from 2014-20, has approved €43bn of funding over the period.
The Romanian real estate investment market is active with 2015 volume at an estimated €800m, although a little lower than the post financial crisis peak of c €1.1bn in 2014. The first half of 2016 saw growth of 80% compared with the same period in 2015, rising to an estimated €340m (source: JLL). In part, this was buoyed by one of the first significant transactions outside of Bucharest, being NEPI’s acquisition of a regional shopping centre for €100m.
The main commercial property market in Bucharest is experiencing positive demand and supply fundamentals with an estimated 65,000sqm of new space entering the market in 2015 compared with uptake estimated at 240,000sqm (source: Colliers). Prime office rents are stable and are expected to remain so, while vacancy has been falling and is very much lower than the Bucharest average figure shown in Exhibit 2 in the popular central business areas targeted by GWI. GWI estimates prime office vacancy of c 5% in these areas. Demand for prime office space is being driven by companies in the information technology and communications, services, and consumer goods sectors, and GWI reports a number of multinationals consolidating their positions and expanding their operations in the market. It has experienced this trend first hand when signing leases with Deutsche Bank, Vodafone, Honeywell and ADP over the past 12 months. Bucharest offers a well-educated and relatively inexpensive workforce while prime rents are the lowest in Eastern Europe.
Exhibit 2: Bucharest office market evolution (sqm)
2009 |
2010 |
2011 |
2012 |
2013 |
2014 |
2015 |
|
Stock |
1,190,000 |
1,360,000 |
1,478,000 |
1,540,000 |
1,656,000 |
1,770,000 |
1,835,000 |
Change in stock |
170,000 |
118,000 |
62,000 |
116,000 |
114,000 |
65,000 |
|
Total take-up |
90,000 |
177,000 |
183,000 |
168,000 |
250,000 |
296,000 |
240,000 |
Net take-up |
90,000 |
116,000 |
115,000 |
80,000 |
100,000 |
140,000 |
113,000 |
Vacancy rate |
18.0% |
18.5% |
16.5% |
18.5% |
18.0% |
14.3% |
14.0% |
Source: Colliers International
New supply is expected to increase in 2016 (Colliers reports that developers plan to build 360,000sqm, including c 95,000sqm developed by Globalworth), but demand is also expected to remain strong and around half of the new space is estimated to be pre-let. GWI does not expect any impact on rents or overall vacancy from the 2016 deliveries as some c 75% is either pre-let or under active negotiation between the respective landlords and potential tenants.
Prime yields contracted during 2015, from 7.75% to 7.5% for prime offices, and from 9.75% to 9.0% for logistics properties. However, prime yields in Romania continue to be higher than most other markets in CEE, making the possibility of valuation gains driven by yield compression a real possibility. Indeed, GWI management believes that global investor capital flows will gradually move from markets considered “safe havens” to more peripheral markets like Romania in search of higher yielding investments, and that GWI should benefit from an early mover advantage.
|
Exhibit 3: Regional prime office yields |
|
|
Source: Globalworth Real Estate Investments FY15 annual report |
Management
GWI was founded by Ioannis Papalekas, who is the CEO and main shareholder with a holding of 36%. He has approaching 20 years of real estate experience, of which 15 years has been gained in Romania. The founder is supported by an experienced senior management team, including:
■
Deputy CEO and CIO Dimitris Raptis, who has 20 years’ experience in financial services and real estate, mostly with Deutsche Bank RREEF, with a focus on real estate investment, particularly in Southern Europe.
■
Deputy CIO Stan Andre, who has seven prior years’ experience in financial services, with a focus on capital markets, EM and structured financings, mostly with UBS.
■
Deputy CIO Stamatis Sapkas, who has 10 years’ experience in real estate, most of which was with Citigroup’s Real Estate and Lodging investment banking team.
■
CFO Andreas Papadopoulos, who has 23 years’ experience in corporate finance, audit and accounting, mostly with Ernst & Young, in several Central and South-East European countries, including Romania.COO Adrian Danoiu, who has more than 20 years’ experience in accounting, finance and business administration, and has worked with Mr Papalekas since 2002.
During his 15 years of operating in the Romanian commercial real estate market, the founder has built up a strong track record. This is detailed in the GWI admission document (link) and summarised in our previous research. Before founding GWI he was responsible for the development of more than 400,000sqm of commercial space and 1,000 residential units, investing more than €70m of proprietary and third-party capital. The combined realised IRR was 175%, generating total capital gains of €270m, with distributions to investors at 4.7x. Excluded from this realised return are unrealised projects in Romania and other South-East Europe countries (including interests in two hotels in Sofia and Belgrade).
Overall, GWI has built a team of more than 65 real estate professionals. All are based in Bucharest, which we believe is advantageous to the company’s operations, allowing closer relationships with existing and prospective tenants and a better understanding of the local market. In addition to the investment and strategic functions of the group undertaken by the six-strong senior management team and the necessary administration, finance and accounting and IT infrastructure (26 members in aggregate), GWI also has internal teams in the areas of project management (five), asset and facilities management (13), commercial sales & leasing (six) and legal (two members).
The board of directors has a majority of non-executive directors and comprises the non-executive chairman (Geoff Miller), two executive directors and five additional non-executive directors. Brief biographies of key board members are shown on page 14.
Financials
Brief summary of recent financials
We give a brief overview of the financial developments in FY15 along with some key updates from the unaudited Q116 release.
■
FY15 saw significant growth in the property portfolio, from €599.2m to €931.1m. Capex and development progress saw the portfolio value increase to €950.1m in Q116. No general revaluation was undertaken in the quarter.
■
Four rented properties were acquired in FY15 and the overall portfolio saw a fair value uplift of €49.4m. Bargain purchase gains amounted to €17.2m.
■
NOI increased by 120% to €28.4m, driven by the acquisition of yielding properties. EBITDA (excluding revaluation and bargain purchase gains) was €16.7m (FY14: €1.7m loss). In Q116, NOI increased further to €6.5m compared with €4.7m, primarily reflecting the increased contribution from acquisitions.
■
Administrative and acquisition costs fell 20%, or by €2.9m, in FY15, but net finance costs increased by €12.9m, reflecting higher average debt (to finance acquisitions and development) and the relatively high cost of the (€100m) short-term financing facility that has been refinanced in Q216. The PBT loss, excluding revaluation and bargain purchase gains, reduced from €9.4m to €4.0m in FY15 and has developed positively in Q116 in line with our forecast profit for the year.
■
EPRA net assets grew by 31% to €568.3m including €53.8m of additional equity raised at €6 per share, a premium to the then share price. Adjusting for the new shares, EPRA NAV per share increased by 12% to €9.08 per share and was at a similar unaudited level at the end of Q116.
■
FY15 operating cash flow after financing costs improved significantly from a negative €32.3m (71.7 cents per share) to a positive €3.0m (5.4 cents per share). Investment in building the portfolio continues with capex and development spend of €69.7m and an acquisition spend of €114.4m net of cash acquired. Net debt increased by €184.2m including c €50m assumed on acquisition, and was €367.3m at year end (net of €37.0m of cash). The loan to value ratio was 43.9% at 31 December 2015 and 43.5% at 31 March 2016 (31 December 2014: 34.4%).
■
Among a number of smaller debt refinancings and new loan arrangements during FY15, in March and June 2015 GWI entered into an aggregate €100m short-term corporate-level debt facility with York Advisers and Oak Hill Capital. The cost of the facility was high, but it provided financial headroom for the company to continue its acquisition and development strategy while arranging additional equity (€54m was raised in October 2015) and more permanent debt financing at the end of May 2016 when GWI issued €180m of three-year bonds, fully subscribed by the Canada Pension Plan Investment Board (CPPIB, €150m) and funds managed by Cairn Capital (€30m). We believe the substantial investment by an investor such as CPPIB is an endorsement of the company and the market it operates in. We estimate the cost of the bond to be c 7% pa with the proceeds used to repay the short-term corporate-level facility and to repay some existing facilities of property owning subsidiaries. The corporate-level facility was repaid in early June with €6m of the consideration due settled in new GWI shares at €6 per share.
Estimate revisions
In FY15, underlying EBITDA (that is excluding fair value movements and bargain purchase gains) was c €1.3m ahead of our estimate, primarily explained by lower than forecast expenses. However, the refinancing of the relatively expensive short-term corporate loan took longer than we had allowed for and finance expenses were c €2.3m higher than we had allowed for. Our estimate of the normalised PBT loss was c €1.0m less than the c €4.0m outturn. EPRA NAV per share exceeded our forecasts due to higher property revaluation gains than we had allowed for, largely the result of faster recognition of valuation uplifts on development properties in the external property valuation.
Exhibit 4: Performance versus forecast and estimate revisions
NOI* (€m) |
PBT** (€m) |
EPS** (c) |
EPRA NAV per share (€) |
DPS (c) |
|||||||||||
Actual |
Estimate |
% diff. |
Actual |
Estimate |
% diff. |
Actual |
Estimate |
% diff. |
Actual |
Estimate |
% diff. |
Actual |
Estimate |
% diff. |
|
2015 |
28.4 |
28.1 |
1% |
(4.0) |
(3.0) |
35% |
(7.6) |
(5.3) |
44% |
9.08 |
8.87 |
2% |
0.0 |
1.5 |
-100% |
New |
Old |
% chg. |
New |
Old |
% chg. |
New |
Old |
% chg. |
New |
Old |
% chg. |
New |
Old |
% chg. |
|
2016e |
40.7 |
37.9 |
7% |
4.9 |
7.2 |
-31% |
7.7 |
13.3 |
-42% |
9.39 |
-10% |
10.0 |
10.0 |
0% |
|
2017e |
60.0 |
60.4 |
-1% |
25.2 |
29.2 |
-14% |
39.0 |
53.9 |
-28% |
9.82 |
10.83 |
-9% |
20.0 |
30.0 |
-33% |
2018e |
68.7 |
N/A |
N/A |
33.3 |
N/A |
N/A |
51.5 |
N/A |
N/A |
10.21 |
N/A |
N/A |
30.0 |
N/A |
N/A |
Source: Globalworth Real Estate Investments data, Edison Investment Research. Note: *NOI is net operating income. **PBT and EPS are normalised, excluding valuation movements, bargain purchase gains and share-based payments.
We have updated our FY16 and FY17 forecasts and have introduced an FY18 forecast for the first time. The main difference to our FY16 forecast results from the recent bond refinancing. Our previous assumption was that the c €100m short-term mezzanine loan (interest rate c 12%) would be replaced with short-term bank debt at a cost of c 4%, a similar cost to the current bank debt, and that near-term additional funding needs would be similarly financed. Instead, we estimate the cost of the three-year bonds at c 7%, which leads us to increase our net finance cost estimate. We have also pushed back our estimate of the timing, completion and letting of Globalworth Campus phase B slightly (completion from late FY16 to late FY17), which defers related NOI from FY17 to FY18.
Forecast details
At the end of FY15, the current NOI on let standing properties reported by GWI was c €37.7m (€43.7m including the subsequently completed Globalworth Tower) higher than the total FY15 NOI reported in the P&L of c €28.4m. The difference is accounted for by properties acquired during the 2015 year that did not contribute fully to the annual income, and rent incentives. We estimate that by the end of FY18, the €37.7m will rise to €78.3m, primarily due to development properties completing and being let. We assume no property acquisitions. To get to the income reported in the P&L we have averaged the contribution of each property on a quarterly basis and we have allowed a 10% deduction for lease incentives. Annualised P&L income in H218e is thus €70.2m and our estimate for FY18 is €78.3m. The implied average occupancy at the end of FY18 is 97.5%.
Of the estimated increase in gross NOI of €30.6m by the end of FY18, c €12.0m is attributable to occupancy and rent changes on existing let assets, and the balance, €28.6m, to the estimated Q4FY18 contribution from recently completed or current developments upon completion (Globalworth Tower €11.4m, Globalworth Campus, phases A & B, €15.1m, and Gera Herastrau €2.1m).
Exhibit 5: Key financial data – profit & loss
€000s |
2013 |
2014 |
2015 |
2016e |
2017e |
2018e |
Net operating income (NOI) |
5,304.3 |
12,893.0 |
28,370.0 |
40,736.0 |
60,011.9 |
68,691.9 |
Administrative expenses |
(1,856.2) |
(11,654.0) |
(10,440.0) |
(10,857.6) |
(11,291.9) |
(11,743.6) |
Acquisition costs |
(108.0) |
(2,476.0) |
(811.0) |
(250.0) |
0.0 |
0.0 |
Fair value gain on investment property |
1,362.6 |
25,003.0 |
49,422.0 |
8,600.0 |
8,300.0 |
4,500.0 |
Bargain purchase gain on acquisition of subsidiaries |
9,377.3 |
80,249.0 |
17,227.0 |
0.0 |
0.0 |
0.0 |
Gain on sale of subsidiary |
0.0 |
198.0 |
0.0 |
0.0 |
0.0 |
0.0 |
Share-based payments |
(43.8) |
(136.0) |
(125.0) |
(150.0) |
(150.0) |
(150.0) |
FX gain/(loss) |
(77.7) |
(355.0) |
(249.0) |
0.0 |
0.0 |
0.0 |
EBITDA (excluding fair value gains and bargain purchase) |
3,218.6 |
(1,728.0) |
16,745.0 |
29,478.4 |
48,570.0 |
56,798.3 |
Profit before financing cost (EBIT) |
13,958.5 |
103,722.0 |
83,394.0 |
38,078.4 |
56,870.0 |
61,298.3 |
Finance cost |
(255.0) |
(8,322.0) |
(21,407.0) |
(24,776.3) |
(23,589.4) |
(23,726.3) |
Finance income |
1.8 |
327.0 |
526.0 |
80.0 |
80.0 |
80.0 |
Net finance (cost)/income |
(253.2) |
(7,995.0) |
(20,881.0) |
(24,696.3) |
(23,509.4) |
(23,646.3) |
Profit before tax (PBT) |
13,705.3 |
95,727.0 |
62,513.0 |
13,382.1 |
33,360.6 |
37,652.0 |
Current income tax expense |
(777.5) |
(64.0) |
(245.0) |
(47.8) |
(250.6) |
(331.5) |
Deferred income tax expense |
(198.1) |
(5,036.0) |
(10,847.0) |
(1,376.0) |
(1,328.0) |
(720.0) |
Income tax expense |
(975.7) |
(5,100.0) |
(11,092.0) |
(1,423.8) |
(1,578.6) |
(1,051.5) |
Minorities |
(39.0) |
497.0 |
0.0 |
0.0 |
0.0 |
0.0 |
Attributable profit after tax (PAT) |
12,690.6 |
91,124.0 |
51,421.0 |
11,958.3 |
31,782.0 |
36,600.5 |
Other comprehensive income |
0.0 |
0.0 |
0.0 |
0.0 |
0.0 |
0.0 |
Total attributable comprehensive income |
12,690.6 |
91,124.0 |
51,421.0 |
11,958.3 |
31,782.0 |
36,600.5 |
ADJUSTED EARNINGS |
||||||
Reported PBT |
13,705.3 |
95,727.0 |
62,513.0 |
13,382.1 |
33,360.6 |
37,652.0 |
Adjusted for: |
||||||
Fair value gain on investment property |
(1,362.6) |
(25,003.0) |
(49,422.0) |
(8,600.0) |
(8,300.0) |
(4,500.0) |
Bargain purchase gain on acquisition of subsidiaries |
(9,377.3) |
(80,249.0) |
(17,227.0) |
0.0 |
0.0 |
0.0 |
Share based payments |
43.8 |
136.0 |
125.0 |
150.0 |
150.0 |
150.0 |
Adjusted PBT |
3,009.2 |
(9,389.0) |
(4,011.0) |
4,932.1 |
25,210.6 |
33,302.0 |
Les current tax |
(777.5) |
(64.0) |
(245.0) |
(47.8) |
(250.6) |
(331.5) |
Adjusted profit after tax |
2,231.7 |
(9,453.0) |
(4,256.0) |
4,884.3 |
24,960.0 |
32,970.5 |
Basic average number of shares (m) |
7.3 |
45.1 |
55.9 |
63.3 |
64.0 |
64.0 |
Fully diluted average number of shares (m) |
7.3 |
45.1 |
55.9 |
63.3 |
64.0 |
64.0 |
EPS - basic (c) |
173.9 |
202.1 |
92.0 |
18.9 |
49.6 |
57.2 |
EPS - diluted (c) |
173.9 |
202.1 |
92.0 |
18.9 |
49.6 |
57.2 |
EPS - adjusted and diluted (c) |
30.6 |
(21.0) |
(7.6) |
7.7 |
39.0 |
51.5 |
Operating cash flow after finance costs per share (c) |
0.1 |
(71.7) |
5.4 |
10.8 |
41.3 |
51.9 |
DPS (c) |
0.0 |
0.0 |
0.0 |
10.0 |
20.0 |
30.0 |
Source: Globalworth Real Estate Investments data, Edison Investment Research
The only fair value movements that we have allowed for are to recognise the €21.4m revaluation uplift indicated by the external valuation report in respect of development properties, at or around the time of expected completion. In Exhibit 7 on page 12 we show an estimated sensitivity of property values and NAV to changes in valuation yield.
We have allowed for 4% pa growth in administrative expenses
Finance expenses equate to an average cost of debt of 5.2%, the weighted average of bank debt at 4% and bond debt at 7%.
The group is domiciled in Guernsey where the current effective tax rate is nil. Subsidiaries in Romania, the Netherlands and Cyprus are subject to local taxes in respect of local sources of income. The tax expense recorded in the P&L in FY15 represented mostly deferred tax (in respect of valuation gains on the investment portfolio) and a small amount of current tax. The effective tax rate excluding deferred tax was 0.3% and we assume negligible current tax in our forecasts.
Exhibit 6: Key financial data – summary balance sheet & cash flow
€000s |
2013 |
2014 |
2015 |
2016e |
2017e |
2018e |
Investment property |
121,335 |
599,257 |
937,119 |
1,018,019 |
1,080,319 |
1,089,819 |
Goodwill |
12,616 |
12,349 |
12,349 |
12,349 |
12,349 |
12,349 |
Other long-term assets |
9,036 |
16,067 |
7,867 |
7,867 |
7,867 |
7,867 |
Total non-current assets |
142,987 |
627,673 |
957,335 |
1,038,235 |
1,100,535 |
1,110,035 |
Cash & equivalents |
9,506 |
21,957 |
37,036 |
43,503 |
11,839 |
14,160 |
Other current assets |
13,056 |
19,066 |
25,767 |
16,553 |
17,430 |
17,564 |
Total current assets |
22,562 |
41,023 |
62,803 |
60,056 |
29,269 |
31,724 |
TOTAL ASSETS |
165,549 |
668,696 |
1,020,138 |
1,098,291 |
1,129,804 |
1,141,759 |
Interest bearing loans & borrowings |
(165) |
(143,814) |
(261,287) |
(416,887) |
(419,179) |
(406,107) |
Other non-current liabilities |
(12,482) |
(49,169) |
(76,138) |
(77,501) |
(78,829) |
(79,549) |
Total non-current liabilities |
(12,647) |
(192,983) |
(337,425) |
(494,388) |
(498,008) |
(485,656) |
Interest bearing loans & borrowing |
(20,296) |
(61,187) |
(143,024) |
(43,024) |
(43,024) |
(43,024) |
Other current liabilities |
(12,327) |
(21,785) |
(40,008) |
(43,077) |
(45,441) |
(45,801) |
Total current liabilities |
(32,623) |
(82,972) |
(183,032) |
(86,101) |
(88,465) |
(88,825) |
TOTAL LIABILITIES |
(45,270) |
(275,955) |
(520,457) |
(580,489) |
(586,472) |
(574,481) |
NET ASSETS |
120,279 |
392,741 |
499,681 |
517,802 |
543,332 |
567,278 |
Non-controlling interests |
(588) |
(6) |
0 |
0 |
0 |
0 |
SHAREHOLDERS’ EQUITY |
119,691 |
392,735 |
499,681 |
517,802 |
543,332 |
567,278 |
Adjustments to EPRA: |
||||||
Add deferred tax liability |
12,432 |
47,111 |
70,413 |
71,776 |
73,104 |
73,824 |
Deduct goodwill as a result of deferred tax |
(5,965) |
(5,697) |
(5,697) |
(5,697) |
(5,697) |
(5,697) |
Add negative fair value of interest rate swap |
0 |
0 |
3,935 |
3,935 |
3,935 |
3,935 |
EPRA NAV |
126,158 |
434,149 |
568,332 |
587,816 |
614,674 |
639,340 |
Period end number of shares (m) |
20.9 |
53.6 |
62.6 |
62.6 |
62.6 |
62.6 |
Fully diluted period end number of shares (m) |
20.9 |
53.6 |
62.6 |
62.6 |
62.6 |
62.6 |
Basic NAV per share (€) |
5.73 |
7.32 |
7.98 |
8.27 |
8.68 |
9.06 |
EPRA NAV per share (€) |
6.03 |
8.09 |
9.08 |
9.39 |
9.82 |
10.21 |
LTV (debt less cash as a percentage of gross investment properties) |
9.0% |
30.5% |
39.2% |
40.9% |
41.7% |
39.9% |
CASH FLOW |
||||||
Cash flows from operating activities |
4 |
(32,327) |
3,018 |
6,815 |
26,446 |
33,197 |
Capex |
(1,769) |
(56,108) |
(69,729) |
(72,300) |
(54,000) |
(5,000) |
Acquisitions /disposals |
(34,548) |
(36,868) |
(114,568) |
10,353 |
0 |
0 |
Cash flows from investing activities |
(36,317) |
(92,976) |
(184,297) |
(61,947) |
(54,000) |
(5,000) |
Proceeds from share issuance (net) |
48,652 |
76,790 |
53,441 |
6,000 |
0 |
0 |
Dividends paid in period |
0 |
0 |
0 |
0 |
(6,402) |
(12,805) |
Other financing cash flows |
0 |
(1,873) |
(3,622) |
0 |
0 |
0 |
Cash flows from financing |
48,652 |
74,917 |
49,819 |
6,000 |
(6,402) |
(12,805) |
Other (including debt assumed on acquisition) |
(23,294) |
(121,702) |
(52,771) |
0 |
0 |
0 |
(Increase)/decrease in net debt. |
(10,956) |
(172,088) |
(184,231) |
(49,132) |
(33,956) |
15,392 |
Opening net (debt)/cash |
0 |
(10,956) |
(183,044) |
(367,275) |
(416,407) |
(450,363) |
Closing net (debt)/cash |
(10,956) |
(183,044) |
(367,275) |
(416,407) |
(450,363) |
(434,971) |
Source: Globalworth Real Estate Investments data, Edison Investment Research
Our forecasts show cash flow from operations after financing continue to increase, from the €3.0m reported in FY15 to €33.2m in FY18. During this same period, we expect capex to complete the existing development projects of €131.3m. As a result we estimate net debt will increase further, peaking at c €450m in FY17, with the ratio of net debt to investment properties at 41.7%, well below GWI’s self-imposed maximum LTV of 60%.
GWI has indicated an intention to pay out up to 90% of available free cash in shareholder distributions. Available cash flow depends on acquisition and development opportunities, but our starting point for available free cash is operating cash flow after financing costs. In per share terms our estimates show this at 51.9 cents per share in FY18. Although management is yet to indicate the commencement of dividends we have assumed that as free cash flow builds and capex approaches its end, this will happen.
Valuation
Portfolio progress to support cash flow growth
We assume that GWI will commence dividend payments during the forecast period, and we have allowed for a relatively modest €0.10 per share dividend to be declared in respect of the current FY16 year, and be paid in FY17. We had previously thought this possible as early as FY15. There are continuing development financing needs over the FY16-18 period (€131.3m in aggregate), but as these fall away we expect that dividends will build from the modest starting position. For FY18 we assume a DPS of €0.30 to be declared and paid during 2019, representing a c 60% payout of the estimated FY18 operating cash flow after financing. At the current share price of €5.5 this would represent a yield of c 5.5%.
Substantial discount to growing NAV
In September 2015 GWI issued equity at €6 per share to part fund its investment programme. The minimum €35m subscription was oversubscribed by €18.8m. Since that time, the shares have drifted lower, opening up a wider discount to NAV even though the balance sheet was strengthened and the portfolio has continued to develop favourably. Our updated EPRA NAV per share for FY18, when the current development projects should be complete and largely reflected in the balance sheet, is €10.21 and at a price of c €5.5 the shares are trading at a discount of c 46%. While it is true that large discounts to NAV are not uncommon among listed real estate companies investing in CEE and SEE, we continue to note that few are focused on Romania to the same extent as GWI, where market conditions remain favourable.
We have previously referred to New Europe Property Investments (NEPI) as an interesting comparator. It is listed in Johannesburg with a secondary but less active listing on London’s AIM market. Like GWI, it is focused on commercial (both retail and office) property development and investment in Romania (80% of rental income) and is internally managed, and combines property and asset management with development activity. Since it listed in 2007 it has built a consistent track record of NAV growth while distributing at least 90% of its net rental profits, semi-annually, mostly satisfied by the issue of new shares via a scrip alternative. Clearly, compared with GWI it is larger and considerably more liquid, with a market capitalisation of c €3.5bn (GWI c €350m market cap, a free float of 23.5% and an average daily volume of 32.5k shares over the past year according to Bloomberg). And the NEPI valuation appears high; at a price of c €10.75 it is valued at over twice 2015 adjusted NAV per share of €5.25 (up from €4.63 in 2014), while the 2015 distribution of 35.34c represents a yield of c 3.3%. Given the differences is size between GWI and NEPI, and given the latter’s longer track record and more advanced stage of development and cash generating ability, we would not argue that GWI should also trade at 2x book value. However, we do consider the NEPI valuation to be a positive indicator of the direction of travel in GWI’s valuation as it continues to develop.
Upside potential from yield compression
€1,065.6m of the FY15 expected portfolio value at completion (the last external valuation) applies to what are, or will become, income-producing assets excluding land plots. On this management expects a contracted NOI of €78.5m (this includes pre-lets, but is very similar to our expectation of the occupied position at the end of FY18) or an NOI yield of 7.39%. In Exhibit 7 we update our sensitivity analysis of the estimated movement in EPRA NAV per share for a range of possible valuation yields.
A decline in the NOI yield to 7.0% is estimated to lift our existing FY18 NAV per share estimate from €10.21 to €11.16. At 6.0% the forecast NAV would increase further to €14.14 per share. We also illustrate the result assuming full conversion of the warrants that have been granted to the founder and certain key managers. The warrants vest in three tranches, when the weighted average share price exceeds the trigger level for 60 consecutive days (1.8m warrants at a €7.5 average price, 1.4m at €10 and 1.4m at €12.5). In total, a potential 4.6m shares would be created at a subscription price of €5 per share (generating c €23m of new capital). In the estimate that allows for warrant dilution, we have assumed that the additional equity generated by the conversion increases operating cash flow at a yield of 2%; this is a balance between the alternatives of paying down debt at a cost of c 4% or holding a higher cash balance with a negligible return. The potential upside in NAV per share is clear in both scenarios.
Exhibit 7: Sensitivity of NAV and NOI yield to valuation movements
2018e – without warrant dilution being triggered |
2018e including full warrant dilution |
||||||||
Forecast |
Illustrated sensitivity |
Forecast |
Illustrated sensitivity |
||||||
Investment portfolio (€m) |
1,080.3 |
1,139.6 |
1,225.9 |
1,326.5 |
1,080.3 |
1,139.6 |
1,225.9 |
1,326.5 |
|
Land assets (€m) |
18.2 |
18.2 |
18.2 |
18.2 |
18.2 |
18.2 |
18.2 |
18.2 |
|
Income generating portfolio (€m) |
1,062.1 |
1,121.4 |
1,207.7 |
1,308.3 |
1,062.1 |
1,121.4 |
1,207.7 |
1,308.3 |
|
Company expected Q118 property NOI (€m) |
78.5 |
78.5 |
78.5 |
78.5 |
78.5 |
78.5 |
78.5 |
78.5 |
|
NOI yield |
7.39% |
7.00% |
6.50% |
6.00% |
7.39% |
7.00% |
6.50% |
6.00% |
|
2018e EPRA NAV (€m) |
639.3 |
698.6 |
784.9 |
885.6 |
639.3 |
721.8 |
808.1 |
908.7 |
|
Fully diluted number of shares (m) |
62.6 |
62.6 |
62.6 |
62.6 |
62.6 |
67.3 |
67.3 |
67.3 |
|
2018e EPRA NAVPS (€) |
10.21 |
11.16 |
12.54 |
14.14 |
10.21 |
10.73 |
12.02 |
13.51 |
|
2018e operating cash flow after finance costs (€m) |
33.2 |
33.2 |
33.2 |
33.2 |
33.2 |
33.7 |
33.7 |
33.7 |
|
Operating cash flow after finance costs as % NAV |
5.2% |
4.8% |
4.2% |
3.7% |
5.2% |
4.7% |
4.2% |
3.7% |
|
Current share price |
5.60 |
||||||||
Price/NAV |
0.55 |
0.50 |
0.45 |
0.40 |
0.55 |
0.52 |
0.47 |
0.41 |
|
Source: Globalworth Real Estate Investments data, Edison Investment Research. Note: Warrant dilution based on a strike price of €5.0.
Sensitivities
In addition to the usual development and funding risks, we would highlight the significant role played by GWI’s founder and major shareholder, as well as Romania’s past reputation for weak political and business transparency. The country is still subject to special monitoring by the European Commission (the “Co-operation and Verification Mechanism” or CVM) to check its progress in the fight against corruption. The issue has received a great deal of government attention and the most recent CVM report makes note of the country’s willingness to fight corruption and to protect the independence of the judiciary. However, it also notes that further steps to tackle general corruption are needed to address it as a systemic problem.
■
Key individual risk: we discuss above the experience and track record of the founder and main shareholder, Ioannis Papalekas, who is 40 years old. His contribution since GWI’s formation has been significant and we expect him to have an important continuing role in the group’s development. However, GWI’s reliance on Mr Papalekas has been considerably reduced by the considerable deepening and broadening of the management team at GWI in the period since listing and the maturing of the business as a whole.
■
Property development risk: development activity carries risks associated with the building process, including timing, as well as the risks of leasing on completion. With the technically challenging flagship Globalworth Tower completed, the main planned development activity relates to Globalworth Campus and the further TAP extension.
■
Funding risks: With GWI having raised substantial new equity capital in 2015 and having recently secured the €180m three-year bond financing, our forecasts indicate that GWI now has sufficient financial resources to complete at least phase A of the Globalworth Campus development. We implicitly assume that GWI will be able to successfully raise c €35m of additional debt (perhaps by refinancing developed properties) to complete its current development activity.
|
||||||||||||||||||||||||||||||||||
|
|