Last close As at 05/08/2026
—
— 0.00 (0.00%)
Market capitalisation
—
Research: TMT
EQS is making good progress on building a substantial presence in both corporate compliance and investor relations, growing its SaaS and annual recurring revenue streams. With a platform approach that allows for cross- and up-selling, this is a scalable business model in growing markets, driven by digitisation and regulation. The implementation of whistleblowing regulation in the EU during 2021 gives a clear opportunity for the group to extend its client base. The cost of grasping that opening is weighing on short-term profitability but enhances medium-term prospects.
EQS Group |
FY21 focus on whistleblowing |
Q1 update |
Software & comp services |
26 May 2021 |
Share price performance
Business description
Next events
Analyst
EQS Group is a research client of Edison Investment Research Limited |
|||||||||||||||||||||||||||||||||||||||||||||||
EQS is making good progress on building a substantial presence in both corporate compliance and investor relations, growing its SaaS and annual recurring revenue streams. With a platform approach that allows for cross- and up-selling, this is a scalable business model in growing markets, driven by digitisation and regulation. The implementation of whistleblowing regulation in the EU during 2021 gives a clear opportunity for the group to extend its client base. The cost of grasping that opening is weighing on short-term profitability but enhances medium-term prospects.
Year end |
Revenue (€m) |
EBITDA |
PBT* |
EPS* |
EV/EBITDA |
P/E |
12/19 |
35.4 |
2.6 |
(0.3) |
(7.4) |
94.6 |
N/A |
12/20 |
37.6 |
4.8 |
0.4 |
4.1 |
54.8 |
N/M |
12/21e |
45.5 |
1.1 |
(3.2) |
(28.6) |
219.7 |
N/A |
12/22e |
53.2 |
4.3 |
(0.1) |
(2.1) |
56.2 |
N/A |
Note: *PBT and EPS are normalised, excluding amortisation of acquired intangibles, exceptional items and share-based payments.
Q121 shows build in recurring revenues
Q121 revenues were 26% above the previous year at €10.6m, in line with management’s projected growth range for the year of 20–30%. Excluding the recent acquisitions of Got Ethics and C2S2, consolidated from 1 January 2021, growth was 18%. Compliance saw the bigger boost, with products benefiting from the migration of customers onto the COCKPIT platform and with services from a one-off factor from ESF regulation requiring listed companies to file financial reports for a first time. This required some external bought-in services that will not be needed in H221. Recurring revenues accounted for 82%, up from 74% in Q20 and 78% for FY20.
Investing in opportunity
As outlined in late FY20, EQS has a time-limited opportunity to expand its customer base through its provision of whistleblowing solutions as the regulation is enacted across the EU. This should then provide it with a sales pipeline for cross-selling other cloud-based products on its COCKPIT platform. €5.6m is being invested in sales and marketing in FY21e, with €0.8m spent in FY20. With a target market of 50k potential customers, EQS is anticipating gaining a 10% market share and being able to upgrade 20% of those companies to COCKPIT subscribers. FY21e EBITDA is therefore guided to €1.0–2.0m, down from €4.8m in FY20, but is then set to rebuild. Management retains its medium-term guidance to build to €100m of revenues by FY25e, with an EBITDA margin target of 30%. We believe that this looks to be challenging but achievable.
Valuation: Looking to the potential
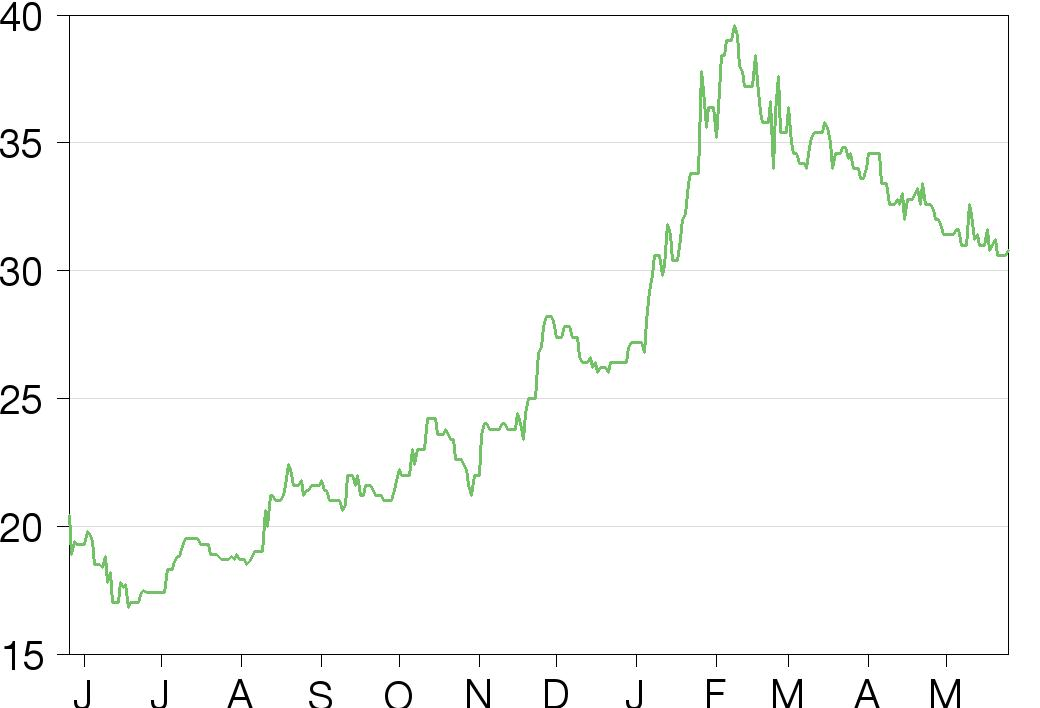
5% share placings in Q420 at €26 and Q121 at €38 mopped up excess demand for the stock and the share price is 22% off its February pre-placing high. On EV/Sales, averaged over FY20–22e, the valuation is still at a discount of around 53% to larger financial software peers, while earnings multiples are distorted in this investment phase. Application software peers trade on similar FY21e and FY22e EV/Sales.
Investment summary
Company description: Growing regtech provider
EQS provides products and services that meet a market need for reliable, secure, trustworthy automation in the compliance and investor relations segments. It has invested in building a cloud-based platform, COCKPIT, for both areas of the business, from which it derives Software-as-a-Service (SaaS) revenues. COCKPIT provides its clients with a dashboard from which to access the subscribed elements to manage their own workflows. It has 3,260 customers (as at end Q121), with 82% of revenues earned on a recurring basis and a churn of 6%. The more complex the corporate regulation framework, the greater the opportunity, with the current roll-out of the whistleblowing regulations across Europe widening the target market.
Valuation: Distorted by investment
The share price is 22% lower than before the second 5% placing in February, which was at €38, since which time trading volumes have been relatively subdued. With earnings supressed by the renewed investment phase, EV/Sales is the only realistic metric to use for peer comparison. The share trades at a notable discount to larger financial software peers of a little over 50%. Application software peers, however, trade at similar multiples for FY21e and FY22e of 5.5x and 4.5x respectively. We have also looked at a DCF, using a WACC of 8% and terminal growth of 2%. Based on management’s targets of €100m and a 30%+ EBITDA margin for FY25e, with revenue growth tailing off after as the effects of scale take effect, the implied share price is €48.21. There is obviously an element of execution risk here. Even if the EBITDA margin were to be set at 25%, the implied share price would be €36.16, near 20% above the current level.
Financials: Strong top-line growth; investment weighs on EBITDA
Management guidance is for FY21e revenue growth of 20–30% and EBITDA of €1.0–2.0m. Our forecast is at the lower end of this range, unchanged on the Q121 results, with an element of caution until it becomes clearer as to whether the ramped-up sales and marketing is having the desired effect. The Q121 figures showed revenues up 26%, with benefit from recent acquisitions lifting that figure from 18%. Management’s ambition is to build to group revenues of €100m for FY25e, driven mostly by demand for compliance products and services as the suite offered through the COCKPIT platform builds and cross-selling becomes more prevalent.
EBITDA margin is being held down currently by the investment in people to boost the short-term sales effort behind the whistleblowing opportunity. The medium-term plan envisages its recovery to over 30% by FY25e – which we regard as a challenging but feasible ambition. The business is lightly geared post two small acquisitions, but fundamentally should have healthy operational cash conversion of around 100%, with the larger capital spend on building the cloud-based platform completed over FY17–20.
Sensitivities: Success of sales push
COVID-19 may prove to have been commercially beneficial to EQS. While sales conversion was slower, corporate digital transformation programmes have increased in number and scale, providing a larger target market. The group’s virtual AGM capability has also been advantageous. The key sensitivity currently is the ability of EQS’s enlarged sales team to convert the whistleblowing pipeline and justify the additional spend. Reaching the FY25 targets also requires success in cross-selling and building recurring revenue streams.
Company description: Cloud-based regtech provider
EQS’s business is split into two segments: Compliance and Investor Relations. The Compliance segment covers products that are required to fulfil a regulatory obligation. The Investor Relations segment (IR) includes the products designed to facilitate digital investor and corporate communications. EQS is one of the largest global providers of digital solutions, designed to automate and simplify processes for those individuals working on the technical administrative aspects of running a corporate concern, enabling them to free up their time to deal with matters that require more than simple information processing. By ensuring that the cloud-based product suites provided are constantly updated for the latest regulatory compliance changes and delivered via intuitive interfaces, EQS should continue to add value for its users. Originally centred on investor relations (which in Germany and some other markets includes functions covered in other jurisdictions by the company secretary or equivalent), the group’s products and services have been expanded across the related areas of compliance.
The group was founded in 2000 in Munich, initially building a strong market position in its home markets of Germany, Switzerland and Austria before starting to build its presence in overseas territories. EQS looks to position itself as a partner with its client companies, working alongside them to solve issues and reduce inefficiencies, rather than simply as a supplier whose interest may not extend beyond the initial sales timeframe, with a growing emphasis on providing SaaS. The shift away from paper-based information to digital channels of communication between corporate entities and their various stakeholders has been a key driver of growth, accelerated by the conditions imposed by the pandemic. The honed business model is focused on building subscription and annually recurring incomes as a proportion of the whole, increasing the quality of the earnings.
|
Exhibit 1: FY20 revenue by segment/activity |
Exhibit 2: FY20 by geography |
|
|
|
Source: Company accounts |
|
Exhibit 1: FY20 revenue by segment/activity |
|
|
Source: Company accounts |
|
Exhibit 2: FY20 by geography |
|
|
Source: Company accounts |
EQS has been built through a combination of organic and acquisition-driven growth. The acquisition of ARIVA in July 2016 broadened the target markets to include financial institutions, but this concern was sold in July 2019 as it no longer fitted neatly with the corporate strategy. The most significant recent acquisition was that of Switzerland-based Integrity Line (€5.0m), in December 2017. This was a leading provider of cloud-based whistleblowing systems, which has now been augmented with the purchase in November 2020 of Danish whistleblowing SaaS provider Got Ethics for an initial cost of €10m. This area forms the core of the push to grow the corporate client base described in more detail below. As a result of the acquisitions, revenues generated outside EQS’s domestic market should be higher in FY21 than FY20, having reached 34% of group in Q121.
At end Q120, the group employed 455 workers (416 full-time equivalents, FTEs), from 447 at end December 2020 and a sharp uptick on the 338 FTEs at end Q320. This reflects the additional sales and marketing personnel to address the opportunity in whistleblowing, described in more detail below. The headquarters are in Munich, Germany, with nine further offices across Europe and others in New York, Hong Kong and Moscow. In addition, the group has a technology site in Kochi, India where much of the work is done on building the standardised solutions, with other software engineers working in the group’s Belgrade facility.
Targeted at corporate compliance and investor relations
The group operates in two B2B segments. Investor relations is the smaller of the two, estimated by management to be worth around $1bn globally and growing at a modest CAGR of around 3%. Corporate compliance (or regtech, as management increasingly refers to it) is both significantly larger at $6bn, and much faster growing at around 20%.
The specific products and services provided under these two segments are illustrated in Exhibit 3, below, which also shows those provided on a SaaS basis, and those that fall outside and may be intrinsically less scalable. Nevertheless, it can be useful to continue to provide them as an entry point into an organisation and to build trust, which is at the heart of all EQS’s client relationships.
|
Exhibit 3: Group product and service portfolio |
|
|
Source: Company |
Cloud-based solutions
From FY17 to FY20, EQS implemented a substantial programme to upgrade its COCKPIT cloud-based platform, with a total project investment of €8.8m. This approach allows for additional functionality to be added over time and eases the cross-selling processing to existing clients. The COCKPIT has an intuitive user interface, using a dashboard to access the relevant subscribed components.
For compliance customers, these can include Insider Manager, which keeps track of who within the organisation has access to privileged information, Approval Manager, which is used to keep tabs on potential conflicts of interest, Policy Manager, designed to be a resource of company policies and procedures, or the whistleblowing component, described below.
Since the launch of the upgraded COCKPIT, much of the group sales effort has been focused on migrating existing customers onto new SaaS contracts. As at end April 2021, the group had 213 new customers on SaaS contracts, up from 157 at end March and well on the way to the target for the full year of 1,500–2,000. The total number of group SaaS customers was 3,260 at end Q121, boosted by the acquisitions of Got Ethics and C2S2 in the quarter.
|
Exhibit 4: IR COCKPIT components |
Exhibit 5: Compliance COCKPIT components |
|
|
|
Source: Company |
Source: Company |
|
Exhibit 4: IR COCKPIT components |
|
|
Source: Company |
|
Exhibit 5: Compliance COCKPIT components |
|
|
Source: Company |
The whistleblowing opportunity
EU regulation regarding the provision of secure procedures for corporate whistleblowing was put in place in 2019, with a requirement for it to be incorporated into the legislative framework of member states by the end of 2021. This applies to organisations with more than 50 employees. Those with over 250 employees must comply within two years; those with 50 to 250 have a maximum of a further two years. Reporting can be via an online system or via more traditional communications, with obvious major advantages to the former in terms of process and confidentiality.
|
Exhibit 6: Whistleblowing market and conversion targets |
|
|
Source: Company, Edison Investment Research |
The acquisitions first of Integrity Line and subsequently of Got Ethics have given EQS a highly credible proposition in this burgeoning market. Management estimates that there are 50k companies within the EU that will need to address their systems, with the likely conversion rates as shown in Exhibit 6.
The timeframe is dictated by the regulation, so this is an inherently time-limited opportunity. Management made a strategic call to go after this market and then use sales as a bridgehead to sell in a wider range of products and services. It has quantified the FY21 investment in additional sales and marketing at €5.6m, with €0.83m having been spent on this effort in FY20.
EQS is well placed to achieve its targeted penetration in Europe, being the largest continental provider. In Germany, Business Keeper is the main competitor (around half the number of customers of EQS), with a smaller Dutch operator also in the EU market. The largest player in the market is US-based NavexGlobal, with another US company OneTrust also targeting European corporates. Tackling the European market is obviously complicated for US companies by the requirements to operate in a variety of languages and to guarantee that data will be retained within the EU. Smaller companies and start-ups looking to enter this market are not likely to be able to obtain the correct certifications or have built a reputation for data security and integrity.
Management steeped in financial markets and IR
The group’s CEO is Achim Weick, who began his career at Commerzbank. Subsequently, he was co-founder of investor relations manager CMC Capital Markets Consulting. Achim is the originator, founder and largest shareholder of EQS and has been on the board since its foundation. COO Christian Pfleger joined EQS in 2001, initially as a client relationship manager, moving to project management from 2003. In 2007, he took over responsibility for products and services. André Silverio Marques, who fulfils the finance function, was appointed to the main board as CFO in July 2018, having been finance director since 2015. He previously ran the group’s Russian businesses and, before that, oversaw the IR, business development and corporate finance activities. The other key member of the management team is Marcus Sultzer, who joined the group in 2007 and oversaw business development in Russia and the CIS from 2009 and Asia-Pacific from 2013. As well as being international managing director, in charge of operations in Asia, Russia, Switzerland and UAE, he is the group’s chief revenue officer. Fuller biographies of management are given on page 12.
Sensitivities
While all businesses have been affected by the COVID-19 pandemic, the effect on EQS has not been entirely detrimental. The transition to working from home was comparatively straightforward, as might be expected. While there have been drawbacks in terms of slower sales conversion cycles, there have also been benefits. These have included the boost to virtual meeting hosting within the IR offering, with virtual AGMs allowed for the first time under German company law. It is likely that some benefit from this experience will be retained as conditions revert, given the advantages of cost and additional reach.
The key sensitivity currently is the success or otherwise of the conversion of the sales pipeline for the whistleblowing and subsequent conversion into broader client status, as illustrated in Exhibit 6 above.
There are various other factors that will influence EQS’s financial performance, each of which may vary considerably across the operating territories. These include:
■
The number of listed companies, itself a factor of the environment for de-listings and/or IPOs. With few IPOs in FY20, they may provide a tailwind in the current year.
■
The number of companies of sufficient scale to benefit from automation of reporting.
■
Corporate activity that prompts the need for information dissemination.
■
The regulatory environment – the more complex the system and the greater the number and extent of changes to those systems, the greater the requirement for corporates to access relevant expertise. The introduction of additional regulation, such as that for whistleblowing, can create a new market, while others like market abuse regulations can reinvigorate previously dull markets.
■
Requirements for corporates to make information available in a digital format, either through regulation or user demand.
■
Data security, including the General Data Protection Regulation, can restrict competition from providers that do not have similar levels of auditory clearance, or which may not hold their data within the relevant jurisdiction, and sets a higher barrier to entry.
■
Currency: around 30–35% of revenues are generated in currencies other than the euro, mostly in hard currencies such as the Swiss franc, Danish krone, sterling, Hong Kong dollars and the US dollar. Expenses are predominantly in Euro. Currency exposure is not hedged, as the main impact is on valuation, a non-cash item.
Valuation
The current restraints on profitability stemming from the investment programme make conventional peer-based valuation less useful, so we supplement this with a DCF-based approach.
Peer context
As the internal investment is affecting profitability for FY19–20, the most reliable of the traditional multiple is that of EV/Revenue (although we also show EV/EBITDA and P/E below). There is a wide range of multiples for the financial software peer group. For FY1, EQS is trading at 5.4x sales versus the average for the entire peer group pf 11.0x.
We have also looked at a broader global set of quoted application software peers, which are, in general, rated at roughly 30% lower across EV/Sales, EV/EBITDA and P/E. Here, EQS shares are trading broadly in line on current year and FY2 EV/Sales, As would be expected by the suppression of short-term profitability to boost the longer-term potential, EQS trades at a considerable premium on EV/EBITDA across both peer sets.
Exhibit 7: Valuation compared with financial software and application software peers
Price (reporting currency) |
Market cap (m) |
Ytd |
EV/Sales (x) |
EV/EBITDA (x) |
PE (x) |
|||||||
Financial software |
FY0 |
FY1 |
FY2 |
FY0 |
FY1 |
FY2 |
FY0 |
FY1 |
FY2 |
|||
Euromoney (£) |
967 |
1,054 |
-9 |
3.3 |
3.4 |
2.9 |
16.4 |
15.9 |
12.3 |
- |
- |
- |
Thomson Reuters (U$) |
114 |
56,723 |
10 |
8.1 |
7.8 |
7.4 |
24.6 |
25.0 |
21.6 |
51.3 |
50.8 |
40.1 |
Envestnet (U$) |
66 |
3,609 |
-19 |
4.1 |
3.6 |
3.2 |
16.8 |
16.9 |
15.2 |
25.8 |
30.7 |
27.8 |
Swissquote Group (€) |
130 |
1,999 |
52 |
20.6 |
13.1 |
12.2 |
29.4 |
26.6 |
21.5 |
17.7 |
15.7 |
|
GlobalData (£) |
1565 |
1,846 |
15 |
10.9 |
10.3 |
10.1 |
34.4 |
31.8 |
30.0 |
51.1 |
49.6 |
42.6 |
MSCI (U$) |
456 |
37,716 |
2 |
23.5 |
20.3 |
18.4 |
41.0 |
34.6 |
31.0 |
58.2 |
47.8 |
42.5 |
S&P Global (U$) |
375 |
90,325 |
14 |
12.5 |
11.7 |
11.0 |
22.2 |
21.0 |
19.6 |
32.1 |
29.4 |
27.0 |
MarketAxess Holding (U$) |
455 |
17,286 |
-20 |
24.5 |
21.7 |
19.4 |
- |
38.0 |
33.5 |
58.0 |
55.8 |
49.7 |
Average |
5 |
13.4 |
11.5 |
10.6 |
25.9 |
26.6 |
23.7 |
42.6 |
40.3 |
35.1 |
||
Median |
6 |
11.7 |
11.0 |
10.6 |
23.4 |
27.2 |
24.1 |
51.1 |
47.8 |
40.1 |
||
EQS (€) |
31.2 |
249.0 |
26 |
6.5 |
5.4 |
4.6 |
51.4 |
222.5 |
56.9 |
N/A |
N/A |
N/A |
Premium/(discount) |
-52% |
-53% |
-56% |
99% |
737% |
140% |
N/A |
N/A |
N/A |
|||
Application software peers |
25 |
8.2 |
5.5 |
4.5 |
24.3 |
22.6 |
21.0 |
33.9 |
31.8 |
27.7 |
||
Premium/(discount) |
-21% |
-2% |
2% |
112% |
885% |
171% |
||||||
Source: Refinitiv, Edison Investment Research. Note: Prices at 18 May 2021.
For illustrative purposes, closing the discount on FY2 EV/Revenue would imply a share price of €72. Obviously, the comparative scale and early stage of business development warrant a considerable discount. A 25% discount, for example, would imply a share price of €54.
DCF also points to value above current price
Management has outlined its views on the medium-term revenue growth outlook, with Compliance growing at a CAGR of 28% through to FY25 and IR growing at a more modest 13%. From the current mix (and assuming no further M&A), this equates to group revenue growth in a range of 22%. On the basis of this forecast, management anticipates EBITDA margins exceeding 30% by the end of the forecast period.
If we put these assumptions in the DCF, assume that margins are sustainable at that level and that growth tails off by 200bs per year beyond FY25e simply through scale, then at a WACC of 8% and with a terminal growth rate of 2%, the implied value per share is €48.21. Obviously, there is an element of execution risk here, with the bulk of the value accruing well beyond our explicit forecast period (to FY22e).
Exhibit 8: DCF on management target assumptions
Terminal growth rate |
||||||
0.00% |
1.00% |
2.00% |
3.00% |
4.00% |
||
WACC |
10.00% |
28.22 |
30.54 |
33.44 |
37.18 |
42.16 |
9.50% |
30.29 |
32.97 |
36.37 |
40.81 |
46.87 |
|
9.00% |
32.61 |
35.73 |
39.73 |
45.07 |
52.54 |
|
8.50% |
35.23 |
38.87 |
43.63 |
50.12 |
59.51 |
|
8.00% |
38.19 |
42.48 |
48.21 |
56.22 |
68.25 |
|
7.50% |
41.57 |
46.68 |
53.65 |
63.71 |
79.53 |
|
7.00% |
45.46 |
51.60 |
60.21 |
73.11 |
94.62 |
|
6.50% |
49.97 |
57.45 |
68.26 |
85.24 |
115.81 |
|
6.00% |
55.27 |
64.51 |
78.37 |
101.47 |
147.67 |
|
5.50% |
61.58 |
73.19 |
91.43 |
124.27 |
200.90 |
|
Source: Edison Investment Research
Financials
We are not making any changes to our earnings forecasts on the back of Q121 results but have adjusted the balance sheet and cash flow statements to reflect the clarified position post the consolidation of Got Ethics and C2S2 after the last year end.
Building a long-term, sustainable business
As the business has developed, it has honed its strategy to pivot towards its areas of greatest opportunity, in particular the focus on the two areas of Corporate Compliance and Investor Relations. The reorientation fell mostly into FY18, but the only year that revenues did not increase was the following year, which was previously expected to be the first year of growth from the new COCKPIT. With a dull market backdrop (few IPOs, languid economies) and delays to the launch of some modules while they were optimised, revenue dipped by 2.3% in FY19, effectively making it a second year of transition.
Exhibit 9: Segmental record and forecasts
€000s |
FY19 |
FY20 |
FY21e |
FY22e |
Investor Relations |
||||
Cloud products |
5,286 |
7,849 |
9,811 |
11,774 |
growth (%) |
0% |
48% |
25% |
20% |
Service products |
8,717 |
9,818 |
10,309 |
10,721 |
growth (%) |
0% |
13% |
5% |
4% |
Discontinued operation (ARIVA.DE AG) |
2,072 |
0 |
0 |
0 |
Total Investor Relations |
16,075 |
17,667 |
20,120 |
22,495 |
growth (%) |
10% |
14% |
12% |
|
l-f-l growth (%) |
26% |
|||
Compliance |
||||
Cloud products |
9,332 |
10,696 |
15,458 |
20,089 |
growth (%) |
0% |
15% |
45% |
30% |
Service products |
8,535 |
9,273 |
9,922 |
10,617 |
growth (%) |
0% |
9% |
7% |
7% |
Discontinued operation (ARIVA.DE AG) |
1,425 |
0 |
0 |
0 |
Total Compliance |
19,292 |
19,969 |
25,380 |
30,706 |
growth (%) |
4% |
27% |
21% |
|
l-f-l growth (%) |
12% |
|||
Group |
35,367 |
37,636 |
45,500 |
53,200 |
growth |
6% |
21% |
17% |
|
l-f-l growth |
18% |
Source: Company accounts, Edison Investment Research
Revenue progress resumed in FY20 as the cloud-based product revenues started to build. The breakdown between cloud-based products and service products by segment is shown in Exhibit 9.
No guidance is given for subsequent years, beyond the ambitions outlined through to FY25e for both revenue and EBITDA. These imply a CAGR of 20–25% for the Compliance segment and of 10–15% revenue growth for Investor Relations, with EBITDA margins of ‘at least 30%’ in FY25. Revenue growth should be faster in the earlier part of this time frame, with the margin enhancement skewed later. The split of these growth ambitions is shown in Exhibits 10 and 11 below, with the implicit CAGRs updated for the FY20 actual figures.
|
Exhibit 10: IR segment growth target |
Exhibit 11: Compliance segment growth target |
|
|
|
Source: Company, Edison Investment Research |
|
Exhibit 10: IR segment growth target |
|
|
Source: Company, Edison Investment Research |
|
Exhibit 11: Compliance segment growth target |
|
|
Source: Company, Edison Investment Research |
Q121 figures show building recurring revenues
Management emphasises the importance of not just growing the top line, but also building recurring revenues. It reports separately the newly agreed contracts for new recurring revenues (ARR), along with targets for the full year. In Q121, there was €1.44m of ARR, 6% above the prior year, taking the total recurring revenue to €8.67m for the quarter. The full year target for new ARR of at least €6m, which looks eminently achievable in this context. The proportion of recurring revenue to total in Q121 was 82%, boosted by revenue brought in from the acquisitions, up from the Q120 figure of 74%.
158 new SaaS customers were acquired in the quarter, taking the total to 3,260, with churn falling to 6% as the mix moves towards longer-term contracts. The FY21 target for new SaaS customers is high at 1,500–2,000 reflecting the ambitions to build in the Whistleblowing segment.
Short-term margin dip from investment
|
Exhibit 12: Long-term earnings record and forecasts |
|
|
Source: Company accounts, Edison Investment Research |
In a longer-term context, while there has been a reasonably smooth progression in revenue, there are two notable dips in EBITDA margin. The first of these relates to the period FY16–18, when the group adopted its platform approach as it raised its ambitions on building a larger and more sustainable business model. The EBITDA margin then started to rebuild as the benefits of the investment programme started to pay off.
This second phase of investment now in progress is focused on people rather than capital investment, building up the sales and marketing effort to grab the short-term opportunity in Whistleblowing, as described above. The FY21 spend is quantified at €5.6m, with €0.83m having been spent on this effort in FY20. In Q121, personnel expenses were up 36% over the prior year at €7.05m as employee numbers rose to an average of 455, including 38 new sales and marketing positions.
Cash flow boosted by capital raises
Underlying cash conversion of EBITDA to operating cash flow for FY20 was 122%, up from 94% for the prior year. The cloud investment project no longer dominates expenditure. Into Q121, working capital has benefited from increased customers prepayments, with an operating cash inflow of €0.9m, compared to EBITDA of €0.3m. Given the scale of the investment being made in FY21e, operating cash flow will be limited, but our modelling suggests that for FY22e, conversion of EBITDA to cash will be back at around 100%.
FY20 cash flow was boosted by a 5% capital raise in December, bringing in €9.1m. A similar exercise in February 2021 raised a further €13.6m. The purchase of Got Ethics was announced in November 2020, for an initial €10m (loan funded), with an earnout over 24 months, along with the purchase of a 23% stake in C2S2 in December, which has boosted the group’s ability in smart search and chatbots. The C2S2 transaction had a call option, exercised in April 2021 (so post the Q121 reporting period). The initial stake was only disclosed as being in the ‘low single-digit millions’ of euros. For simplicity of modelling, we have assumed this to be €2.3m so that the total purchase price is €10m.
A share buyback programme to supply the EBT spent just under €0.2m in FY20 and a further €77k in January 2021.
Transactions increase scale of balance sheet
End-FY20 net cash was €1.2m. Adding back the lease liabilities, net cash was €7.3m, from a prior year-end position of net debt of €5.8m.
At the year end, neither the purchase of Got Ethics nor C2S2 was reflected on the balance sheet. The end-Q121 balance sheet shows the inclusion of Got Ethics and the assets of C2S2, as this was consolidated from January as it was effectively under EQS’s control, even though the holding was only 23% at that stage. Under the assumptions given above, our modelling suggests that the year-end net debt position will be €8.8m, with the Got Ethics earnout contributing to a small additional increase in FY22 to €9.2m, before then starting to reduce as profitability rebounds. Adding back the lease liabilities, which amounted to €5.85m at end Q121, would imply a net debt position of €3.0m at end FY21e.
The acquisitions primarily add intangible assets.
Exhibit 13: Financial summary
€'000s |
2018 |
2019 |
2020 |
2021e |
2022e |
||
31-December |
IFRS |
IFRS |
IFRS |
IFRS |
IFRS |
||
INCOME STATEMENT |
|||||||
Revenue |
|
|
36,210 |
35,367 |
37,636 |
45,500 |
53,200 |
Cost of Sales |
0 |
0 |
0 |
0 |
0 |
||
Gross Profit |
36,210 |
35,367 |
37,636 |
45,500 |
53,200 |
||
EBITDA |
|
|
239 |
2,554 |
4,760 |
1,100 |
4,300 |
Operating Profit (before amort. and except.) |
|
|
(1,299) |
(2,433) |
819 |
(2,841) |
359 |
Amortisation of acquired intangibles |
(821) |
(743) |
(656) |
(656) |
(656) |
||
Exceptionals |
0 |
0 |
0 |
0 |
0 |
||
Share-based payments |
0 |
0 |
0 |
0 |
0 |
||
Reported operating profit |
(2,120) |
(3,176) |
163 |
(3,497) |
(297) |
||
Net Interest |
1,954 |
2,093 |
(396) |
(357) |
(457) |
||
Joint ventures & associates (post tax) |
0 |
0 |
0 |
0 |
0 |
||
Exceptionals |
0 |
0 |
0 |
0 |
0 |
||
Profit Before Tax (norm) |
|
|
655 |
(340) |
423 |
(3,198) |
(98) |
Profit Before Tax (reported) |
|
|
(166) |
(1,083) |
(233) |
(3,854) |
(754) |
Reported tax |
913 |
(610) |
(599) |
1,227 |
160 |
||
Profit After Tax (norm) |
439 |
(532) |
296 |
(2,200) |
(167) |
||
Profit After Tax (reported) |
747 |
(1,693) |
(832) |
(2,627) |
(594) |
||
Minority interests |
20 |
121 |
(34) |
(125) |
(144) |
||
Discontinued operations |
0 |
0 |
0 |
0 |
0 |
||
Net income (normalised) |
439 |
(532) |
296 |
(2,200) |
(167) |
||
Net income (reported) |
767 |
(1,572) |
(866) |
(2,752) |
(738) |
||
Average Number of Shares Outstanding (m) |
7,175 |
7,175 |
7,195 |
7,704 |
7,882 |
||
EPS - normalised (c) |
|
|
6.12 |
(7.41) |
4.12 |
(28.56) |
(2.12) |
EPS - normalised fully diluted (c) |
|
|
6.12 |
(7.41) |
4.12 |
(28.56) |
(2.12) |
EPS - basic reported (€) |
|
|
0.11 |
(0.22) |
(0.12) |
(0.36) |
(0.09) |
Dividend per share (c) |
0.00 |
0.00 |
0.00 |
0.00 |
0.00 |
||
Revenue growth (%) |
19.3 |
(2.3) |
6.4 |
20.9 |
16.9 |
||
EBITDA Margin (%) |
0.7 |
7.2 |
12.6 |
2.4 |
8.1 |
||
Normalised Operating Margin (%) |
(3.6) |
(6.9) |
2.2 |
(6.2) |
0.7 |
||
BALANCE SHEET |
|||||||
Fixed Assets |
|
|
41,219 |
43,841 |
39,447 |
57,304 |
58,695 |
Intangible Assets |
37,293 |
32,008 |
31,016 |
48,664 |
50,020 |
||
Tangible Assets |
2,241 |
8,838 |
7,216 |
7,251 |
7,286 |
||
Investments & other |
1,685 |
2,995 |
1,215 |
1,390 |
1,390 |
||
Current Assets |
|
|
7,250 |
6,094 |
17,086 |
18,277 |
18,714 |
Stocks |
0 |
0 |
0 |
0 |
0 |
||
Debtors |
5,030 |
3,841 |
3,923 |
4,941 |
5,778 |
||
Cash & cash equivalents |
1,308 |
1,184 |
12,074 |
11,524 |
11,124 |
||
Other |
912 |
1,069 |
1,089 |
1,812 |
1,812 |
||
Current Liabilities |
|
|
(14,326) |
(14,563) |
(12,381) |
(12,725) |
(13,063) |
Creditors |
(1,472) |
(1,848) |
(1,651) |
(1,996) |
(2,333) |
||
Tax and social security |
(129) |
(46) |
(56) |
(56) |
(56) |
||
Short term borrowings (includes lease debt) |
(6,961) |
(7,173) |
(3,276) |
(3,276) |
(3,276) |
||
Other |
(5,764) |
(5,496) |
(7,398) |
(7,398) |
(7,398) |
||
Long Term Liabilities |
|
|
(6,660) |
(10,195) |
(11,208) |
(21,606) |
(21,606) |
Long term borrowings (includes lease debt) |
(3,475) |
(7,481) |
(7,641) |
(17,070) |
(17,070) |
||
Other long-term liabilities |
(3,185) |
(2,714) |
(3,567) |
(4,536) |
(4,536) |
||
Net Assets |
|
|
27,483 |
25,177 |
32,944 |
41,250 |
42,740 |
Minority interests |
420 |
(34) |
0 |
(64) |
(64) |
||
Shareholders' equity |
|
|
27,902 |
25,143 |
32,944 |
41,186 |
42,676 |
CASH FLOW |
|||||||
Op Cash Flow before WC and tax |
3,106 |
4,037 |
3,765 |
1,970 |
4,003 |
||
Working capital |
1,270 |
1,061 |
(1,037) |
(273) |
(499) |
||
Exceptional & other |
(1,646) |
(2,516) |
3,212 |
(523) |
646 |
||
Tax |
(135) |
(188) |
(154) |
1,227 |
160 |
||
Net operating cash flow |
|
|
2,595 |
2,394 |
5,786 |
2,401 |
4,310 |
Capex |
(5,441) |
(3,120) |
(2,007) |
(1,500) |
(1,500) |
||
Acquisitions/disposals |
(5,115) |
4,888 |
63 |
(20,000) |
(3,000) |
||
Net interest |
0 |
0 |
0 |
0 |
0 |
||
Equity financing |
0 |
0 |
9,124 |
13,861 |
0 |
||
Dividends |
0 |
0 |
0 |
0 |
0 |
||
Other |
1,792 |
(4,408) |
350 |
(770) |
(210) |
||
Net Cash Flow |
(6,169) |
(246) |
13,316 |
(6,008) |
(400) |
||
Opening net debt/(cash) |
|
|
3,556 |
9,127 |
13,472 |
(1,156) |
8,825 |
FX |
75 |
53 |
(199) |
0 |
0 |
||
Other non-cash movements |
522 |
(4,153) |
1,511 |
(3,972) |
0 |
||
Closing net debt/(cash) |
|
|
9,127 |
13,472 |
(1,156) |
8,825 |
9,225 |
Source: Company accounts, Edison Investment Research
|
|||||||||||||||||||||||||||||||||||||||||||||||||||
|
|
On 21 May, Electra Private Equity (ELTA) announced the board’s intention to demerge Fridays – the largest of the two operating businesses (74% of ELTA’s NAV) – onto the FTSE Main Market and, subsequently, to bring Hotter Shoes (10% of NAV) to AIM through reclassification of the Electra entity. This followed the 15 April announcement about the disposal of Sentinel for £22.2m (58.1p per share), £11.3m higher than the asset’s carrying value on the balance sheet at 30 September 2020. ELTA has been following a realisation strategy since October 2016, when it had a market cap of c £1.7bn, and has since returned c £2bn to shareholders. Since our December 2020 initiation note, the shares have appreciated from a 22% discount to NAV to currently trading at a 7% premium. The share price has almost doubled from 275.5p to 550.5p per share.