Focusrite
Written by
Focusrite |
Tuned in |
Initiation of coverage |
Consumer electronics |
14 September 2016 |
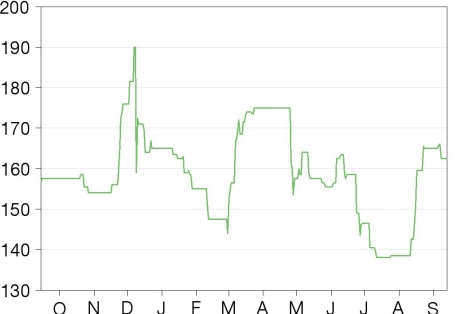
Share price performance
Business description
Next events
Analysts
Focusrite is a research client of Edison Investment Research Limited |
|||||||||||||||||||||||||||||||||||||||||||||||||
Focusrite is using technology to tap into the growing popularity of both creating and recording live music. Understanding its customers as fully as its technology, it leads its field with products like Scarlett and Novation Launchpad. With a vision of making music-making easier, the growth strategy is based on expanding its markets and ranges with innovative and disruptive products, and it is already moving on to app and smartphone technology. It has led in its fast-developing product areas to date and is well equipped to continue, with added potential to move into new ones.
Year |
Revenue (£m) |
PBT* |
EPS* |
DPS |
P/E |
EV/EBITDA |
Yield |
08/14 |
41.0 |
6.5 |
10.1 |
N/A |
16.2 |
11.0 |
N/A |
08/15 |
48.0 |
7.2 |
10.5 |
1.8 |
15.5 |
9.5 |
1.1 |
08/16e |
54.0 |
7.1 |
10.7 |
2.0 |
15.2 |
9.0 |
1.2 |
08/17e |
61.1 |
7.7 |
11.5 |
2.1 |
14.1 |
8.2 |
1.3 |
08/18e |
67.3 |
8.5 |
12.7 |
2.2 |
12.8 |
7.1 |
1.4 |
Note: *PBT and EPS are normalised, excluding amortisation of acquired intangibles, exceptional items, but after share-based payments. EPS are diluted.
Leading owner and developer of music products
The company is a leading global brand owner and developer of music-related equipment. Its main brand groups are Focusrite, the global leader in audio interfaces with ranges spanning personal users to major commercial customers, and Novation, which is a leader in music generation technology. Recent brand extensions take it into app and mobile technology extensions of the core brands.
A tested growth strategy
The strategy is to innovate, disrupt, make music easy and expand both organically and by acquisition. Management is deeply experienced in the technical product areas, and more importantly in customers’ practical usage and requirements. With only 11% of its addressable market, Focusrite has significant expansion headroom and, we think, the ability to execute on that, as in the past. The balance sheet is well equipped for acquisitions, with net cash of £5.6m, forecast to rise by c £2m pa.
Underlying momentum should emerge in FY17
Results show the company continuing to progress, although in FY16 marketing support has also been stepped up, particularly around the successful relaunch of the key Scarlett product range, with currency effects also masking underlying growth. While we expect those factors to slow EPS growth in FY16 to 2%, we expect the momentum of effectively marketed new brands to drive EPS growth of 8% for FY17, rising to double digits in FY18.
Valuation: DCF valuation of 202p
Focusrite’s challenge is to remain at the forefront of a competitive field of technical developments and to market those to a demanding user group. We believe the company is well positioned to achieve this. We value the shares using a DCF projection to place a value of 202p on the longer-term income stream available to investors.
Investment summary
Company description: Global music and audio products group
Focusrite is a global music and audio products group supplying hardware and software products used by professional and amateur musicians, which enables the high-quality production of music. It trades through two main brand groups: Focusrite and Novation, and also distributes two significant specialist audio brands. The Focusrite brand group (around two-thirds of the business) relates to audio recording equipment. The Novation brand (around one-third of the business) focuses on hardware and software for creating and playing electronic dance music. The strategy is to pursue growth through innovating, disrupting, technically making music easy, and by expansion. The company’s products are sold through a stable base of key distributors and resellers, with a number of large customers that have a long track record with the group.
Valuation: DCF valuation of 202p reflects strong positioning
Focusrite is a relatively small company with a meaningful share in a specialist market. Its success in growing its earnings and dividend stream depends on its ability to remain at the forefront of a competitive field of technical developments and to market those to a demanding user group. We believe the company is well positioned to achieve this, and use a DCF projection to place a value of 202p on the longer-term income stream available to investors. That would put the shares on an FY17e P/E of 17.5x and EV/EBITDA of 10.3x. We also consider valuation in relation to a peer group of smaller companies on near-term earnings expectations, albeit there are few close peers. Focusrite trades at a P/E discount and an average EV/EBITDA premium to the group, suggesting that the P/E rating reflects the benefit of its favourable capital and tax structure.
Financials: Inflexion point
FY15 and H116 results see the company continuing to progress across its brand portfolio, although marketing costs and currency effects have flattened underlying profit and earnings growth. Pre-tax profit and diluted earnings per share grew by 10% and 4% in FY15 respectively. In H116, operating profit was flat on a combination of both factors, and the second half saw some major brand launches, particularly the second-generation Scarlett range, which was associated with a short-term step-up in marketing support. Reflecting the pre-close statement, we forecast flat pre-tax profit and 2% EPS growth to £7.1m and 10.7p respectively in FY16. With the Scarlett relaunch in June 2016, near the end of the financial year, we expect significant momentum carrying over into FY17 which, combined with other new products during the year, should drive 8% growth in PBT and EPS to £7.7m and 11.5p respectively.
Sensitivities: Demand, technology, currency management
Sensitivities include the cyclicality of consumer demand in its ultimate markets and the continued technical execution of excellent new products. Our forecast assumes that the company will continue to identify and exploit new technological and product opportunities that build its share of market and monetise its substantial investment in R&D. Focusrite has a currency risk on its 27% euro-denominated revenue component, although it has a substantial natural hedge to the US$ as its c 50% US$ revenue exposure is roughly matched by its 100% cost of sale exposure to the currency. Focusrite has dependence on a small number of suppliers, key resellers and distributors, so that the interruption of such relationships could be damaging. The achievement of the company’s plans also depends on the knowledge, judgments and actions of the management team, so that continuity is important and unexpected change could bring risks (we note the CEO is retiring, but an orderly succession is planned).
Company description: Products for music making
Focusrite is a global music and audio products group supplying hardware and software products used by professional and amateur musicians, which enables and facilitates the high-quality production of music. The strategy is to pursue growth through innovation, disruption, making music easy and by expansion, both organic and by acquisition if the right opportunities arise.
Two brand groups: Focusrite and Novation
Focusrite has two main brand groups. The Focusrite brand group (64% of FY15 revenue) covers audio recording equipment. The Novation brand (30% of FY15 revenue) focuses on hardware and software for creating and playing electronic dance music (EDM) and other types of music. Although the company’s origins lie in professional studio recording equipment, the brands are targeted at the full spectrum of musicians. In fact, the company seeks to align itself with the evolution of music-making from the professional/amateur divide of the past, to an environment where flexible technology is able to serve musical talent universally.
■
The company aims to provide the best quality product at each price point.
■
Its products range from budget personal spend to the highest professional specifications, with consistent high standards throughout.
■
Product ranges are continuously refreshed to remain at the forefront of the market.
■
Its markets are fully international, with H116 revenue split 47% EMEA, 35% US and 18% RoW.
History: Sound recording roots
The Focusrite brand developed from the revolutionary pre-amp ISA 110 designed by sound engineer Rupert Neve for George Martin in 1985, which formed the basis of a renowned family of studio consoles in the 1980s and 1990s. Phil Dudderidge, who had sold his own audio business Soundcraft, acquired the business in 1989. Further early history is on YouTube. The Novation business was acquired in 2004. Before the IPO of December 2014, 77% of the 58.1m shares were held by the chairman, with the balance mainly held by other directors and managers. The IPO was by way of a vendor placing of 17.8m shares at 126p, the main effect of which was to bring in a range of institutional investors and reduce Phil Dudderidge’s holding to 52%. No new funds were raised.
Divisional review
Focusrite brand (64% of FY15 revenue)
The main brand categories are:
■
Scarlett: an industry-leading audio interface, generating about two-thirds of the division’s revenue. Typical customers are instrumentalists seeking to record material. Scarlett combines sound quality, connection speed and easy operation, offering studio-quality analogue to digital conversion at prices accessible to the individual. For instance, the Scarlett Solo, at $99, has a 2-in/2-out USB interface and a 106dB dynamic range. It features a high headroom instrument input of +14dBu, 24-bit audio with sample rates up to 96kHz and direct latency-free monitoring. Quality is reflected in the aluminium body, and price points are US$99-499, with larger models having additional inputs and outputs. The second generation, launched in June 2016, reflects design improvements, embedded technology and software giving enhanced performance.
■
Clarett: a professional range with lower noise and higher gain characteristics than Scarlett. It is centred around the industry-specific Thunderbolt connection protocol, enabling faster data transfer and low latency. Models encompass two, four and eight preamps, have a full aluminium finish and are priced at US$499-1,299. Clarett moves on from the previous professional range, Saffire.
■
RedNet: RedNet is an extremely scalable, near zero latency audio distribution system (150-500 microseconds) that can be used to expand I/O channel count, interface digital components and bridge between Pro Tools|HD or MADI and the Dante audio network. It is aimed at the B2B market including TV and radio, the communications industry, education, music venues and multi-site remote locations. Commercial communications are rapidly developing from technologies using standard networking or fibre-optic cable to ethernet cable, which has hugely increased functionality per unit cost. Product reviews note that the capacity of RedNet 1 and 2 to easily accept and route signals in AES, ADAT or S/PDIF formats is very useful, that the capacity for 128 channels of I/O is powerful and that technical performance is very good, with an AES17 dynamic-range figure of 119dB A-weighted, THD+N distortion below 0.001%, and crosstalk between channels under -90dB. Customers include NBC, the BBC and Microsoft, with price points for RedNet models 1 to 6 at US$400-3,500.
■
Other brand ranges: the iTrack range allows users to connect and record using mobile technology such as the iPhone, and retails from $69. At the other end of the spectrum, in March 2016 Focusrite launched its “Red” series, which is at the high end of the professional market, and the first product has received acclaim in the trade press.
Novation brand (30% of FY15 revenue)
Novation’s range of products facilitates the creation of music. There are four categories:
1.
Synthesisers: the original Novation product, these are highly compressed compared with early designs and are typically a portable unit with a short keyboard. There are three ranges: Bass Station II (analogue monosynth), MiniNova (digital microsynth) and UltraNova (analogue-modelling synth).
2.
Launchpad: a disruptive product which created a new market from 2009. Its key feature is that it dispenses with a keyboard in favour of a grid of lighted keys, used to create bass, drums and melody. The product was featured in Pop Culture, a YouTube mash-up created by the 17-year old Hugo Pierre Leclercq (aka Madeon) in July 2011. The video went viral with 31 million views. Supported by industry-standard software Ableton, Launchpad has been extended to a family including Launchpad Pro, and Launchpad Mini. Musictech.net, reviewing the Launchpad Pro, noted new features including velocity-sensitive colour RGB pads, hardware MIDI, mains power and an array of edit buttons. Price points are US$99-299.
3.
Keyboard controllers: Novation’s keyboard controllers integrate with Ableton or other studio software to create sounds. Products include:
•
Launchkey mini: a compact 25-note MIDI keyboard controller with 16 additional pads;
•
Launchkey: MIDI controller with 25, 49 or 61 keys with pads, knobs and faders;
•
Impulse: higher-spec controller in the same note sizes with fully assignable controls; and
•
SL MkII, an advanced professional range with the same range of note sizes.
4.
Groovebox/Circuit: launched October 2015, a standalone grid-based portable unit capable of producing its own synth, drum machine and sample sequences through its own speaker, as well as connecting to other hardware.
The Launchpad concept has now been extended to the app sphere: Launchpad for IoS is a freemium model, with enhancements priced at US$1.49-4.99. The latest app development Blocs Wave, which includes the facility to record the sounds generated, is priced at US$6.99.
Distribution (6% of FY15 revenue)
The company is the UK distributor for the leading brands KRK (studio monitors) and sE Electronics (microphones). These are adjacent areas technically and could be of future strategic interest as product areas into which Focusrite could expand.
Established distribution and supply chain
While all its products are designed and developed in its High Wycombe head office, they are manufactured in China by three major manufacturers and sold worldwide via a network of key distributors and resellers. 63% of sales are marketed directly to resellers and dealers, while the other 37% go through distributors in c 160 territories. The company has three third-party logistics warehouses in China, the US and the UK. It has a US office numbering 25 people and has just opened a small one in Hong Kong. A number of its large customers have a long track record with the group.
Growth strategy
Focusrite’s strategy is to pursue growth through innovating, disrupting, making music easy and by expansion, both organic and via complementary acquisitions if the right opportunity arises.
Innovation
Focusrite has shown its ability to lead both its main markets in innovating new products that successfully differentiate the market. Focusrite-branded products achieved 70% Net Promoter Scores in FY15, compared with competitors Apogee 62% and UA 61%. In FY15 it launched 19 products and in June 2016 it had its largest new product launch ever in the form of the second-generation Scarlett range of eight products.
The company has a dedicated team of c 40 R&D specialists, which is split into five product groups with the capability to bring new products through design and testing and take them to market. The company spends 6-7% of revenue on product development and aims to generate around one-third of annual revenue from products launched in the last year. It is also clear that established products have an enduring lifecycle, which means that new products drive incremental growth.
|
Exhibit 1: Product revenue by year of introduction (£m) |
|
|
Source: Focusrite (December 2015) |
Disruption
Essential to Focusrite’s model is the profound change taking place in music-making. Both in terms of creating and recording music, technology is breaking down old barriers between professional and amateur equipment, enabling musicians to find new paths to listeners. The success of Novation’s Launchpad range is a clear example, but future opportunities are arguably greater in terms of online and virtual space. Here, the newest product team, Mobile and Tablet Software, is starting to make a serious contribution with the Launchpad apps, which have had more than 3m downloads.
Making music easy
Musical skill traditionally means a close relationship with instrumental technology, which probably explains why musicians are resistant to other technological changes. Only one in 15 musicians buys technology, but this may increase if the product is clear and intuitive to operate. The large recording consoles of the 1980s were manned by professional engineers, but comparable quality is achievable today by small-scale equipment operated directly by musicians. By de-skilling the technical challenges, Focusrite aims to make technology more accessible. Launchpad and Scarlett are examples of success, as are the recent apps. The product groups keep in constant touch with customers via the websites and through social media, monitoring their experience of the products.
Expansion
The expansion includes both geographical expansion and entering adjacent market segments.
Geographical expansion: although the company’s products are sold in 160 territories, H116 revenue was 47% from EMEA and 35% from the US, with only 18% from the rest of the world. Although management recognises that the US is its largest market in terms of absolute size, it sees Asia Pacific as its largest near-term opportunity. The company has recently opened a sales office in Hong Kong, replacing an independent sales agent. It is also investing in its e-commerce platform for the Chinese market and improving its management of distributors in the Asia Pacific region.
Adjacent market segments: the company has an 11% share of its addressable market, as estimated by management (see Focusrite’s market below). Electronic music production, recording and the commercial segments are the broad areas in which the company operates, and there are numerous specific markets where it is not yet represented. There are currently specific opportunities to develop the rapidly growing app market, as well as in mobile compatible technology, which is addressed by the iTrack range.
Management is actively considering which areas would be most attractive for expansion. Acquisitions could be part of a market entry plan, but only in support of a strategic market strategy.
Market and competition
The global music instrument and pro audio wholesale market was £2.7bn in 2013, according to Music Trades Magazine (source: Admission Document), growing at c 2% pa. However, that market is disparate and fragmented, including conventional instruments and traditional technology, as well as electronic technologies relevant to Focusrite. At the time of the IPO management estimated the addressable market for its portfolio was c £450m, being £250m in the recording segment, £100m in the EDM segment and £100m in the commercial segment. Against this, and allowing for market growth, FY16e revenue represents an 11% share. In addition, Focusrite’s five-year revenue CAGR of 22% is considerably higher than the market as a whole, benefiting from brand recognition and differentiation.
Significant competitor brands for the Focusrite division are PreSonus and Apogee (vs Scarlett) Avid Pro Tools and Universal Audio Apollo (vs Clarett), and Avid HD and Apogee Symphony (vs RedNet). Launchpad competes against Ableton Push and Akai APC Mini ranges. Management estimates a c 40% share of the mass interface market, 10% of the semi-professional Thunderbolt market and 2% of the commercial market. Management also believes that in the US, it is number one in the overall interface market, number two in the MIDI controllers market and number three in the groove production stations market. The innovative Launchpad design cannot be patent protected; however, management believes the company is number three in Novation’s market as opposed to number one in Focusrite’s.
It is difficult to define market share in the app market, with its lower barriers to entry. A search for EDM generators on AppCrawlr found over 100 apps. However, the Launchpad app has generated over 5m downloads, helped by, and helping, the strength of the Novation brand. We believe Novation’s ability to add advanced features to the Blocs Wave app will be key in this fast developing market.
In tune with social trends
Focusrite’s products connect with a home-based leisure movement, which is far outpacing overall consumer expenditure. Within consumer trends, audio visual equipment sales volumes in the UK have increased since 1997 by a CAGR of 14% against 2% for total consumer expenditure.
|
Exhibit 2: Audio visual equipment against consumer expenditure |
|
|
Source: ONS Consumer Trends. Chained volume measures, 1997 = 100 |
Management
The board is headed by executive chairman Phil Dudderidge, who has a lifetime of sound engineering experience (he was once sound engineer to Led Zeppelin). Dave Froker, CEO, is retiring later in 2016 (a search for a successor is underway). Jeremy Wilson, CFO, formerly of Regenersis, was appointed in 2014. Biographies are on page 12.
The senior management team has experience in all relevant product and market areas. Most managers are musicians as well as being qualified technically for their roles, and are passionate supporters of the strategy. The culture is entrepreneurial and opportunistic, and Focusrite has been included in the Sunday Times 100 Best Small Companies To Work For for the last five years.
Although the chairman is a 52% shareholder, he remains actively engaged with other shareholders, and the board is also advised by the two experienced non-executive directors: David Bezem, an investment banker formerly at Altium Corporate Finance, and Paul Dean, formerly group finance director of Ultra Electronics.
Sensitivities
Consumer demand: the company is subject to the cyclicality of demand in its consumer markets. Even for products aimed at the B2B market, demand is also ultimately driven by consumers.
Product quality: essential to Focusrite’s market leadership is the technical quality of its products, including numerous new ones. It has well-developed testing and product review capabilities; nevertheless, a product failure requiring a major recall would be a negative event. We believe that product excellence will continue to be a positive for the company.
Technological opportunities: our forecast assumes the company will continue to identify, exploit and market new product opportunities that build its share of market, and continue to monetise the investment in R&D. If instead the initiative were grasped by competitors, growth could be affected. There may be increased risk given an increasing market shift to software, such as apps. We note that the company has made strong progress with sales of the Launchpad and Blocs Wave apps and well as the hardware products.
Currency risk: Focusrite’s revenue is c 50% in US$ and 27% in euros, while nearly all its costs of sale are in US$. With gross margin at around 38%, there is therefore a substantial though not complete natural hedge against the US$. The company uses forward contracts to lock in certainty against euro exposure. However, this cannot shield it from longer-term exposures to both currencies. In FY15 there was a £0.2m upside or downside risk for each 10% change in sterling against the US$ or the euro. Recent sterling weakness has been factored into market forecasts.
Management team: in its technical product area, the achievement of the company’s plans depends on the knowledge, judgments and actions of the management team. Any unexpected changes in the team could affect the realisation of those plans, although we would not include the CEO’s planned retirement in that category.
Dependence on trade relationships: Focusrite has dependence on a small number of suppliers, key resellers and distributors, so that the interruption of such relationships could be damaging.
Valuation
Focusrite is a relatively small company with a meaningful share in a specialist technical market. Earnings and dividend growth depend on its ability to remain at the forefront of a competitive field of technical developments and to market those to a demanding user group. We believe the company is well placed to achieve this, and use a DCF projection to place a value on the longer-term income stream available to investors. We also consider valuation in relation to a peer group of smaller companies on near-term earnings expectations, albeit there are few close peers.
DCF valuation of 202p
Our DCF projection extends our forecast using similar revenue growth and margin assumptions for two years, and out to 10 years on growth fading in the last three years to a terminal rate of 2%. We assume terminal EBITDA margin of 19.0% (2018e: 17.5%) and capex investment at 7% of revenue, reducing to 6% in the terminal period. We assume an equity-only cost of capital of 8.4% (risk-free rate 3%, risk premium 6%, beta 0.9), resulting in a valuation of 202p/share (of which 126p is in the terminal value). That would put the shares on a FY17e PE of 17.5x and EV/EBITDA of 10.3x. Varying the cost of capital and the terminal growth assumption would give the following ranges:
Exhibit 3: DCF assumption scenario analysis (p)
------------------------------------------------------Terminal growth rate--------------------------------------------------- |
|||||
Cost of capital |
0.0% |
1.0% |
2.0% |
3.0% |
4.0% |
10.0% |
137 |
145 |
156 |
169 |
186 |
9.0% |
156 |
168 |
182 |
201 |
228 |
8.0% |
181 |
197 |
218 |
247 |
292 |
7.0% |
212 |
236 |
268 |
317 |
398 |
Source: Edison Investment Research
Varying our assumed sales growth and margin assumptions affects the valuation as follows:
Exhibit 4: Growth and margin assumption scenario analysis
---------------------------------------------Sales growth 2019-20--------------------------------------------------- |
||||||
8% |
9% |
10% |
11% |
12% |
||
Margin change pa 2020-25 |
0.4pp |
194 |
205 |
216 |
228 |
240 |
0.3pp |
188 |
198 |
209 |
220 |
232 |
|
0.2pp |
181 |
192 |
202 |
213 |
224 |
|
0.1pp |
175 |
185 |
195 |
205 |
216 |
|
0.0pp |
169 |
178 |
188 |
198 |
208 |
|
Source: Edison Investment Research
In addition, our valuation would change by ±26p for every 1pp change in our discount rate.
Peer group comparison: Inconclusive
There is no close peer on the London small-cap market, which is, in our view, the most appropriate context for Focusrite. We therefore define the peer group as other smaller tech, electronics and consumer companies, selecting relevant subsectors as detailed below. We also include companies in relevant product areas in US and European markets. This is far from an exact comparison, but does give some context in terms of market valuations in adjacent sectors.
Focusrite trades at a P/E discount but an average EV/EBITDA premium to the group, which is slightly inconclusive, but suggests that the P/E rating reflects the benefit of its favourable cash-rich capital structure and low tax rate resulting from its ongoing investment in R&D. Adjusting to the group in both years on average values Focusrite shares at 185p on a P/E basis and 169p on an EV/EBITDA basis. EV/Sales at around 1.5x is around 10% below peers.
Exhibit 5: Peer valuation
Calendarised |
Market cap |
EV |
P/E (x) |
EV/Sales (x) |
EV/EBITDA (x) |
||||||
Country |
Price |
CCYm |
£m |
£m |
2016 |
2017 |
2016 |
2017 |
2016 |
2017 |
|
Universal Electronics |
US |
73.2 |
1059 |
815 |
812 |
23.5 |
19.6 |
1.5 |
1.4 |
12.8 |
10.1 |
Tivo |
US |
21.7 |
2823 |
2171 |
2666 |
9.5 |
7.5 |
4.9 |
3.0 |
10.5 |
6.2 |
Morgan Adv. Materials |
UK |
291.2 |
832 |
832 |
1154 |
14.6 |
13.6 |
0.9 |
0.9 |
6.2 |
5.8 |
Photo-Me International |
UK |
165.6 |
614 |
614 |
525 |
20.3 |
19.1 |
2.2 |
2.2 |
7.2 |
7.5 |
E2V Technologies |
UK |
247.1 |
536 |
536 |
566 |
16.8 |
15.5 |
1.6 |
1.5 |
7.1 |
6.4 |
Oxford Instruments |
UK |
770.5 |
437 |
437 |
621 |
15.1 |
13.9 |
1.2 |
1.2 |
7.9 |
7.4 |
DTS |
US |
33.0 |
581 |
581 |
677 |
14.8 |
13.2 |
3.3 |
2.8 |
9.3 |
7.7 |
XP Power |
UK |
1690.0 |
325 |
325 |
331 |
15.7 |
14.6 |
2.0 |
1.9 |
7.8 |
7.1 |
Avid Technology |
US |
7.8 |
309 |
238 |
302 |
4.1 |
6.0 |
N/A |
N/A |
N/A |
N/A |
Gooch & Housego |
UK |
1044.0 |
249 |
249 |
222 |
24.5 |
21.8 |
2.0 |
1.7 |
9.8 |
8.3 |
TT Electronics |
UK |
147.0 |
247 |
247 |
329 |
14.5 |
12.9 |
0.5 |
0.4 |
5.1 |
4.6 |
Dialight |
UK |
655.0 |
215 |
215 |
221 |
26.1 |
18.3 |
0.9 |
0.8 |
9.3 |
6.5 |
Quixant |
UK |
220.0 |
142 |
142 |
150 |
18.3 |
16.2 |
1.8 |
1.6 |
10.6 |
8.9 |
Judges Scientific |
UK |
1447.5 |
88 |
88 |
95 |
13.6 |
13.2 |
1.3 |
1.1 |
7.2 |
6.4 |
B&C Speakers |
IT |
7.2 |
79 |
65 |
64 |
12.2 |
11.5 |
1.8 |
1.8 |
7.5 |
6.9 |
Trakm8 Holdings |
UK |
212.5 |
69 |
69 |
71 |
14.5 |
12.2 |
1.6 |
1.4 |
7.8 |
6.4 |
Gear4music (Holdings) |
UK |
236.0 |
48 |
48 |
55 |
41.8 |
23.7 |
0.7 |
0.6 |
14.3 |
9.2 |
Average |
17.6 |
14.9 |
1.8 |
1.5 |
8.8 |
7.2 |
|||||
Focusrite |
UK |
162.5 |
94 |
94 |
88 |
14.8 |
13.6 |
1.6 |
1.4 |
8.7 |
7.8 |
Premium/(discount) |
-15.9% |
-8.3% |
-11.8% |
-9.9% |
-0.5% |
8.2% |
|||||
Source: Bloomberg. LSE subsectors Electrical Components & Equipment, Computer Hardware, Recreational Products; relevant audio/video companies from US and European markets. Market cap £25m-1bn. Note: Outliers excluded from table. Prices as at 12 September 2016.
Financials
FY15 results
Revenue growth of 17% was boosted by the 29% growth in the US, where economic conditions were strong and products are distributed by Guitar Center (280 branches) and the online music business Sweetwater, as well as Amazon. Growth in EMEA with its weaker economic performance, was lower at 9.4%, although RoW (mainly Asia) grew 14.5% as the sales focus increased. Major product launches included the Clarett range and Scarlett Solo model, which moved the Scarlett brand below the $100 level, and Novation Launchpad Pro and Circuit products. Operating margin declined 110bp to 12.3%, although that was the result of plc costs. Cash (there is no debt) grew from £3.8m to £6.2m on trading, net of relatively modest capex and working capital increases.
H116 results
Revenue grew steadily at 8.7% (5.6% in constant currency), including a planned run-out of the first-generation Scarlett range ahead of the second-generation launch in H2. This particularly affected US growth of 7.0%. Growth in EMEA was 3.5%, although a weaker euro and distributor changes masked like-for-like growth of 7.0%. RoW grew strongly at 29%, reflecting sales emphasis in Asia, although still only representing 18% of total sales. Operating margin was down 110bp at 14.3%, again reflecting a full period of plc costs. This left operating profit flat at £3.7m. Underlying pre-tax profit fell from £4.2m to £3.0m, but this merely reflected mark-to-market of currency hedges in both years, which always unwind in H2. Cash reduced to £4.0m on working capital increases resulting from stocking up ahead of brand launches and an extension of credit for the US distributor.
Forecast
At pre-close on 14 September 2016, Focusrite confirmed that FY16 revenue was c £54m, representing growth of 12.5%, slightly above existing market expectations, with strong performance in the second half. We reflect this in our forecast.
We forecast FY16 PBT flat at £7.1m and EPS up 2% at 10.7p on reduced tax. Although revenue has grown significantly, costs have also risen. In particular, marketing campaigns around new products were actively stepped up in H2, and numerous launches in the year included the second-generation Scarlett range in June (Scarlett is Focusrite’s leading product offering by sales volume). Depreciation and amortisation are also rising faster than revenue and there has been some currency impact. Cash is confirmed at £5.6m, with the improvement from interim based, we believe, on a reduction in working capital outflows in the second half.
In FY17, we forecast 13% revenue growth to £61.1m, although that includes 4% of pure FX effects. While our underlying revenue growth assumption of 9% is not over-demanding, particularly given the well-received Scarlett relaunch close to the end of FY16, we see the increased marketing support driving higher sales, particularly in the key markets of North America and Asia. We forecast gross margin down 130bp to 36.4%, resulting from currency, leaving gross profit 9% ahead and, with operating costs growing at 10%, we forecast PBT and EPS up 8% to £7.7m and 11.5p respectively. After capex and working capital uses, we forecast cash rising £1.6m to £7.2m.
Strong balance sheet with ongoing control
With no debt on the balance sheet and our cash forecast increasing meaningfully, balance sheet issues have more to do with working capital control than bank debt. Although debtor days were deliberately increased in FY16 to reflect the reality of a 60-day credit period allowed to the US distributor, they are carefully controlled, there is now no right of return from such distributors and debtors are insured against major failure at a distributor. Although we forecast inventory turnover to be longer at end FY16 than previously as a result of the weight of new product launches close to year-end, we expect previous levels to be restored in FY17 and later.
Management said at IPO that it intended to pursue a progressive dividend policy with a yield of 1-2% at the placing price. That holds good currently with an FY15 yield of 1.1% and the interim dividend supporting an expectation of 1.95p for the year, a current yield of 1.2%, 5.5 times covered.
Exhibit 6: Financial summary
£000s |
2014 |
2015 |
2016e |
2017e |
2018e |
||
31-August |
IFRS |
IFRS |
IFRS |
IFRS |
IFRS |
||
INCOME STATEMENT |
|||||||
Revenue |
|
|
40,965 |
48,029 |
54,014 |
61,102 |
67,277 |
Cost of Sales |
(25,068) |
(29,381) |
(33,668) |
(38,847) |
(42,792) |
||
Gross Profit |
15,897 |
18,648 |
20,346 |
22,255 |
24,485 |
||
EBITDA |
|
|
8,228 |
9,302 |
9,818 |
10,674 |
11,776 |
Normalised operating profit |
|
|
6,432 |
7,024 |
7,141 |
7,730 |
8,507 |
Amortisation of acquired intangibles |
0 |
0 |
0 |
0 |
0 |
||
Exceptionals |
(722) |
(704) |
(537) |
0 |
0 |
||
Share-based payments |
0 |
0 |
0 |
0 |
0 |
||
Reported operating profit |
5,710 |
6,320 |
6,604 |
7,730 |
8,507 |
||
Net Interest |
100 |
164 |
0 |
0 |
0 |
||
Joint ventures & associates (post tax) |
0 |
0 |
0 |
0 |
0 |
||
Exceptionals |
0 |
0 |
0 |
0 |
0 |
||
Profit Before Tax (norm) |
|
|
6,532 |
7,188 |
7,141 |
7,730 |
8,507 |
Profit Before Tax (reported) |
|
|
5,810 |
6,484 |
6,604 |
7,730 |
8,507 |
Reported tax |
(763) |
(1,022) |
(857) |
(928) |
(1,021) |
||
Profit After Tax (norm) |
5,769 |
6,166 |
6,284 |
6,802 |
7,486 |
||
Profit After Tax (reported) |
5,047 |
5,462 |
5,747 |
6,802 |
7,486 |
||
Minority interests |
0 |
0 |
0 |
0 |
0 |
||
Discontinued operations |
0 |
0 |
0 |
0 |
0 |
||
Net income (normalised) |
5,769 |
6,166 |
6,284 |
6,802 |
7,486 |
||
Net income (reported) |
5,047 |
5,462 |
5,747 |
6,802 |
7,486 |
||
Basic average number of shares outstanding (m) |
49.2 |
52.4 |
52.9 |
54.0 |
55.0 |
||
EPS - basic normalised (p) |
|
|
11.7 |
11.8 |
11.9 |
12.6 |
13.6 |
EPS - diluted normalised (p) |
|
|
10.1 |
10.5 |
10.7 |
11.5 |
12.7 |
EPS - basic reported (p) |
|
|
10.3 |
10.4 |
10.9 |
12.6 |
13.6 |
Dividend (p) |
0.00 |
1.80 |
1.95 |
2.10 |
2.22 |
||
Revenue growth (%) |
13.5 |
17.2 |
12.5 |
13.1 |
10.1 |
||
Gross Margin (%) |
38.8 |
38.8 |
37.7 |
36.4 |
36.4 |
||
EBITDA Margin (%) |
20.1 |
19.4 |
18.2 |
17.5 |
17.5 |
||
Normalised Operating Margin |
15.7 |
14.6 |
13.2 |
12.7 |
12.6 |
||
BALANCE SHEET |
|||||||
Fixed Assets |
|
|
4,008 |
5,264 |
6,411 |
7,794 |
9,289 |
Intangible Assets |
3,035 |
3,941 |
4,728 |
5,712 |
6,802 |
||
Tangible Assets |
939 |
1,323 |
1,683 |
2,082 |
2,487 |
||
Investments & other |
34 |
0 |
0 |
0 |
0 |
||
Current Assets |
|
|
16,884 |
22,766 |
27,740 |
33,229 |
38,800 |
Stocks |
6,596 |
8,633 |
12,084 |
13,836 |
15,241 |
||
Debtors |
6,367 |
7,737 |
9,805 |
11,928 |
13,134 |
||
Cash & cash equivalents |
3,803 |
6,173 |
5,625 |
7,233 |
10,189 |
||
Other |
118 |
223 |
227 |
232 |
237 |
||
Current Liabilities |
|
|
(7,120) |
(8,809) |
(10,128) |
(11,517) |
(12,646) |
Creditors |
(6,688) |
(8,406) |
(9,725) |
(11,114) |
(12,243) |
||
Tax and social security |
(432) |
(403) |
(403) |
(403) |
(403) |
||
Short term borrowings |
0 |
0 |
0 |
0 |
0 |
||
Other |
0 |
0 |
0 |
0 |
0 |
||
Long Term Liabilities |
|
|
(564) |
(743) |
(909) |
(1,117) |
(1,347) |
Long term borrowings |
0 |
0 |
0 |
0 |
0 |
||
Other long term liabilities |
(564) |
(743) |
(909) |
(1,117) |
(1,347) |
||
Net Assets |
|
|
13,208 |
18,478 |
23,115 |
28,389 |
34,097 |
Minority interests |
0 |
0 |
0 |
0 |
0 |
||
Shareholders' equity |
|
|
13,208 |
18,478 |
23,115 |
28,389 |
34,097 |
CASH FLOW |
|||||||
Op Cash Flow before WC and tax |
8,228 |
9,302 |
9,818 |
10,674 |
11,776 |
||
Working capital |
2,151 |
(1,689) |
(4,200) |
(2,487) |
(1,482) |
||
Exceptional & other |
(722) |
(591) |
(537) |
(0) |
(0) |
||
Tax |
(826) |
(838) |
(857) |
(928) |
(1,021) |
||
Net operating cash flow |
|
|
8,831 |
6,184 |
4,225 |
7,260 |
9,273 |
Capex |
(2,570) |
(3,559) |
(3,948) |
(4,519) |
(5,096) |
||
Acquisitions/disposals |
0 |
0 |
0 |
0 |
0 |
||
Net interest |
59 |
6 |
0 |
0 |
0 |
||
Equity financing |
233 |
0 |
154 |
0 |
0 |
||
Dividends |
(4,244) |
(314) |
(979) |
(1,133) |
(1,221) |
||
Other |
(86) |
53 |
0 |
0 |
0 |
||
Net Cash Flow |
2,223 |
2,370 |
(548) |
1,608 |
2,956 |
||
Opening net debt/(cash) |
|
|
(1,580) |
(3,803) |
(6,173) |
(5,625) |
(7,233) |
FX |
0 |
0 |
0 |
0 |
0 |
||
Other non-cash movements |
0 |
0 |
0 |
0 |
0 |
||
Closing net debt/(cash) |
|
|
(3,803) |
(6,173) |
(5,625) |
(7,233) |
(10,189) |
Source: Focusrite, Edison Investment Research
|
|||||||||||||||||||||||||||||||||||||||||||||||||||
|
|